

Earlier today, the U.S. Bureau of Economic Analysis showed that gross domestic product dropped by 0.7% in the first quarter of 2015, while the Chicago PMI declined to 46.2 in May, missing expectations for an increase to 53.0. Thanks to these disappointing numbers, the USD Index moved lower and slipped below 97. How did this move affect the short-term picture of our six currency pairs?
In our opinion the following forex trading positions are justified - summary:
- EUR/USD: Short positions (stop-loss order at 1.1667)
- GBP/USD: Short positions (stop-loss order at 1.5913)
- USD/JPY: none
- USD/CAD: Long positions (stop-loss order at 1.1706)
- USD/CHF: none
- AUD/USD: Short positions (stop-loss order at 0.8194)
EUR/USD
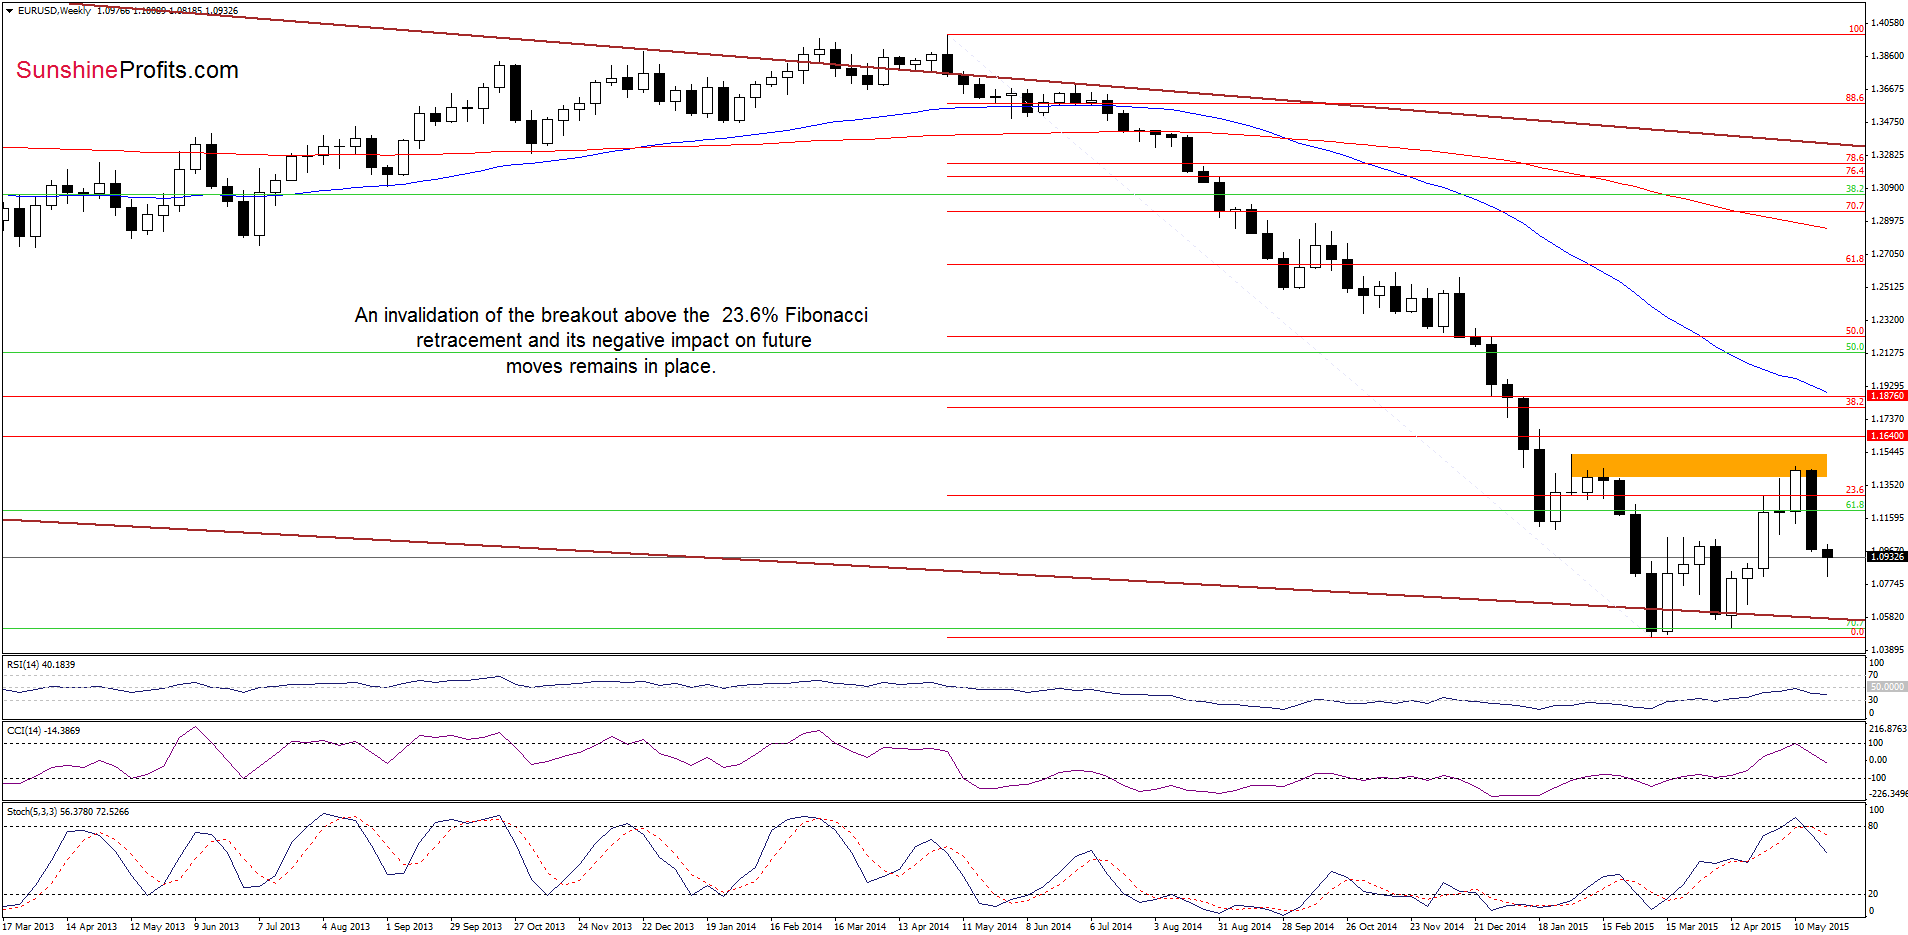
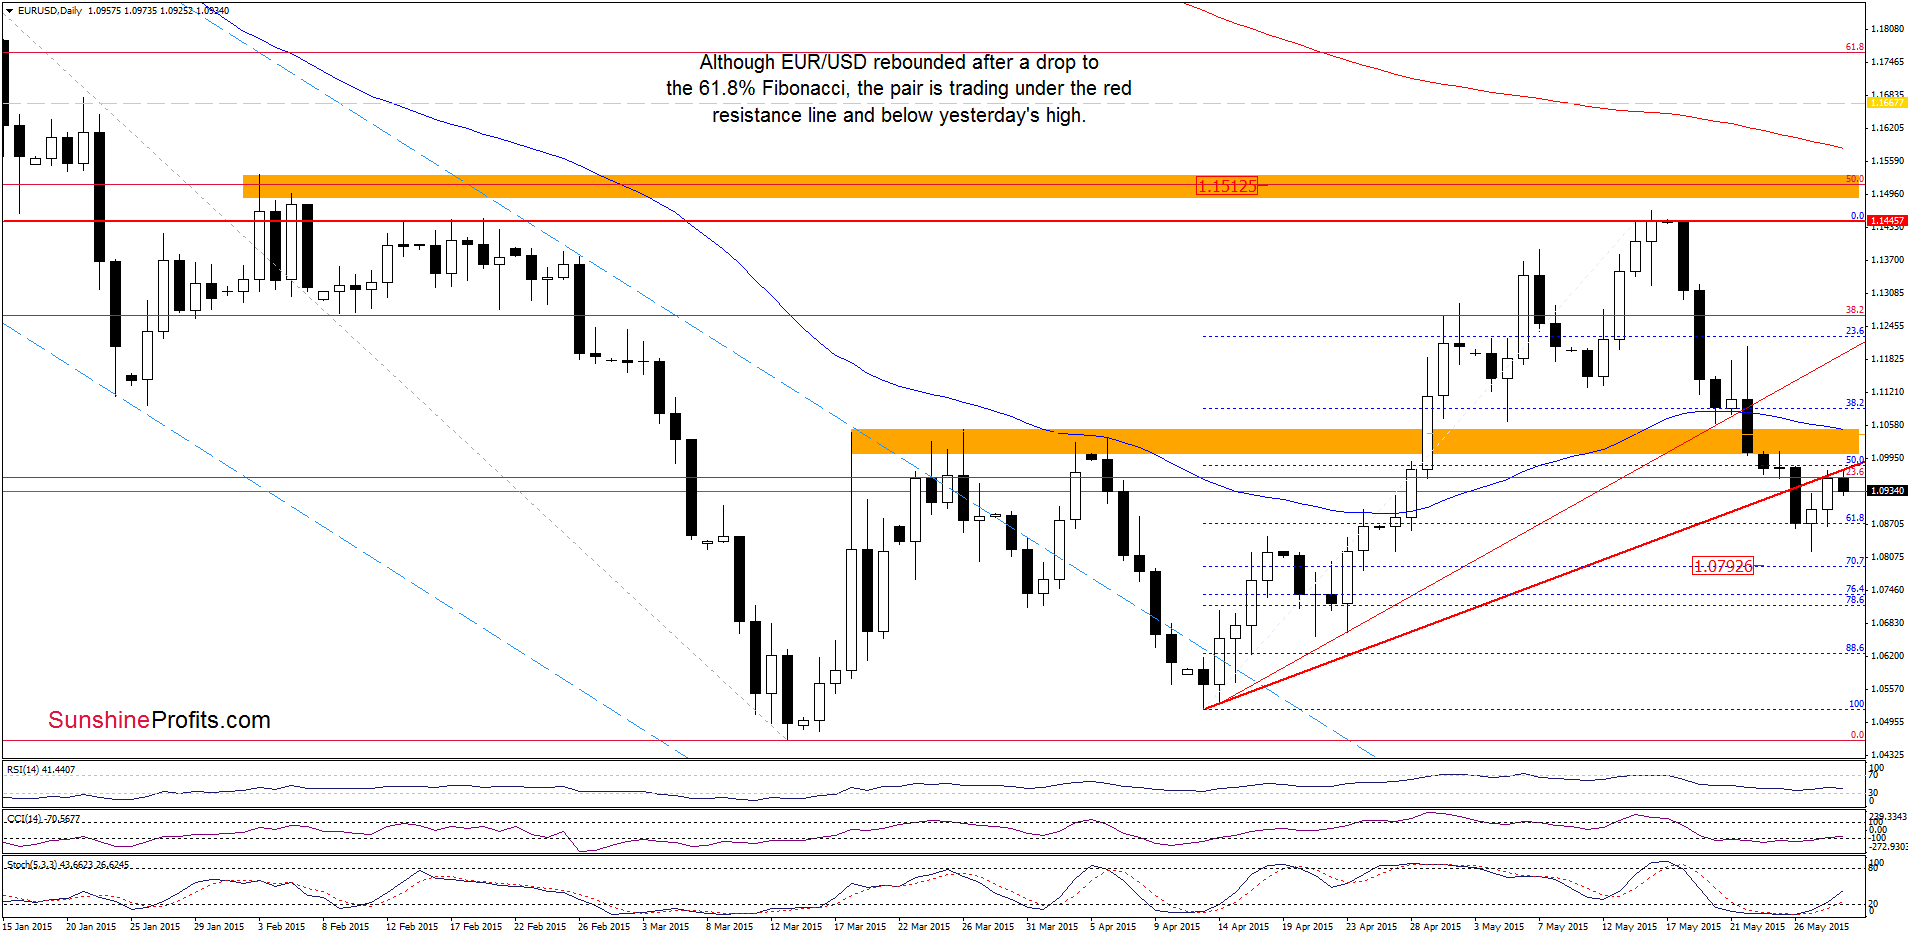
Yesterday, EUR/USD extended gains and climbed to the previously-broken red resistance line, approaching the orange zone. Despite this move, the pair reversed and declined slightly earlier today. If the exchange rate moves lower from here, the recent upward move would be nothing more than a verification of earlier breakdown and we’ll likely see a test of the recent low. However, taking into account a buy signal generated by the Stochastic Oscillator, it seems that currency bulls will try to push the pair higher and test the strength of the orange resistance zone, which is currently reinforced by the 50-day moving average.
Very short-term outlook: bearish
Short-term outlook: mixed with bearish bias
MT outlook: mixed
LT outlook: mixed
Trading position (short-term; our opinion): Short positions (which are profitable) with a stop-loss order at 1.1667 are justified from the risk/reward perspective at the moment. We will keep you informed should anything change, or should we see a confirmation/invalidation of the above.
GBP/USD
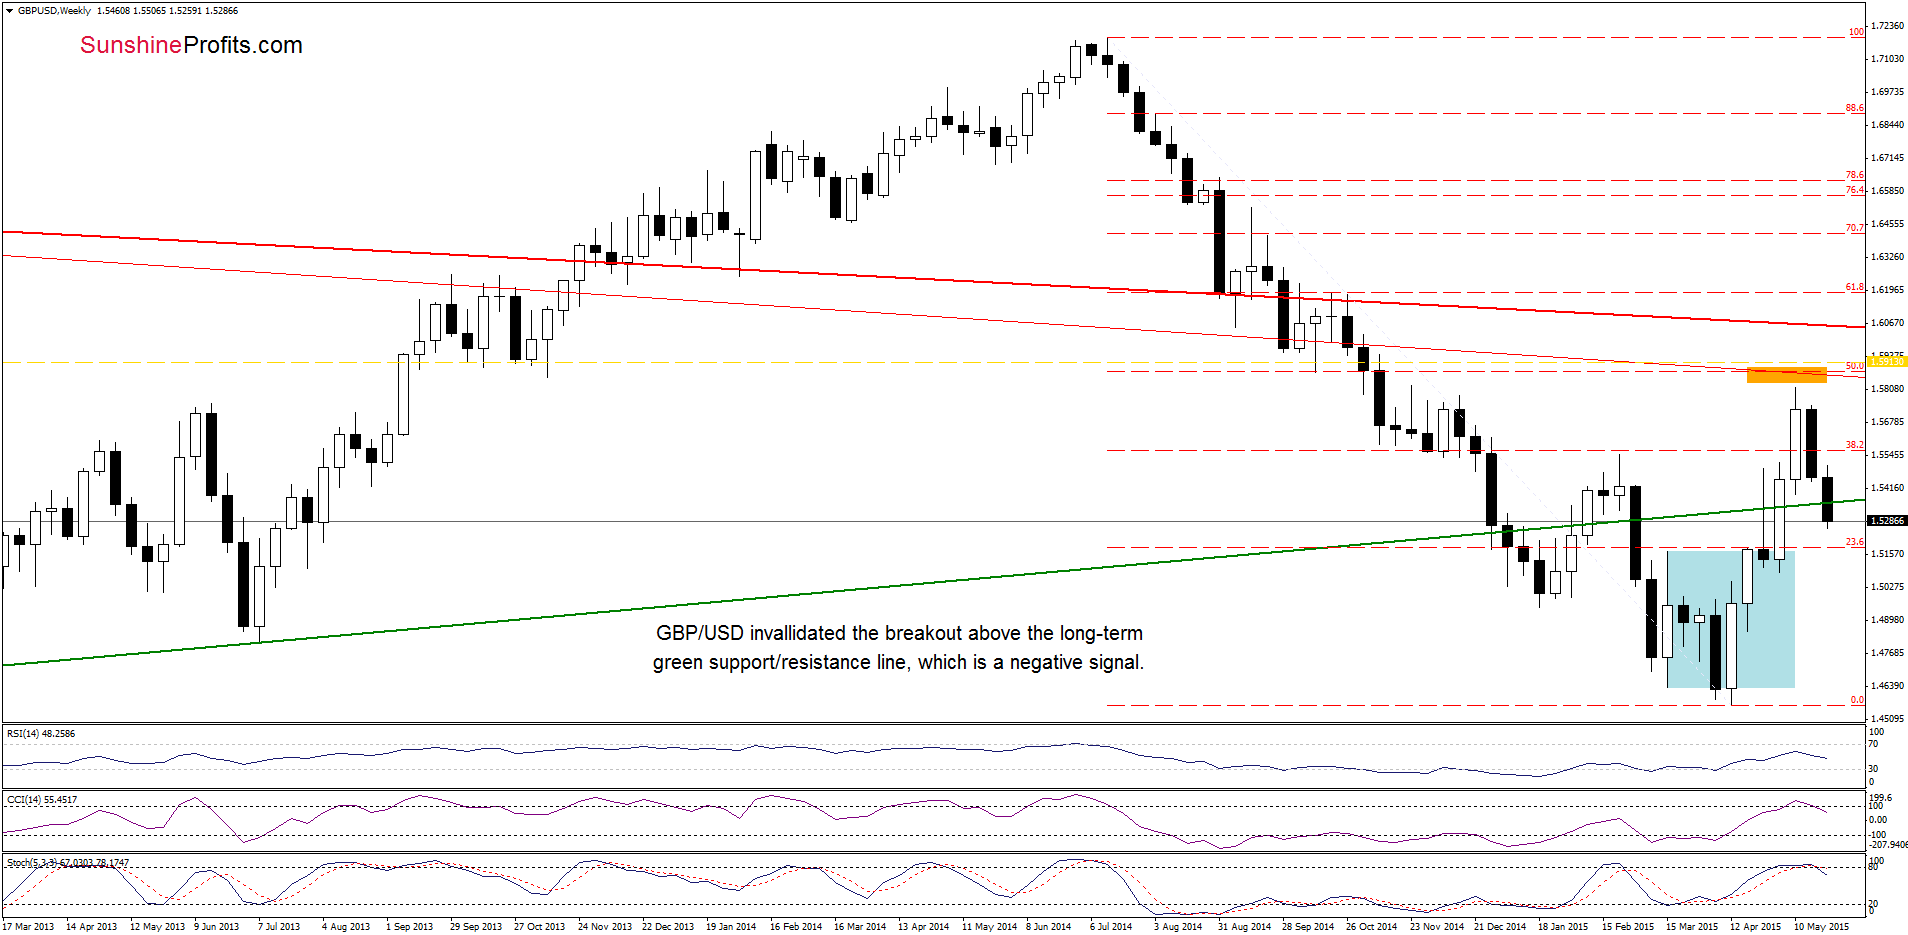
From the medium term perspective, we see that GBP/USD still remains under the long-term green support line (which serves a resistance at the moment), which means that an invalidation of the breakout above this line and its negative impact on future moves is still in effect, suggesting further deterioration.
Having said that, let’s examine the daily chart and find out what can we infer from the very short-term picture.
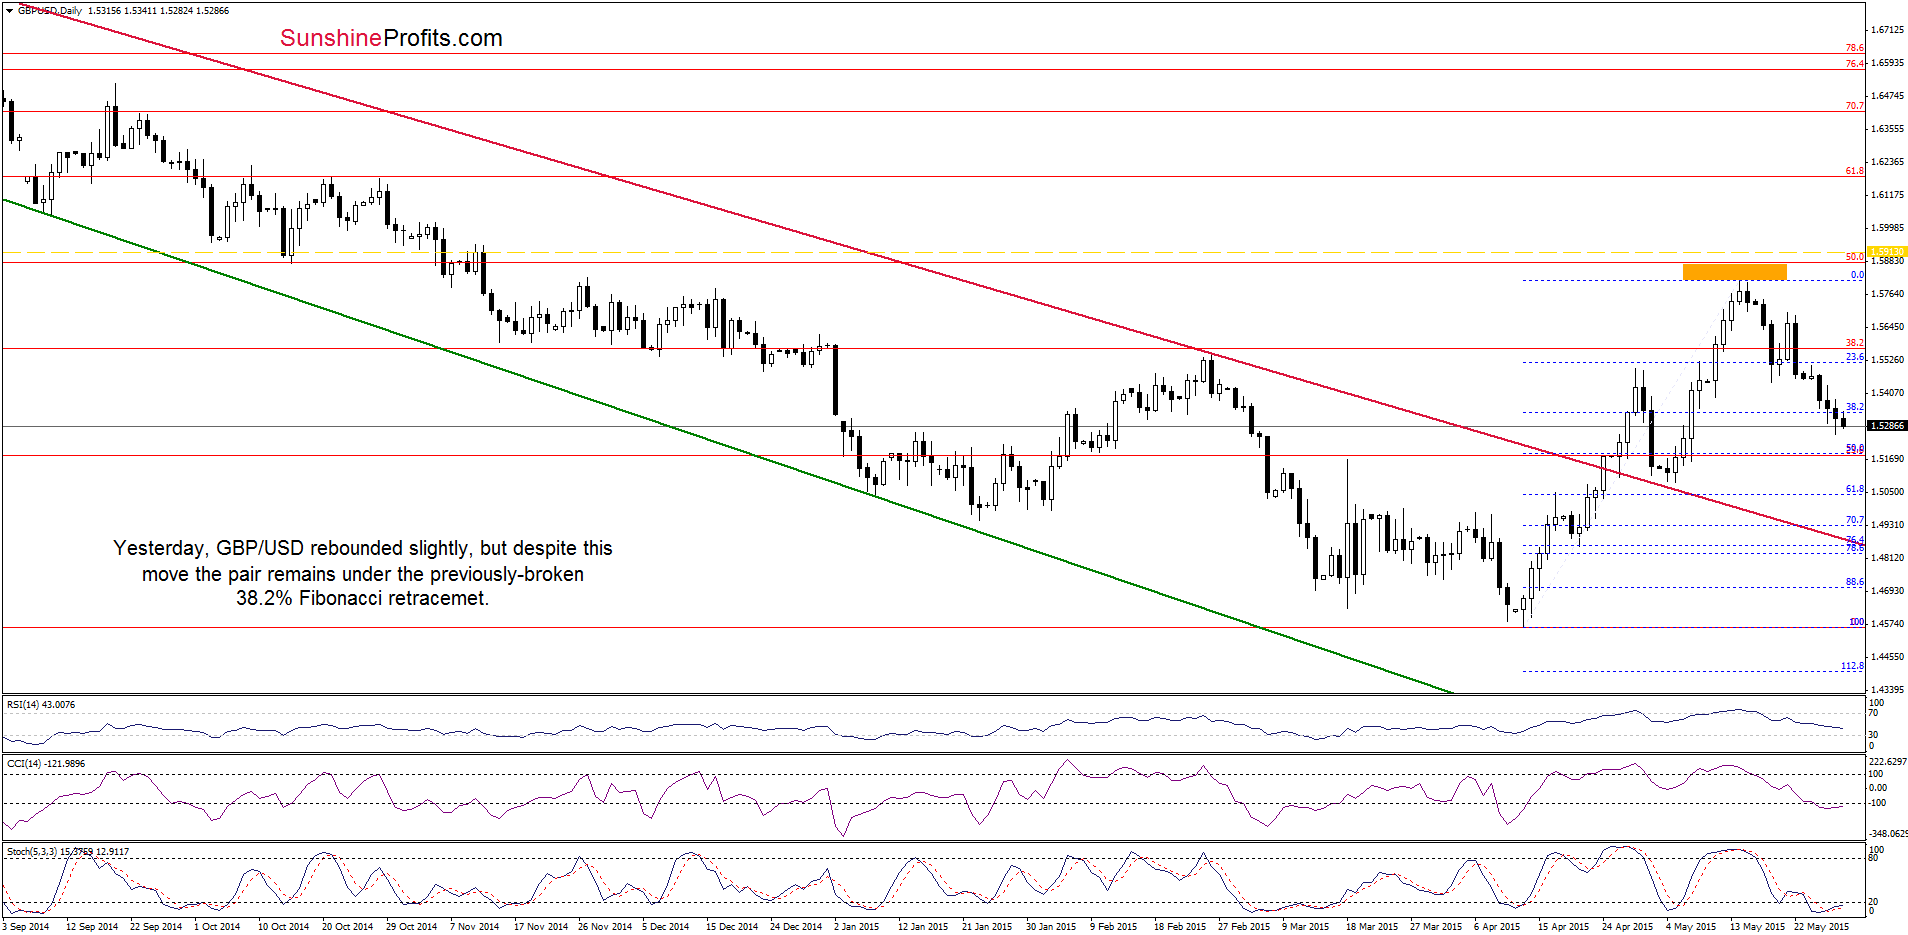
On the daily chart, we see that although GBP/USD rebounded slightly, the pair is trading under the previously-broken 38.2% Fibonacci retracement, which suggests further correction and a drop to the 50% retracement (around 1.5190) in the coming days.
Very short-term outlook: bearish
Short-term outlook: mixed with bearish bias
MT outlook: mixed
LT outlook: mixed
Trading position (short-term; our opinion): Short positions (which are profitable) with a stop-loss order at 1.5913 are justified from the risk/reward perspective at the moment. We will keep you informed should anything change, or should we see a confirmation/invalidation of the above.
USD/JPY
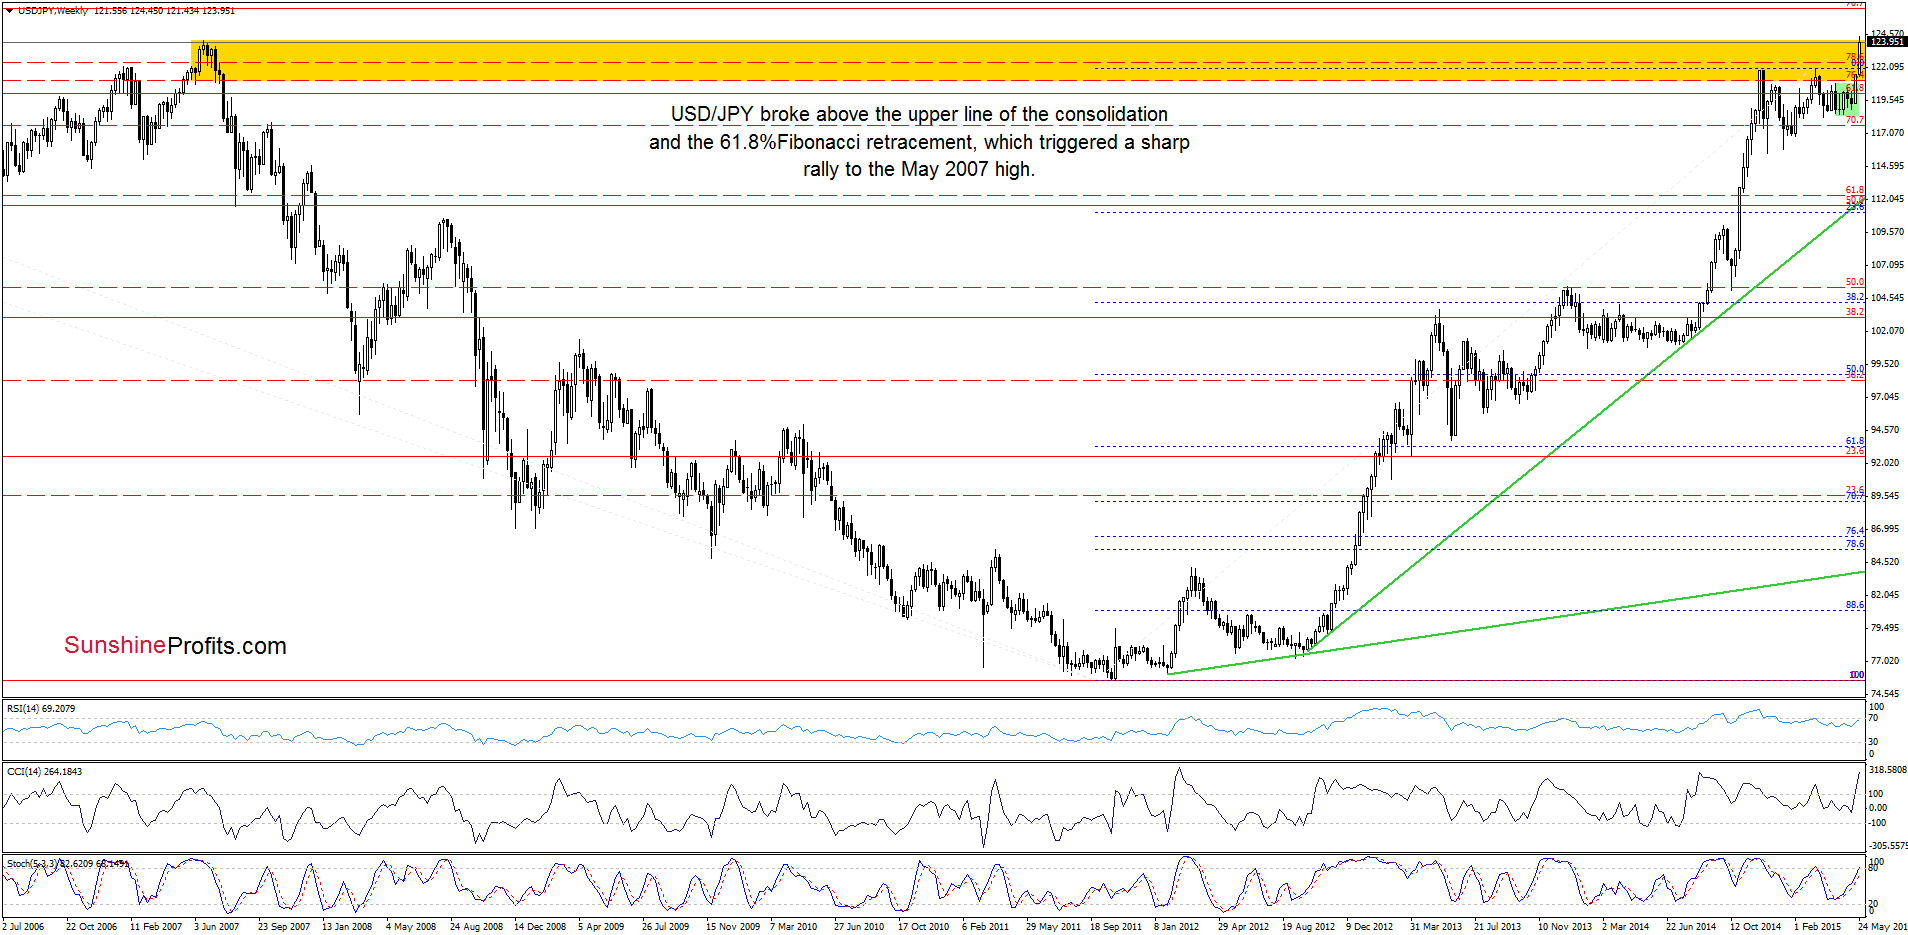
The medium-term picture has improved as USD/JPY broke above the upper line of the consolidation (marked with green) and the 61.8% Fibonacci retracement level. This positive event triggered a sharp rally, which took the exchange rate above the 76.4% and 78.6% Fibonacci retracement levels and resulted in an increase above the June 2007 high. Although the pair invalidated this small breakout, USD/JPY is still trading slightly below this resistance level, which in combination with buy signals generated by the indicators suggests that another attempt to move higher can’t be ruled out.
Will we see further improvement in the coming days? Let’s focus on the very short-term chart and find out.
Quoting our last commentary on this currency pair:
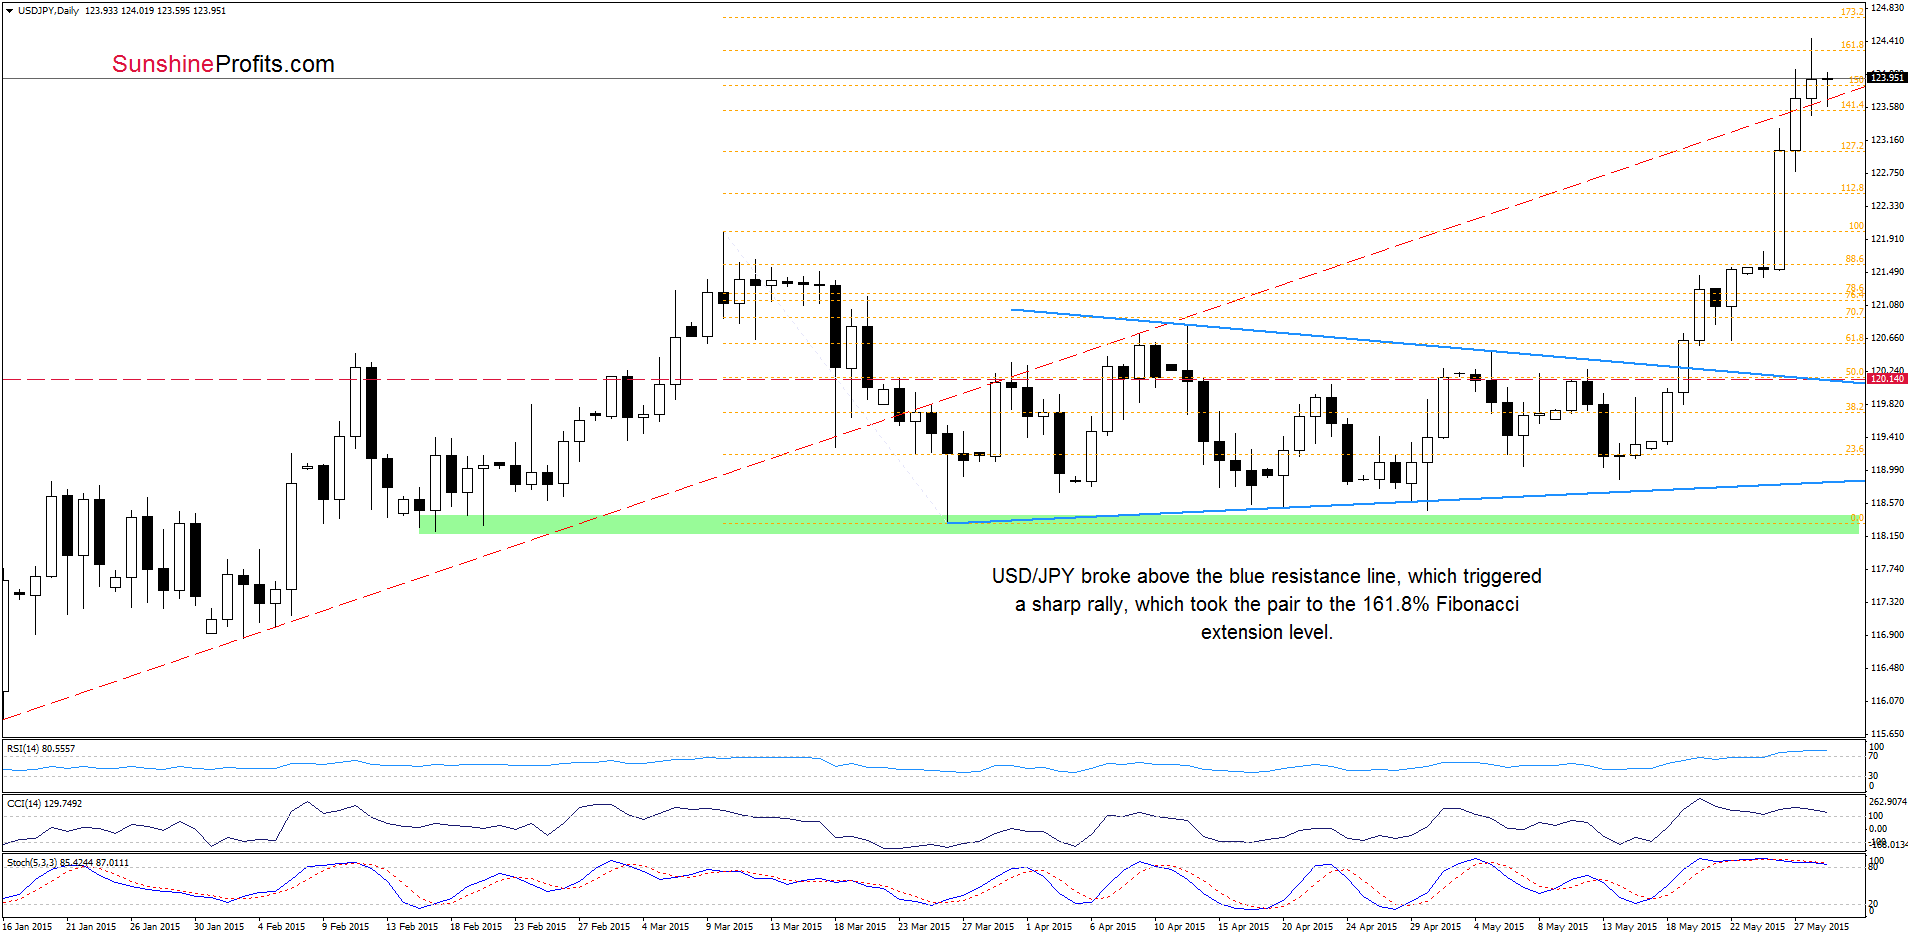
(…) buy signals generated by the daily indicators support further improvement. If this is the case, and the exchange rate moves higher from here, we’ll see a test of the strength of the blue resistance line (which is also the upper line of the triangle). If it is broken, the next target would be around 120.83, where the Apr 13 high is.
As you see on the daily chart, currency bulls not only took the exchange rate to our upside target, but also managed to push USD/JPY above it. With this upward move, the exchange rate broke above the red dashed resistance line and climbed to the 161.8% Fibonacci retracement, which suggests that we could see a pullback from here in the coming week (especially if the indicators generate sell signals).
Very short-term outlook: mixed
Short-term outlook: mixed
MT outlook: mixed
LT outlook: bullish
Trading position (short-term; our opinion): No positions are justified from the risk/reward perspective at the moment. We will keep you informed should anything change, or should we see a confirmation/invalidation of the above.
USD/CAD
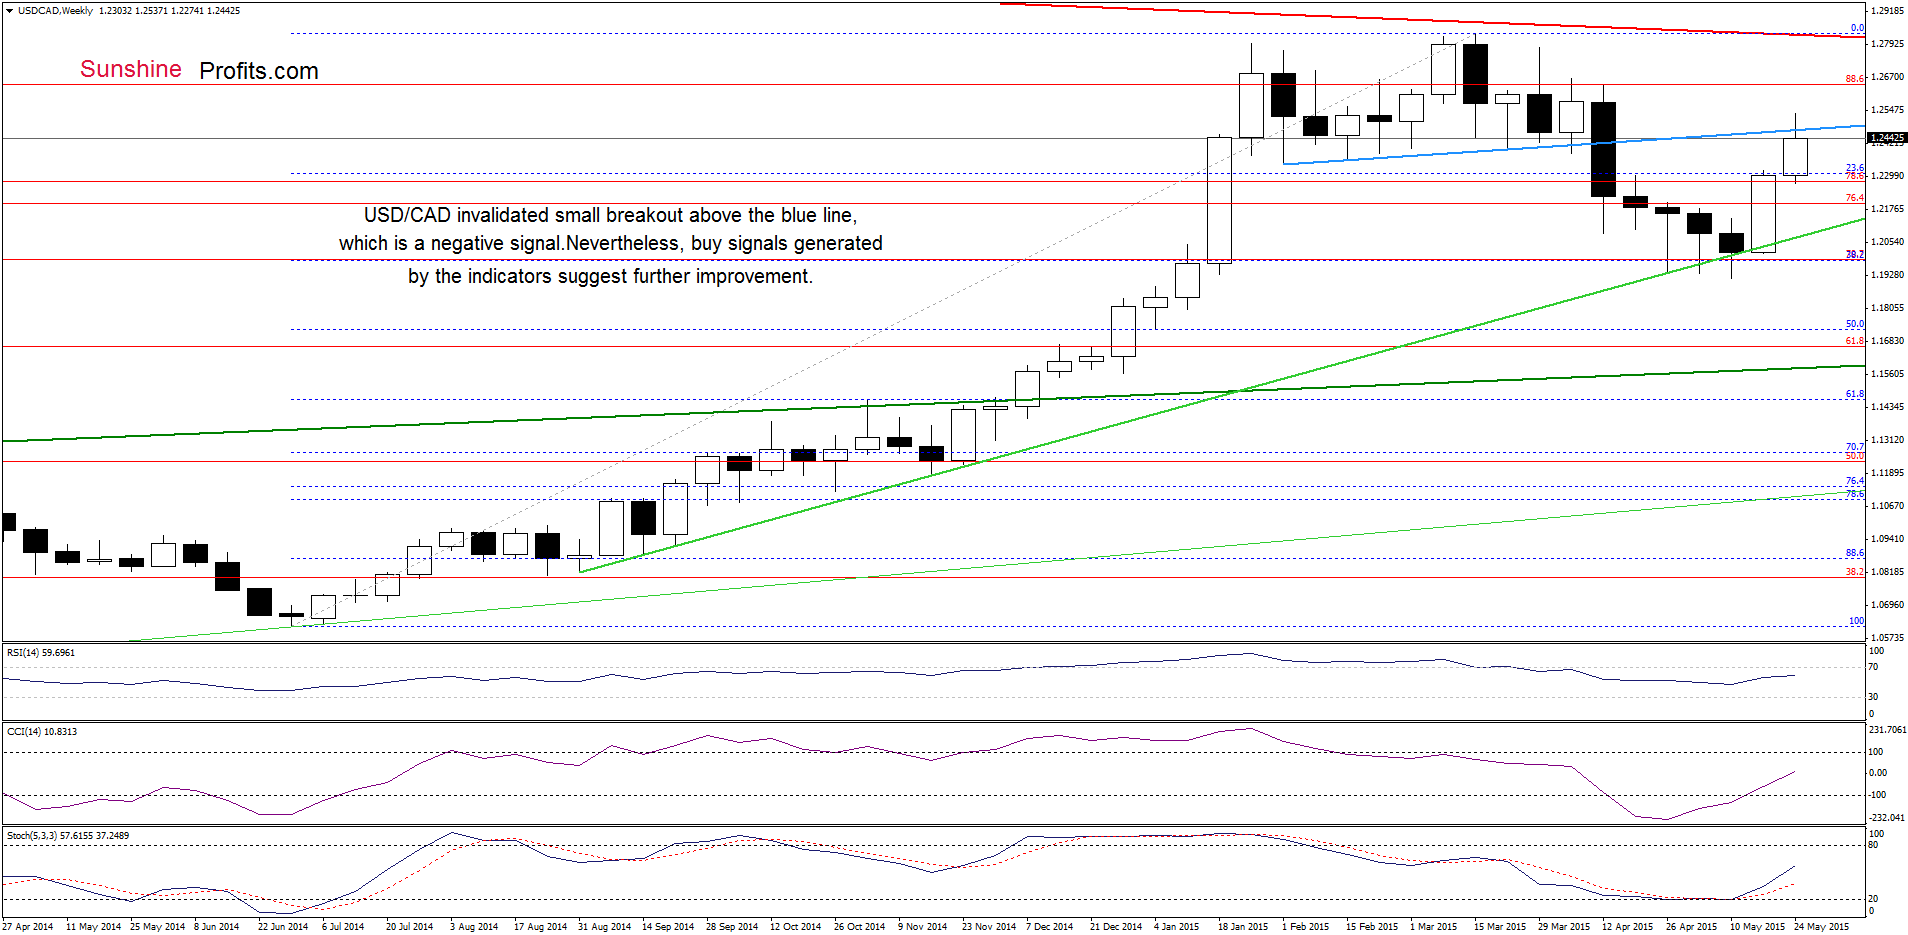
Looking at the weekly chart, we see that USD/CAD pulled back slightly and invalidted earlier breakout above the blue resistance line, which is a negative signal. Despite this move, buy signals generated by the indicators are still in play, supporting the bullish case.
Where will the exchange rate hit in the comng week? Let’s take a closer look at the daily chart and look for more clues about future moves.
Quoting our previous alert:
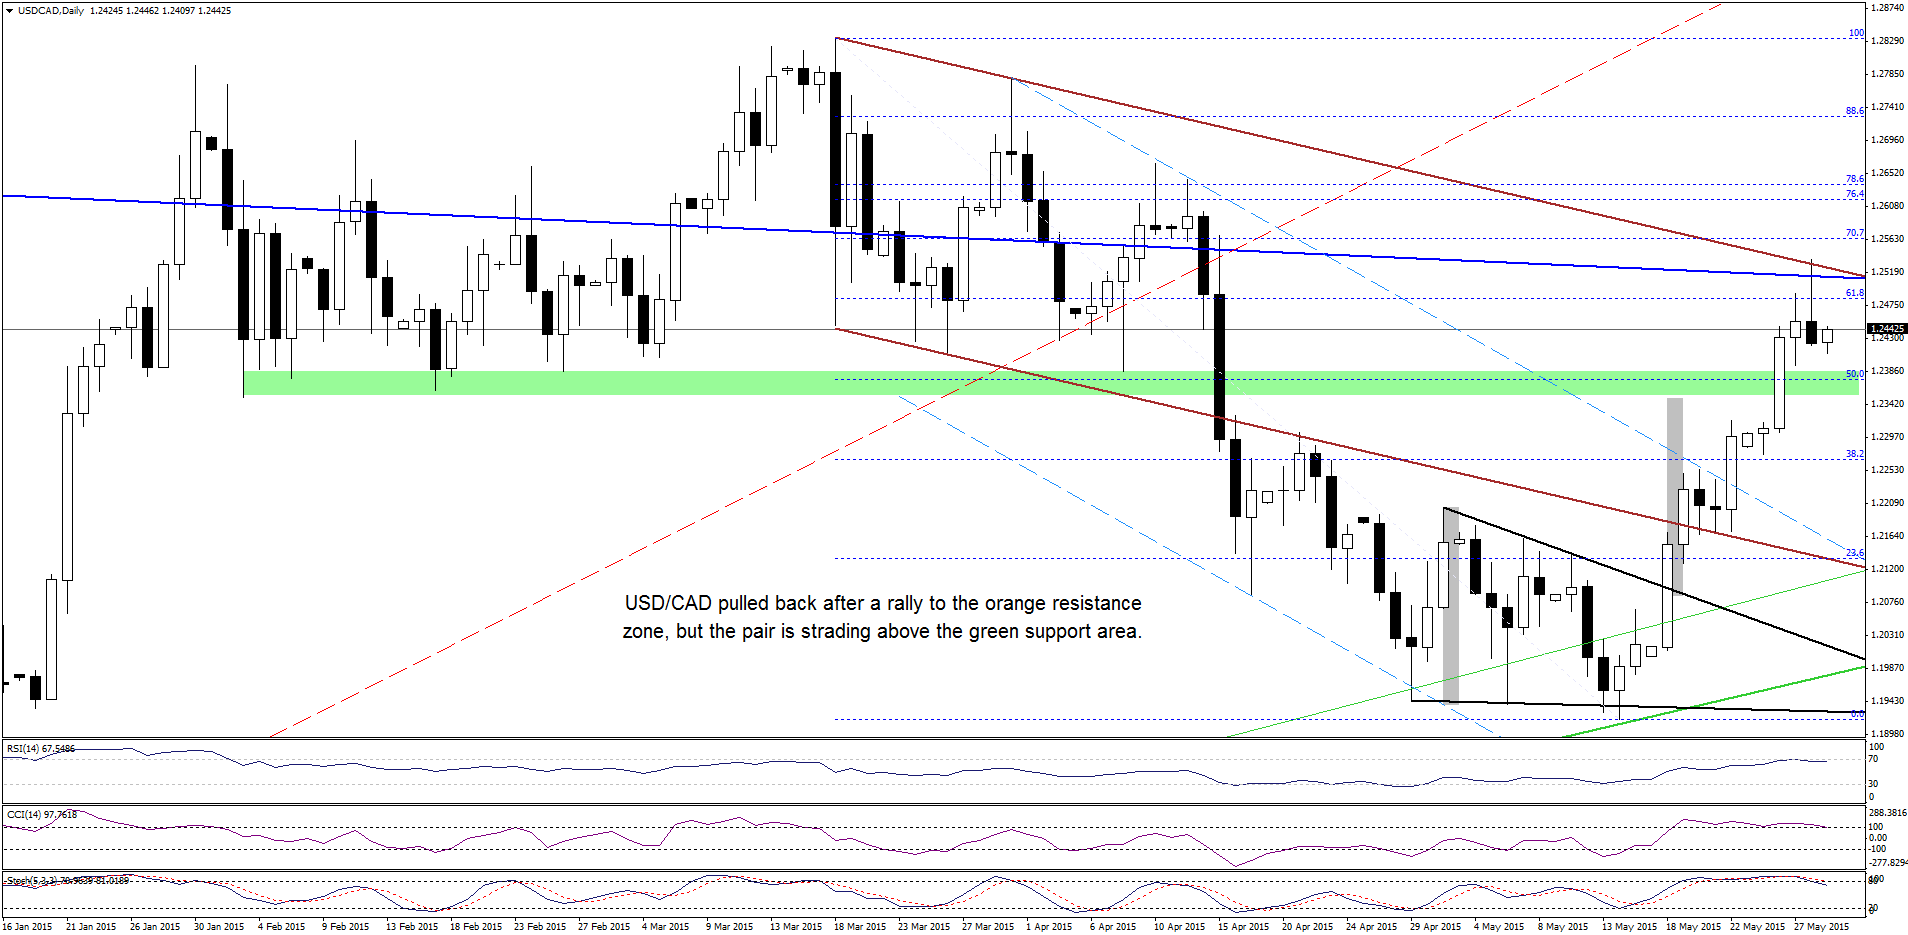
(…) Although the current position of the indicators suggests that a pullback is just around the corner, we think that the medium-term picture will encourage currency bulls to act and we’ll see a test the blue resistance line and the upper line of the brown declining trend channel in the coming day(s).
From today’s point of view we see that the situation developed in line with the above scenario and USD/CAD reached our upside target yesterday. The resistance zone created by the upper line of the brown declining trend channel encouraged currency bears to act and resulted in a pullback. Despite this move, the pair remains above the green support zone, which suggests that we might see another test of the above-mentioned resistance zone in the coming days.
Very short-term outlook: bullish
Short-term outlook: mixed with bullish bias
MT outlook: mixed
LT outlook: mixed
Trading position (short-term; our opinion): Long positions (which are profitable) with a stop-loss order at 1.1706 are justified from the risk/reward perspective at the moment. We will keep you informed should anything change, or should we see a confirmation/invalidation of the above.
USD/CHF
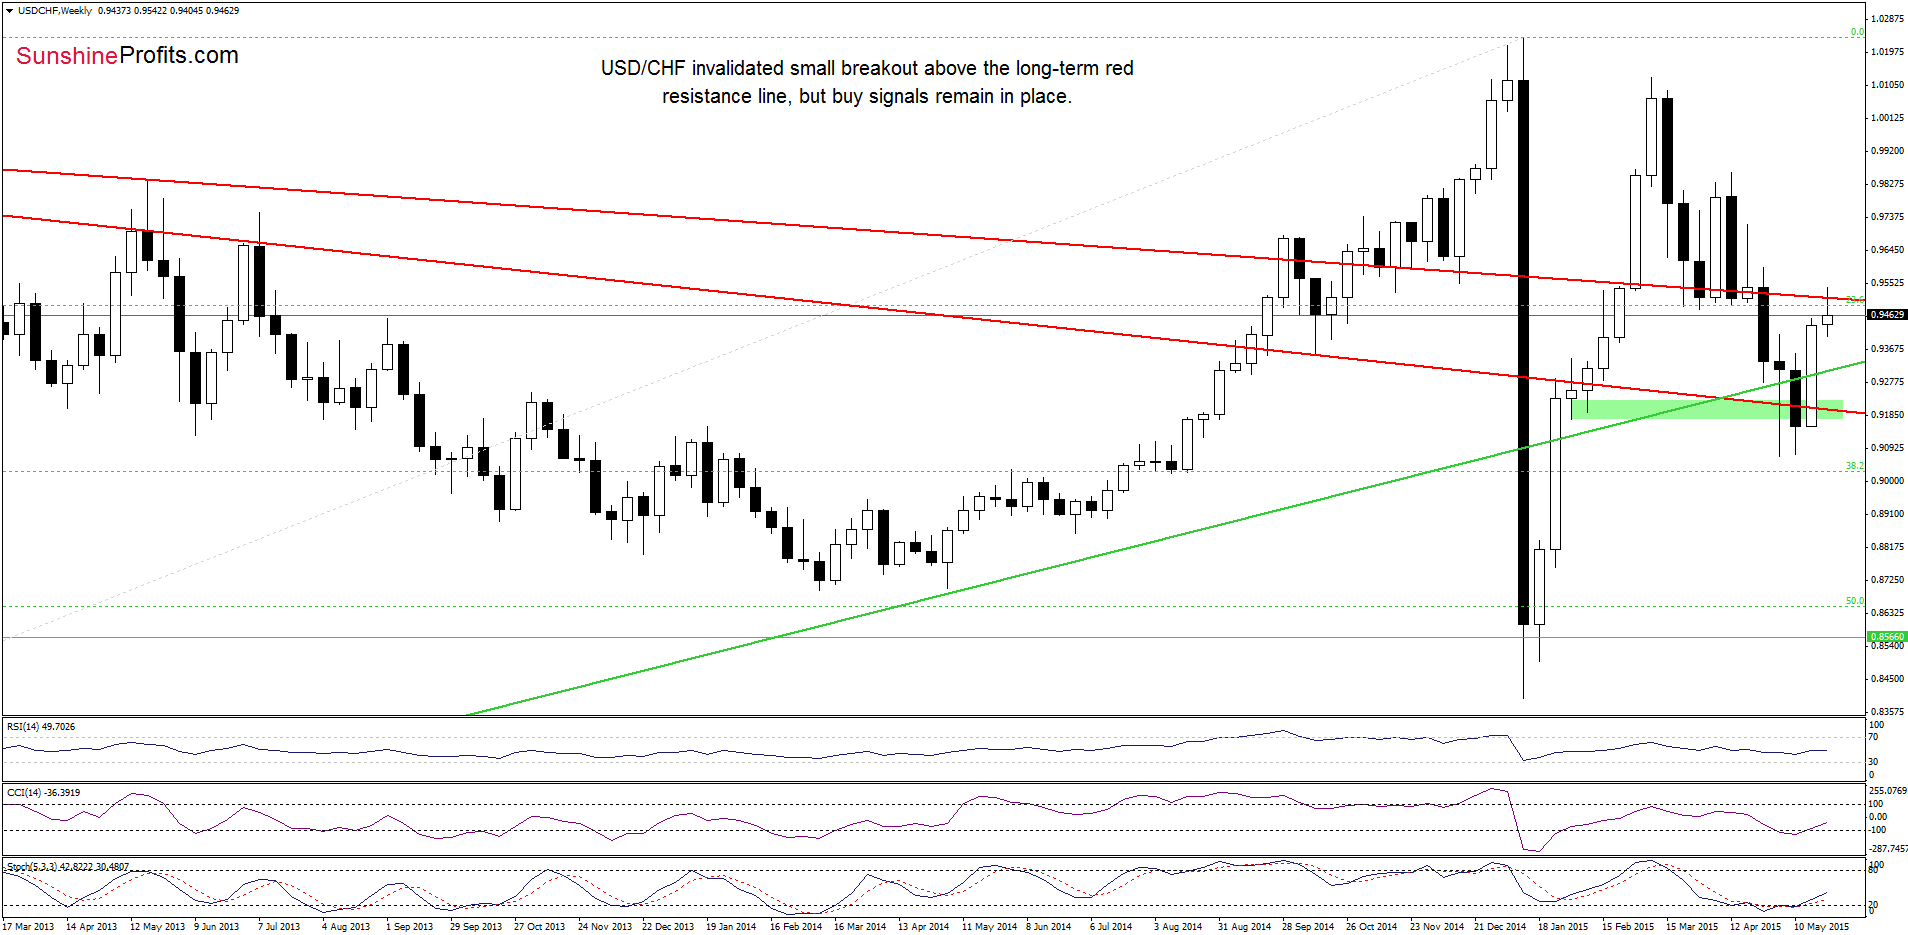
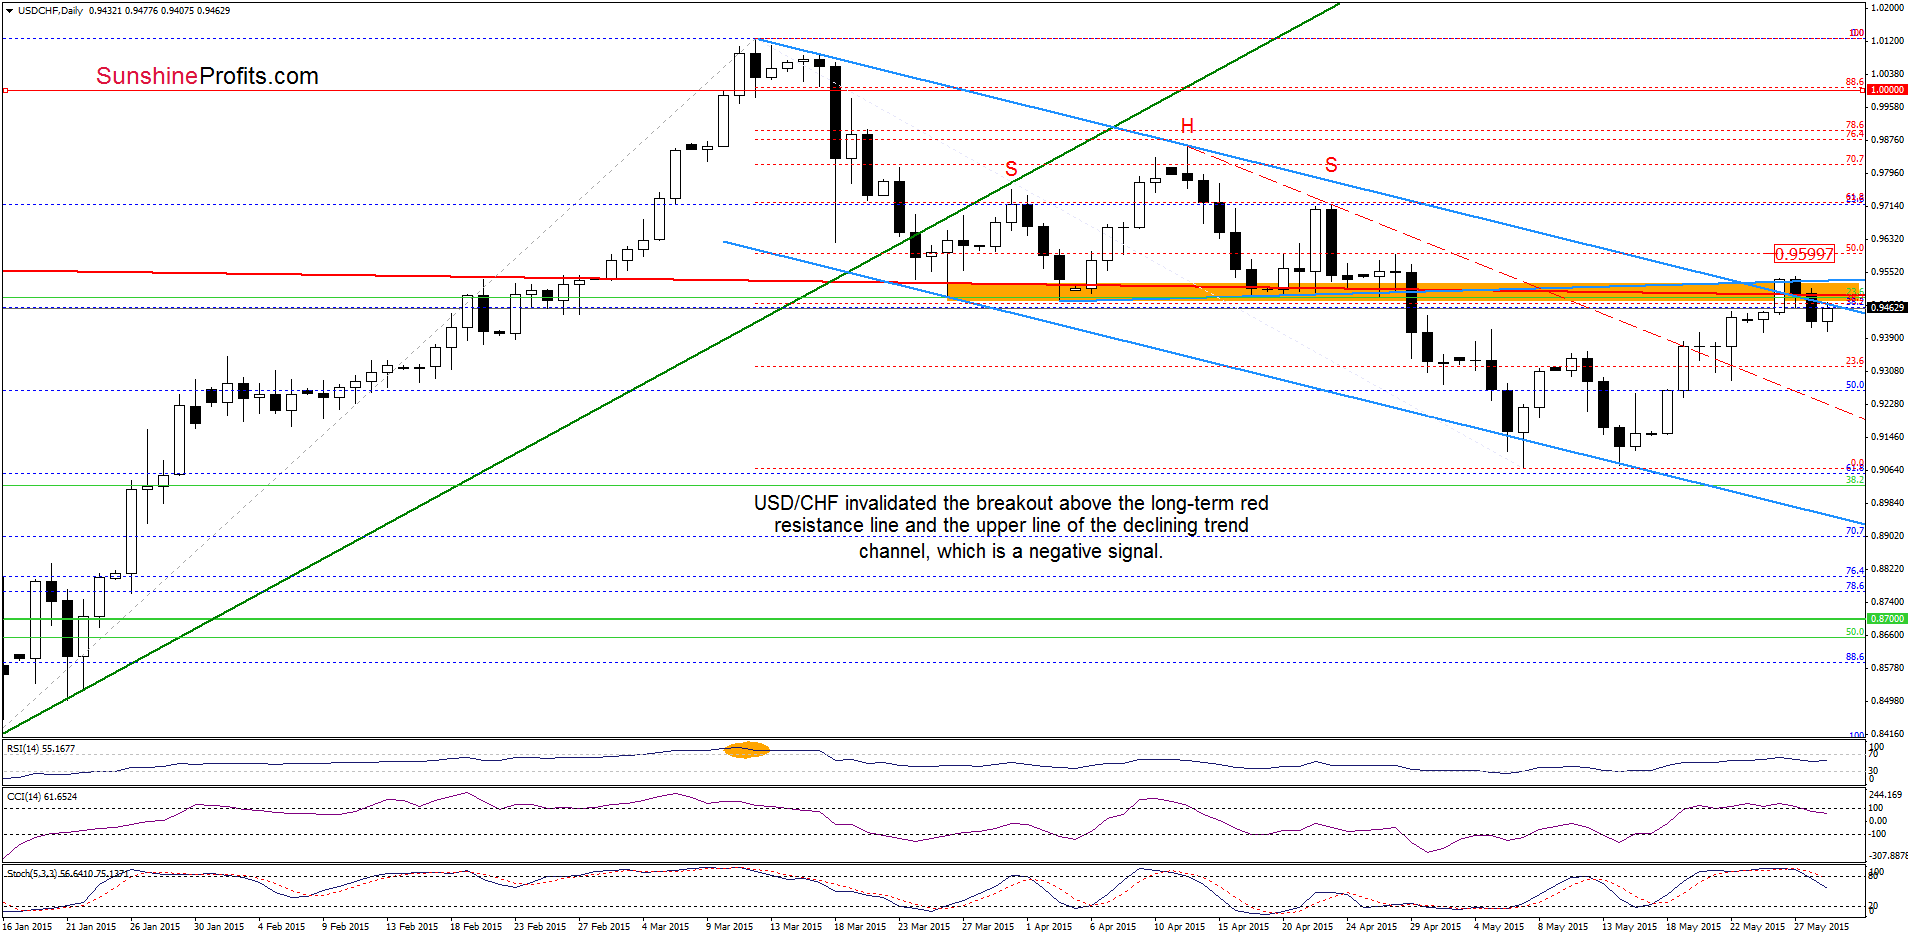
Looking at the above charts, we see that USD/CHF invalidated the breakout above the orange resistance zone (creted by the long-term red resistance line, the neck line of the head and shoulders formation and the upper border of the declining trend channel), which is a bearish signal signal that suggests move to the downside from here in the coming days. If this is the case, the initial downside target would be around 0.9290, where the May 22 low is.
Very short-term outlook: mixed with bearish bias
Short-term outlook: mixed
MT outlook: mixed
LT outlook: bearish
Trading position (short-term; our opinion): No positions are justified from the risk/reward perspective at the moment. We will keep you informed should anything change, or should we see a confirmation/invalidation of the above.
AUD/USD
In our Forex Trading Alert posted on May 27, we wrote the following:
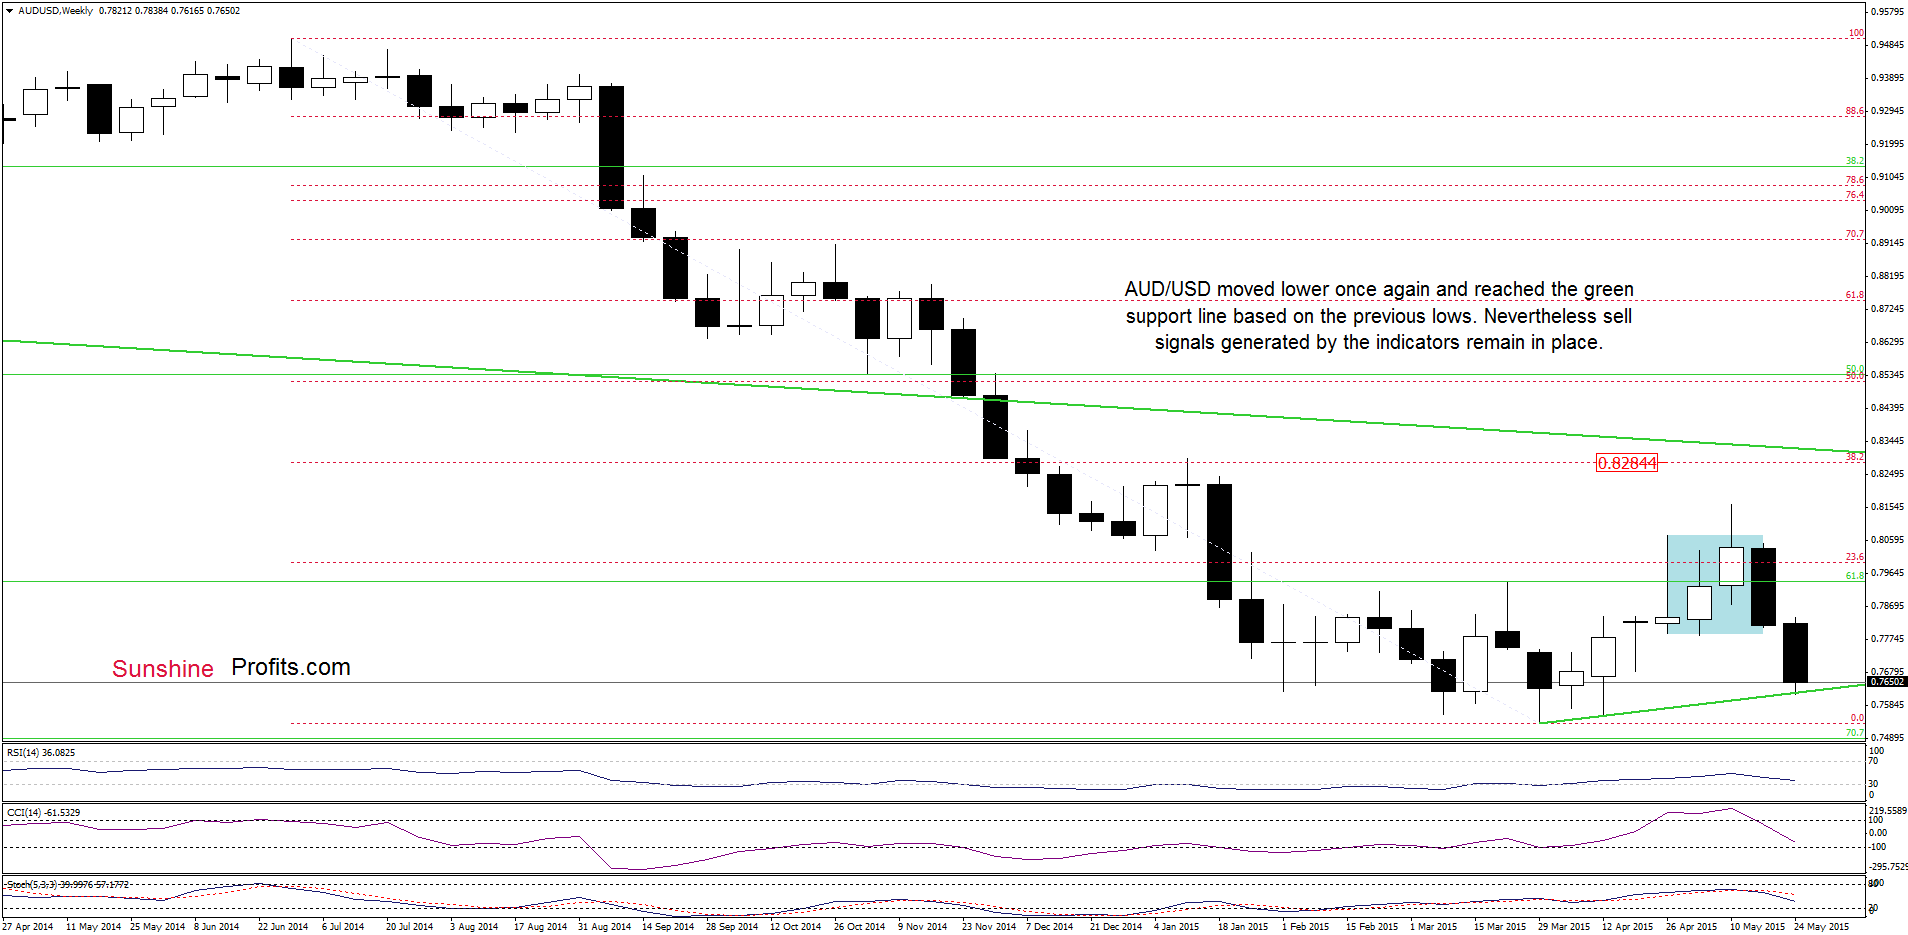
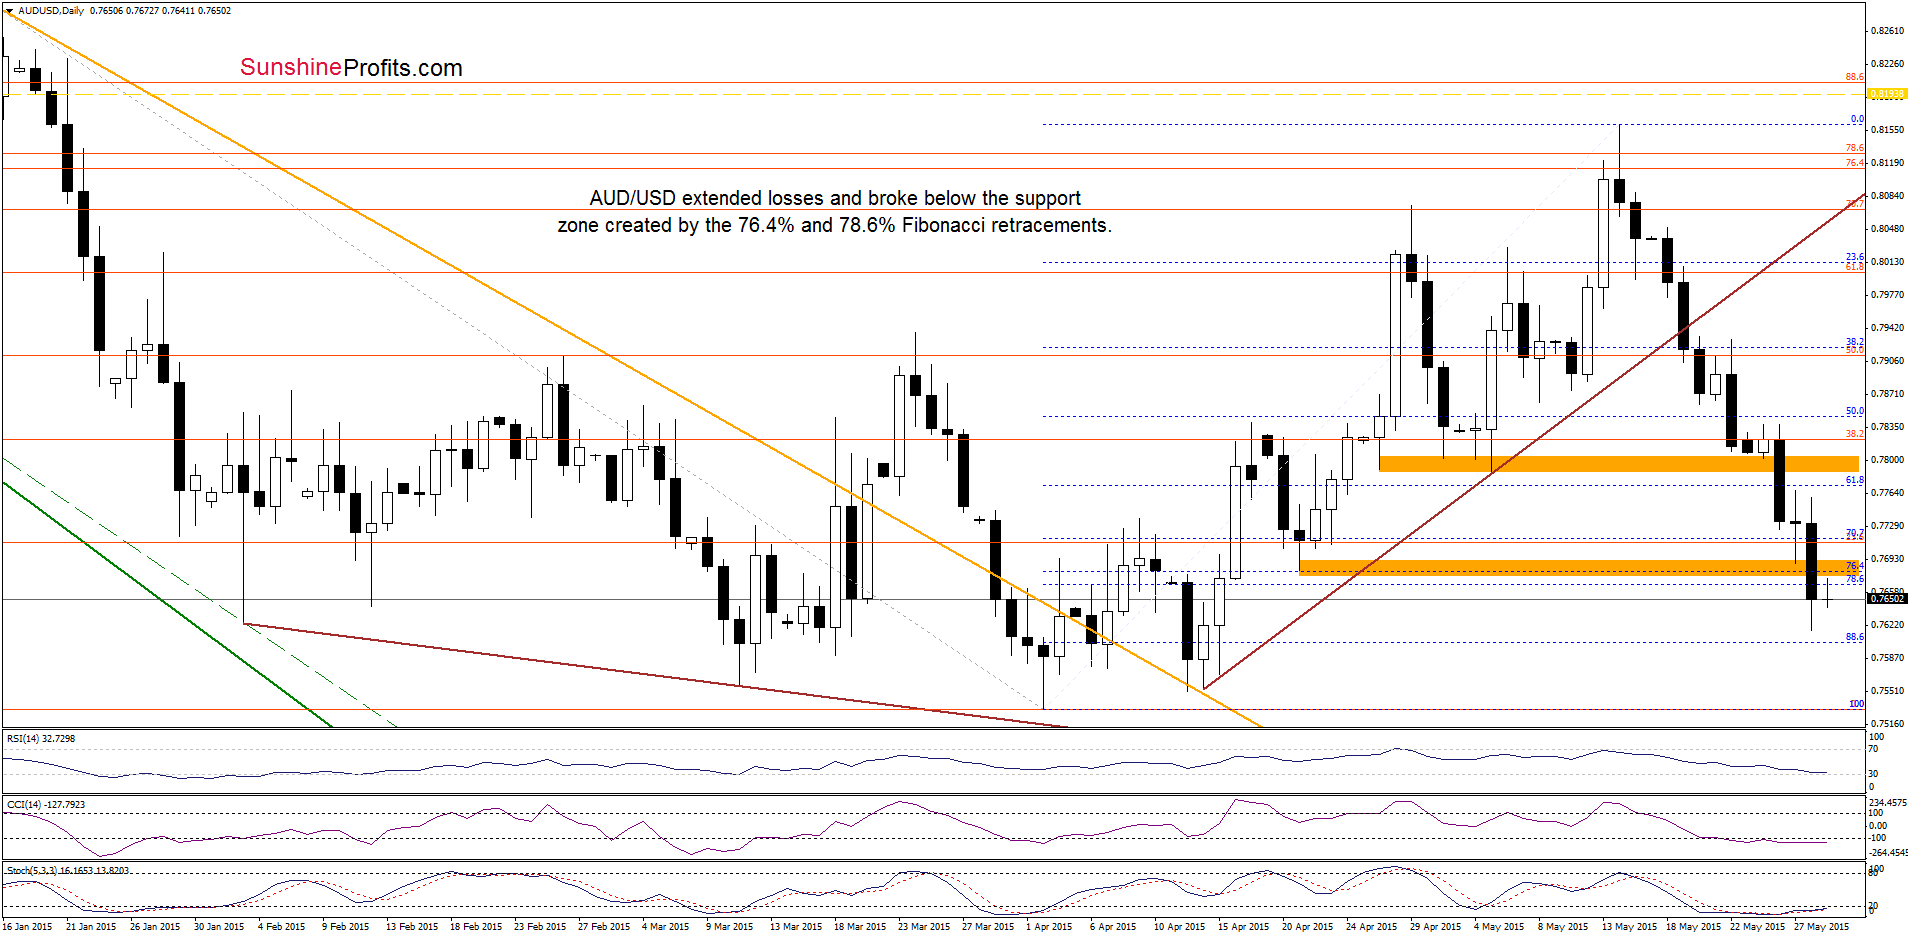
(…) Earlier this week, the exchange rate extended losses, which in combination with sell signals generated by the indicators suggest further declines. How low could the pair go in the coming days? (…) If (….) the pair moves lower from here, the downside target would be around 0.7682, where the lower green support zone (created by the Apr 24 low and the 76.4% and 78.6% Fibonacci retracements) is.
As you see on the charts AUD/USD extended losses and declined below our downside target yesterday. With this downward move, the exchange rate slipped to the green support line (based on the previous lows and marked on the weekly chart), which suggests that we could see a rebound from here. Nevertheless, we think that as long as the pair remains below the Apr 24 low and the 76.4% and 78.6% Fibonacci retracements, another attempt to move lower is likely.
Very short-term outlook: bearish
Short-term outlook: mixed with bearish bias
MT outlook: mixed
LT outlook: mixed
Trading position (short-term; our opinion): Short positions (which are profitable) with a stop-loss order at 0.8194 are justified from the risk/reward perspective at the moment. We will keep you informed should anything change, or should we see a confirmation/invalidation of the above.
Thank you.
Nadia Simmons
Forex & Oil Trading Strategist
Przemyslaw Radomski, CFA
Founder, Editor-in-chief
Gold & Silver Trading Alerts
Forex Trading Alerts
Oil Investment Updates
Oil Trading Alerts

