

Earlier today, USD/CAD extended gains as Friday’s Janet Yellen commentary (that the bank still expects to start raising interest rates later this year) continued to support the greenback. With this upward move, the exchange rate reached important resistance zone. Will it manage to stop currency bulls’ rally?
In our opinion the following forex trading positions are justified - summary:
- EUR/USD: Short positions (stop-loss order at 1.1667)
- GBP/USD: Short positions (stop-loss order at 1.5913)
- USD/JPY: none
- USD/CAD: Long positions (stop-loss order at 1.1706)
- USD/CHF: none
- AUD/USD: Short positions (stop-loss order at 0.8194)
EUR/USD
A week ago, we wrote the following:
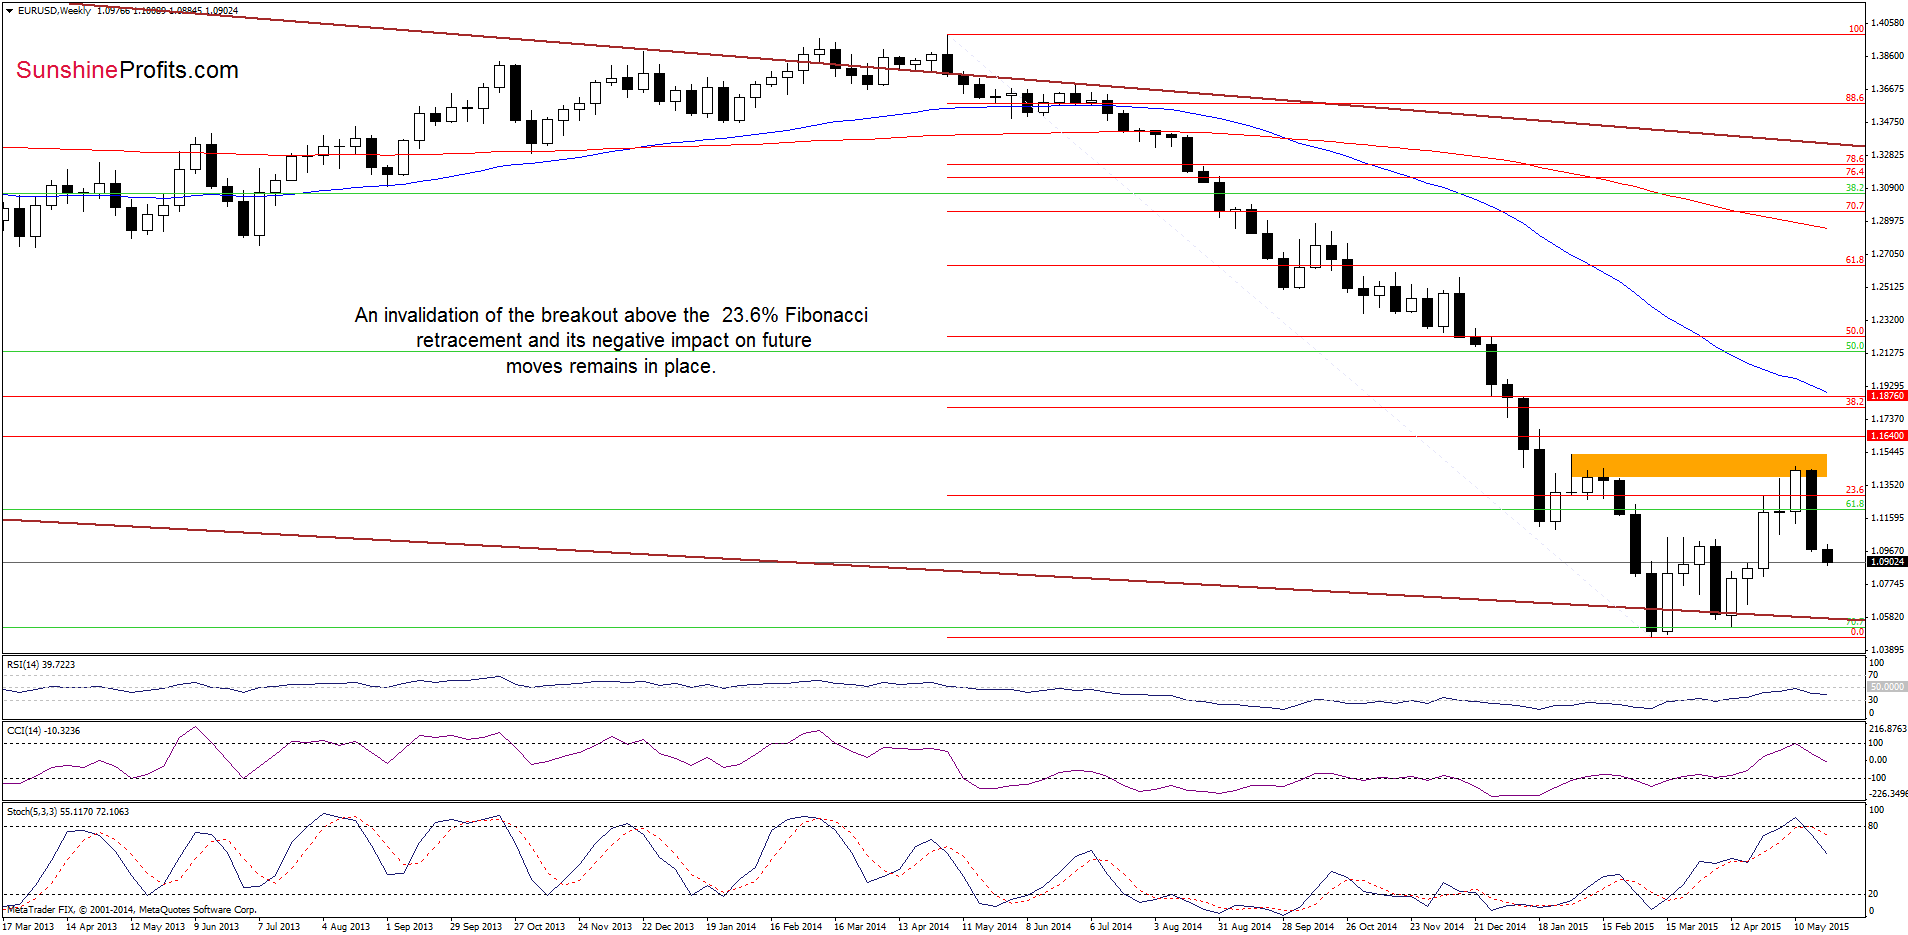
(…) the orange resistance zone (…) encouraged currency bears to act, which resulted in an invalidation of the breakout above the previously-broken 23.6% Fibonacci retracement. This is a negative signal, which suggests further deterioration in the coming days.
As you see on the weekly chart, the situation developed in tune with the above scenario and EUR/USD extended losses. Additionally, the CCI and Stochastic Oscillator generated sell signals, supporting the bearish case.
How low could the exchange rate go? Let’s take a closer look at the daily chart and find out.
Quoting our last commentary on this currency pair:
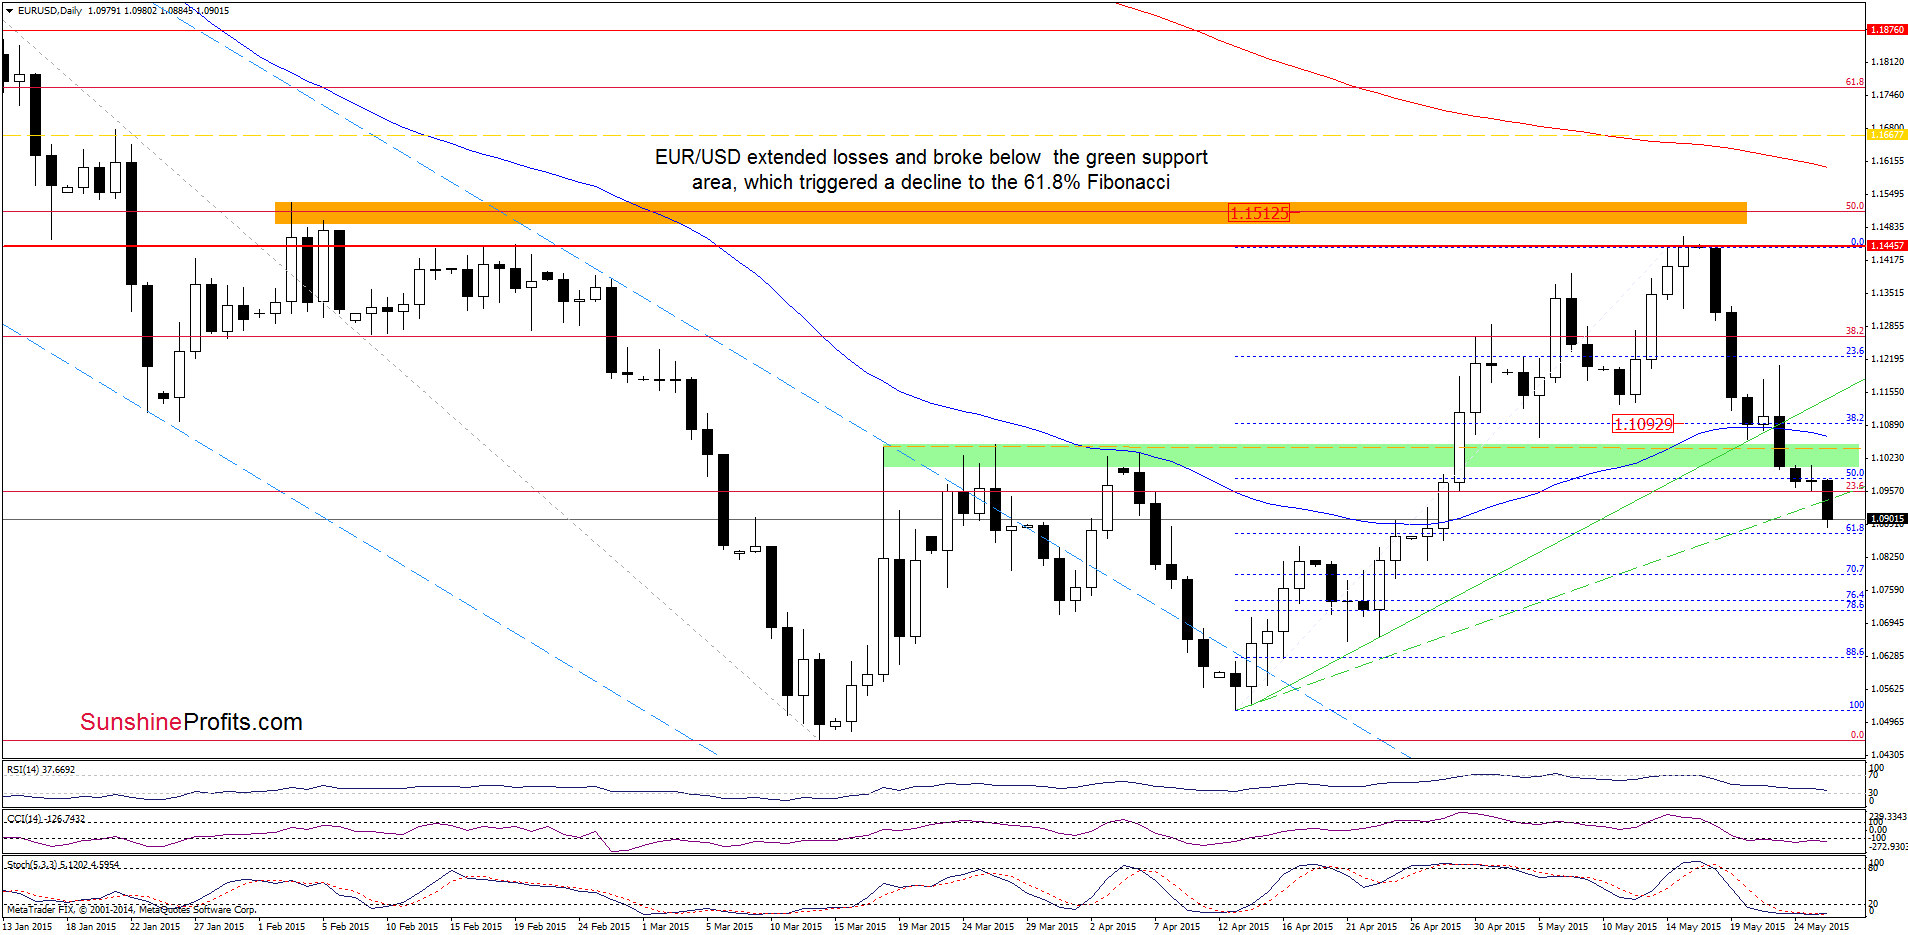
(…) the dashed orange support line (…) was strong enough to stop further deterioration and trigger upswings. Nevertheless, when we take a closer look at the daily chart we notice that currency bears managed to push the pair lower earlier today. In our opinion, if the exchange rate closes the day under this support line, it would be a negative signal, which will likely trigger further deterioration and (…) the next target would be the green support zone (around 1.1014-1.1047).
In the previous week, currency bears not only took EUR/USD to the above-mentioned downside target, but also managed to push the exchange rate below it. This bearish event triggered further deterioration and resulted in a drop to the green support dashed line. Earlier today, the pair extended losses and declined below it, reaching the 61.8% Fibonacci retracement level (based on the Apr-May rally). Although the exchange rate could rebound from here, we think that as long as there are no buy signals generated by the indicators (and an invalidation of the breakdown under the green dashed line) another downswing is likely. If this is the case, the next target would be around 1.0793, where the 70.7% Fibonacci retracement is.
Very short-term outlook: bearish
Short-term outlook: mixed with bearish bias
MT outlook: mixed
LT outlook: mixed
Trading position (short-term; our opinion): Short positions (which are already profitable) with a stop-loss order at 1.1667 are justified from the risk/reward perspective at the moment. We will keep you informed should anything change, or should we see a confirmation/invalidation of the above.
GBP/USD
In our Forex Trading Alert posted on May 18, we wrote:
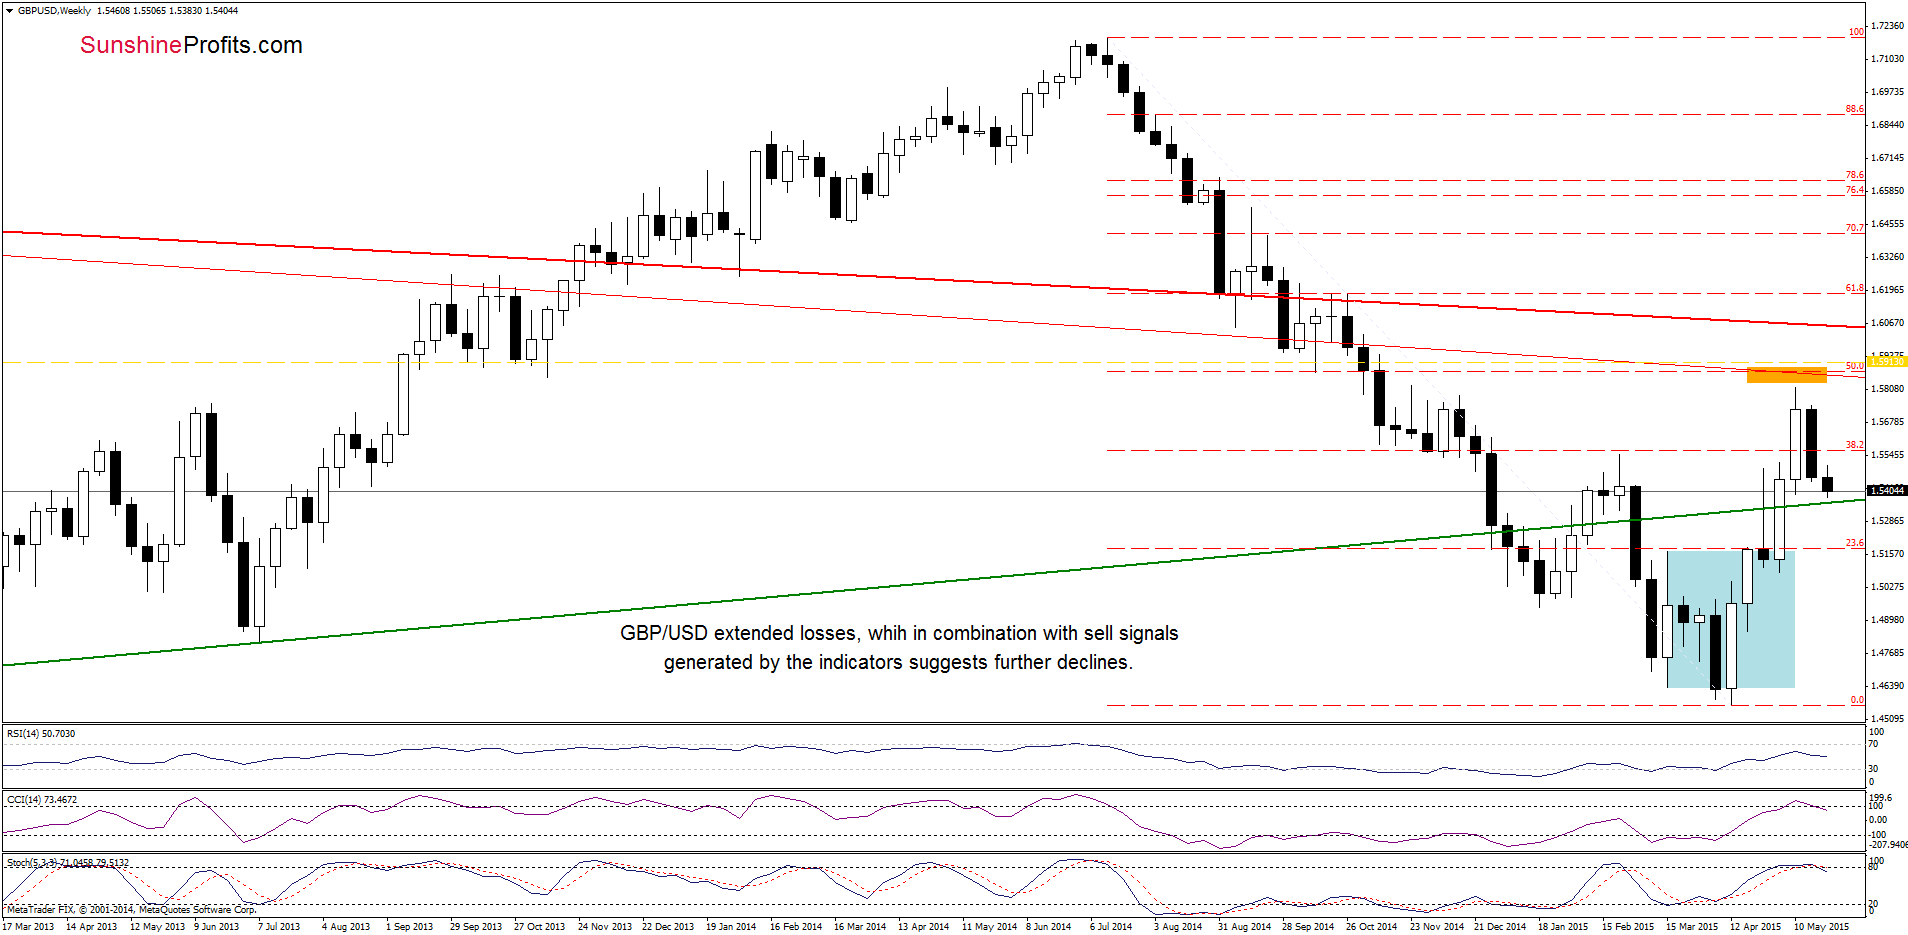
(…) GBP/USD extended losses, which in combination with the current position of the indicators (they all generated sell signals) suggests that further correction of the recent rally more likely than not. If the pair moves lower from here, the initial downside target would be around 1.5518, where the 23.6% Fibonacci retracement (based on the entire Apr-May rally) is.
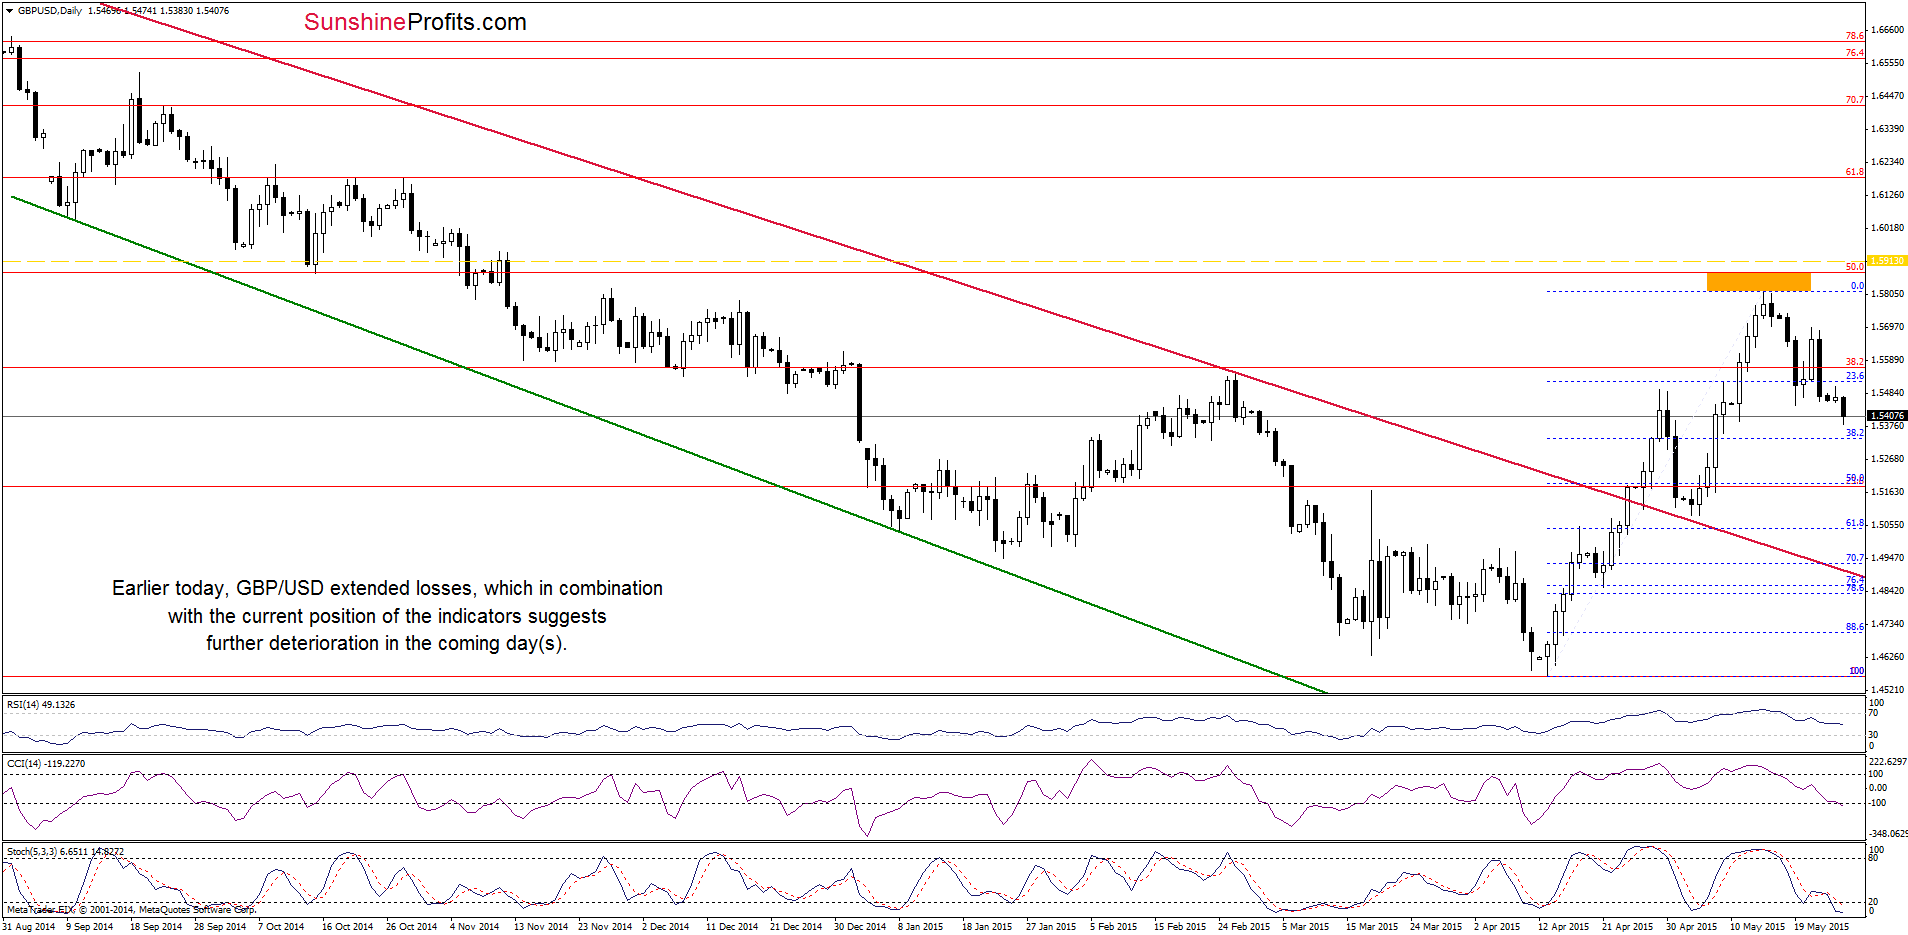
Looking at the charts we see that GBP/USD extended losses (as we expected) and declined below our initial downside target. This is a negative signal, which suggests that currency bears will try to push the pair to the next target - the 38.2% Fibonacci retracement (around 1.5337) or even the 50% retracement (around 1.5190) in the coming days (please note that although the CCI and Stochastic Oscillator are oversold, sell signals remain in place, supporting the bearish case).
Very short-term outlook: bearish
Short-term outlook: mixed with bearish bias
MT outlook: mixed
LT outlook: mixed
Trading position (short-term; our opinion): Short positions (which are already profitable) with a stop-loss order at 1.5913 are justified from the risk/reward perspective at the moment. We will keep you informed should anything change, or should we see a confirmation/invalidation of the above.
USD/CAD
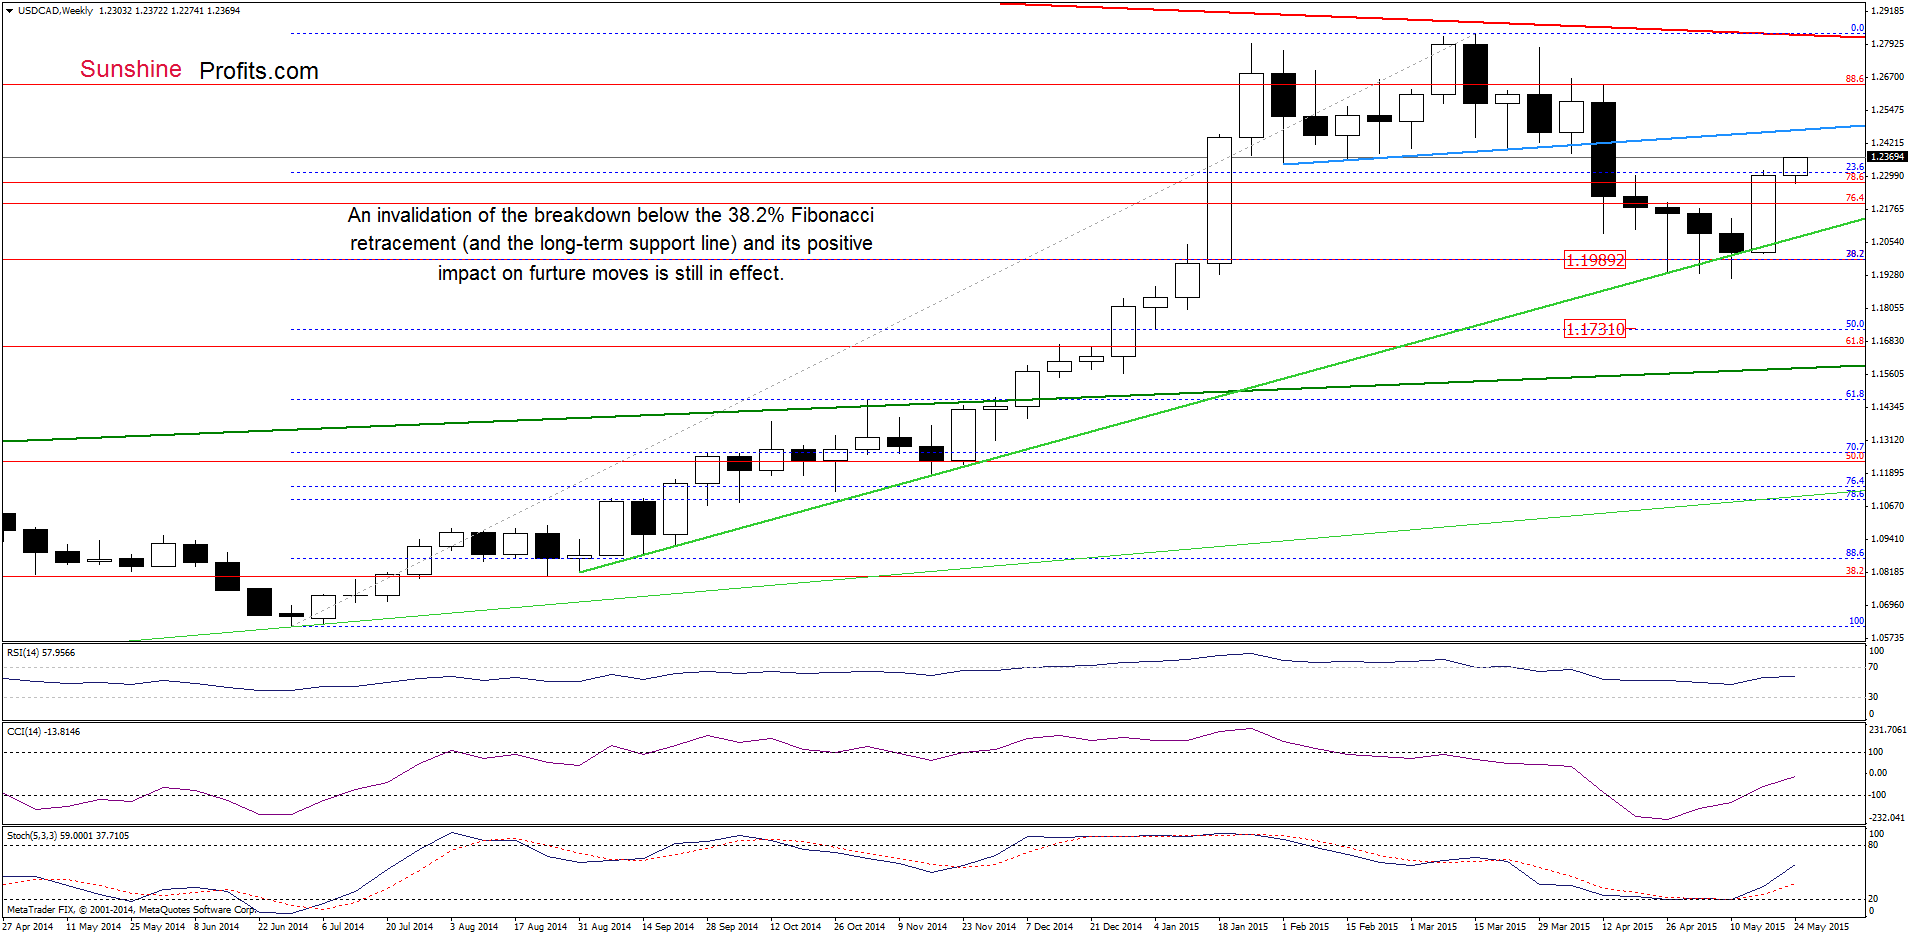
On the weekly chart, we see that USD/CAD moved higher, which means that an invalidation of the breakdown under the 38.2% Fibonacci retracement level (and the long-term green line) and its positive impact on price moves is still in effect. Additionally, buy signals reain in place, supporting further improvement. If this is the case, we might see an increase even to around 1.2464, where the previously-broken neck line (marked with blue) of the head and shoulders formation is.
Are there any short-term factors that could support currency bulls? Let’s examine the daily chart and find out.
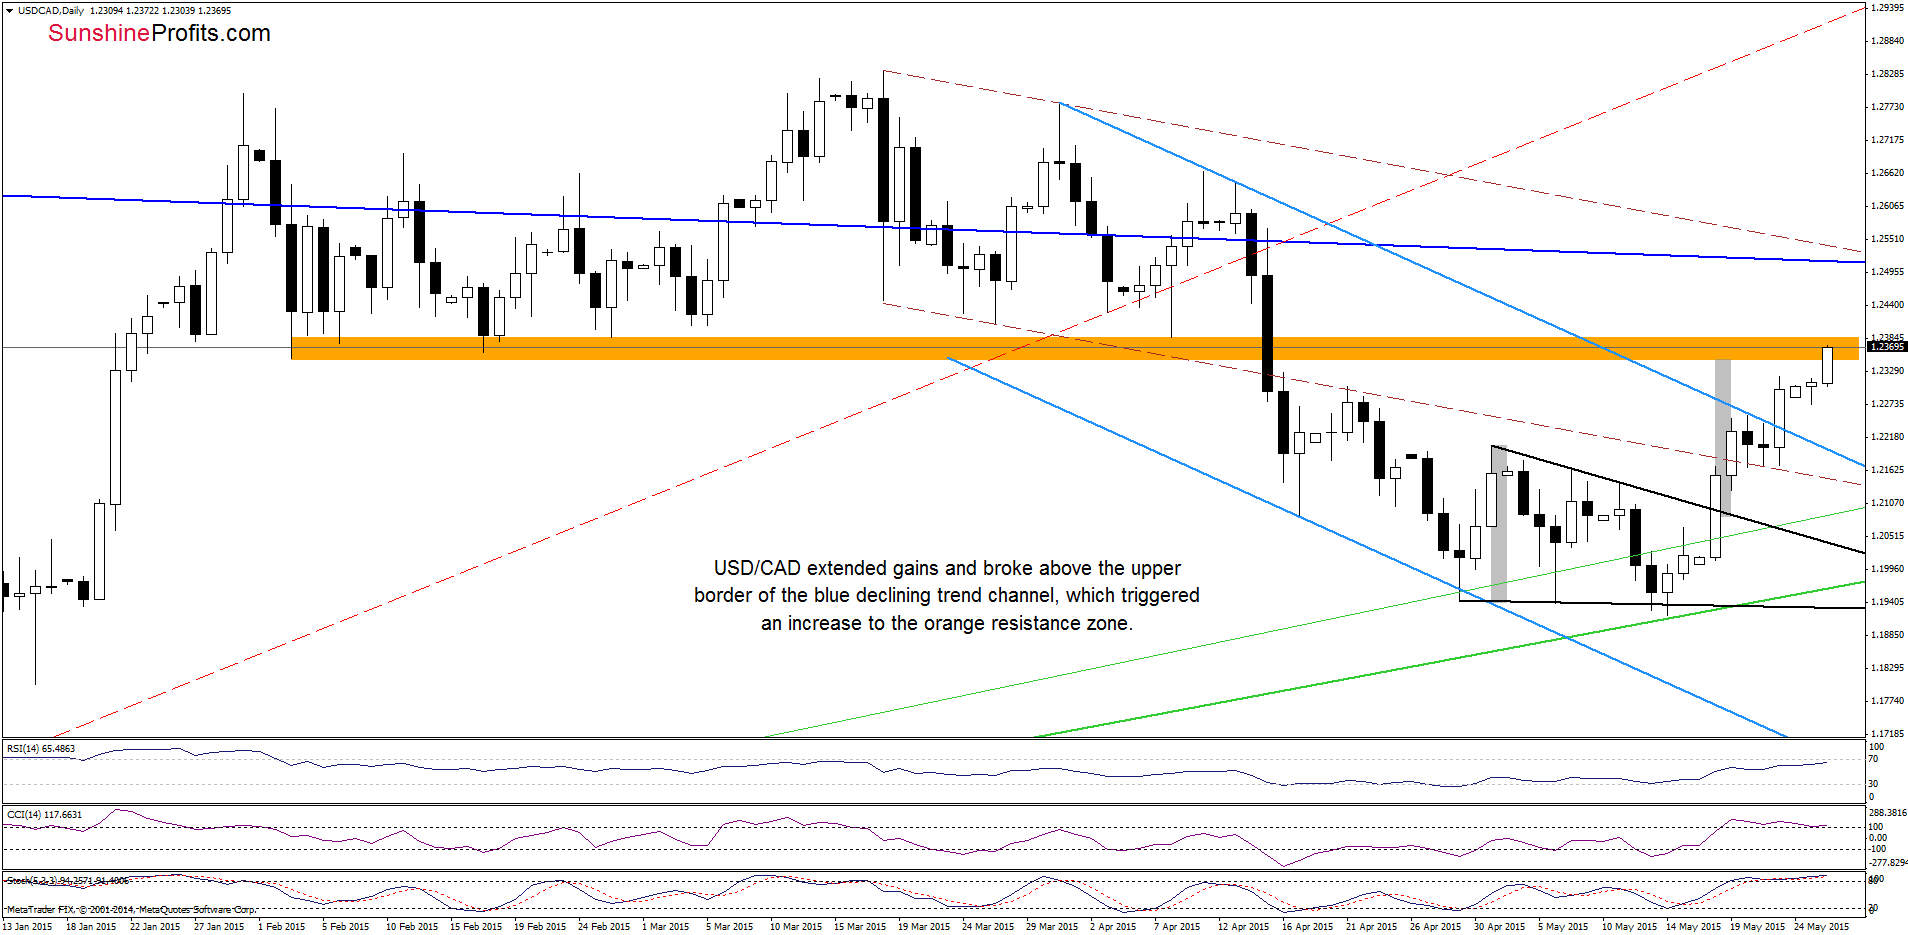
Last Tuesday, we wrote the following:
(…) we think that the current position of the indicators (buy signals remain in place) in combination with the medium-term picture will trigger further improvement. At this point, it is worth noting that the recent upward move took the exchange rate above the black resistance line (the upper line of the triangle), which suggests a rally to the orange resistance zone in the coming days.
From today’s point of view we see that the situation developed in line with the above scenario and USD/CAD reached our upside target earlier today. Although the current position of the indicators and the orange resistance zone suggest that we could see a pullback from here in the coming day(s), we think that as long as there are no sell signals another upswing is likely (especially when we factor in the medium-term picture). If this is the case, and USD/CAD breaks above the orange zone, we might see an increase to around 1.2482, where the 61.8% Fibonacci retracement (based on the entire March-May declines) is.
Very short-term outlook: bullish
Short-term outlook: mixed with bullish bias
MT outlook: mixed
LT outlook: mixed
Trading position (short-term; our opinion): Long positions (which are already profitable) with a stop-loss order at 1.1706 are justified from the risk/reward perspective at the moment. We will keep you informed should anything change, or should we see a confirmation/invalidation of the above.
Thank you.
Nadia Simmons
Forex & Oil Trading Strategist
Przemyslaw Radomski, CFA
Founder, Editor-in-chief
Gold & Silver Trading Alerts
Forex Trading Alerts
Oil Investment Updates
Oil Trading Alerts

