

Although the National Australia Bank said that its business confidence index remained unchanged, Friday's solid U.S. employment report still supports the greenback, making it more attractive for investors. In this environment, AUD/USD moved lower and slipped below 0.7900 earlier today. Will we see the exchange rate at 0.7800 in the coming week?
In our opinion the following forex trading positions are justified - summary:
EUR/USD
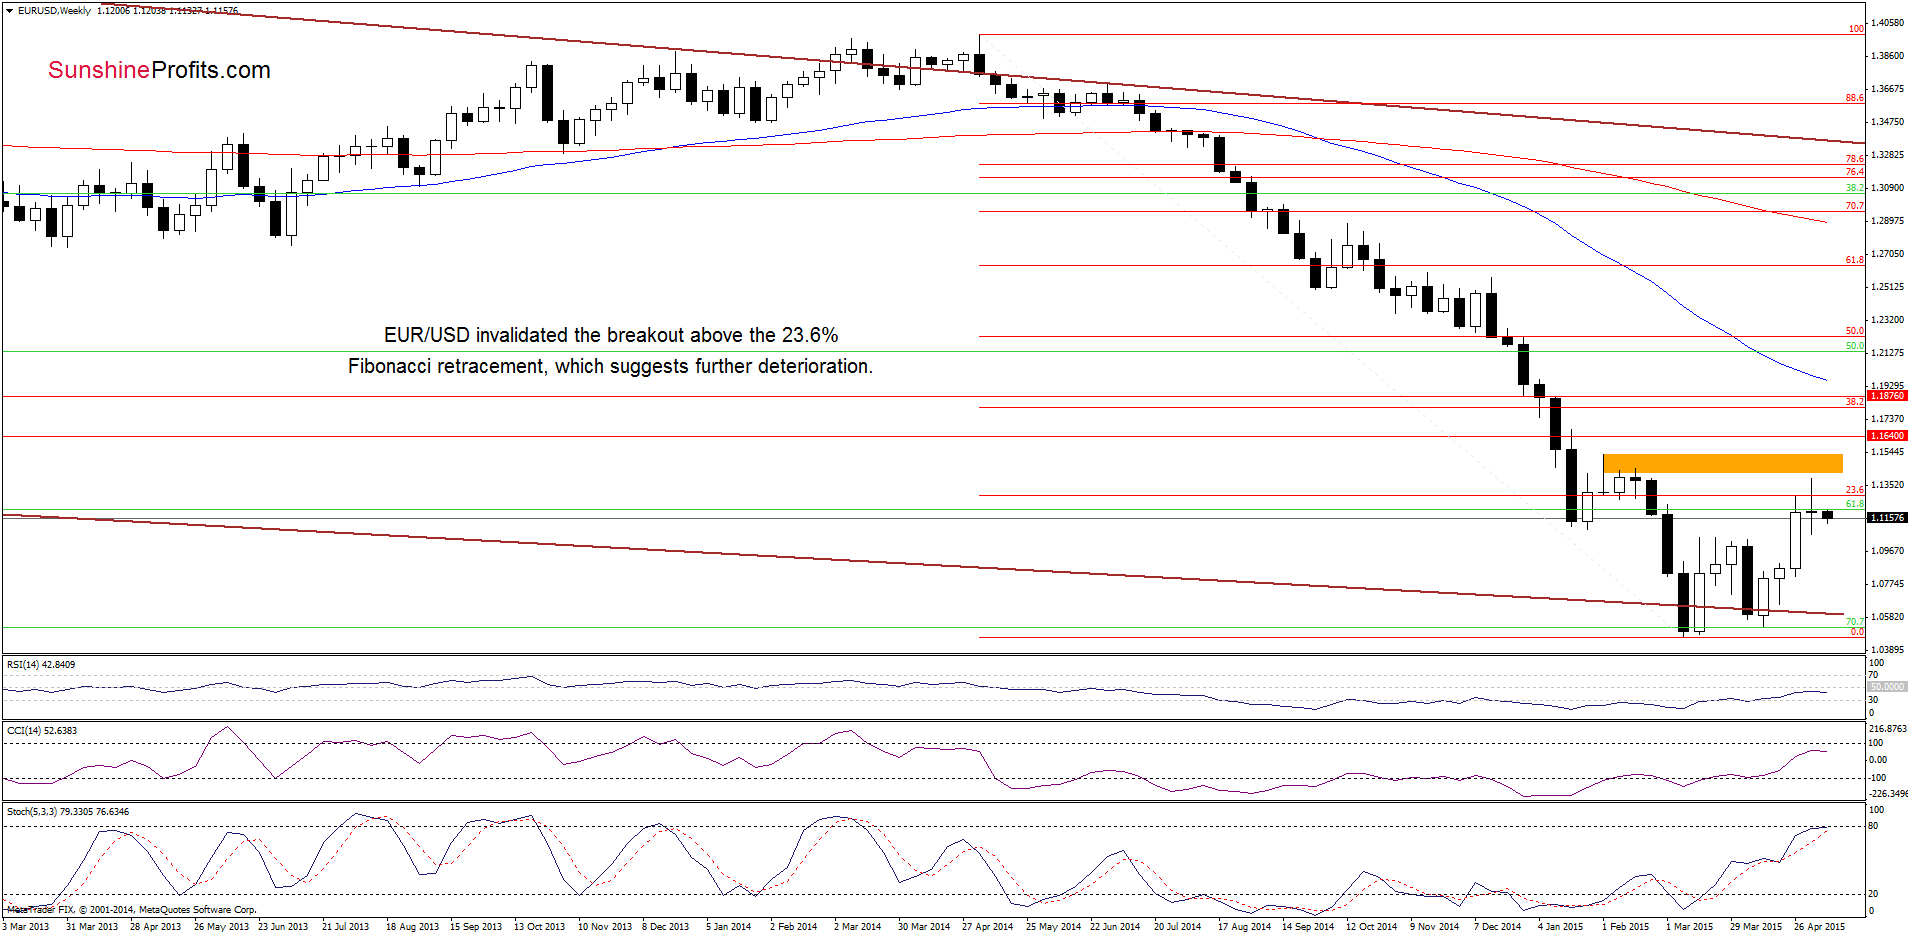
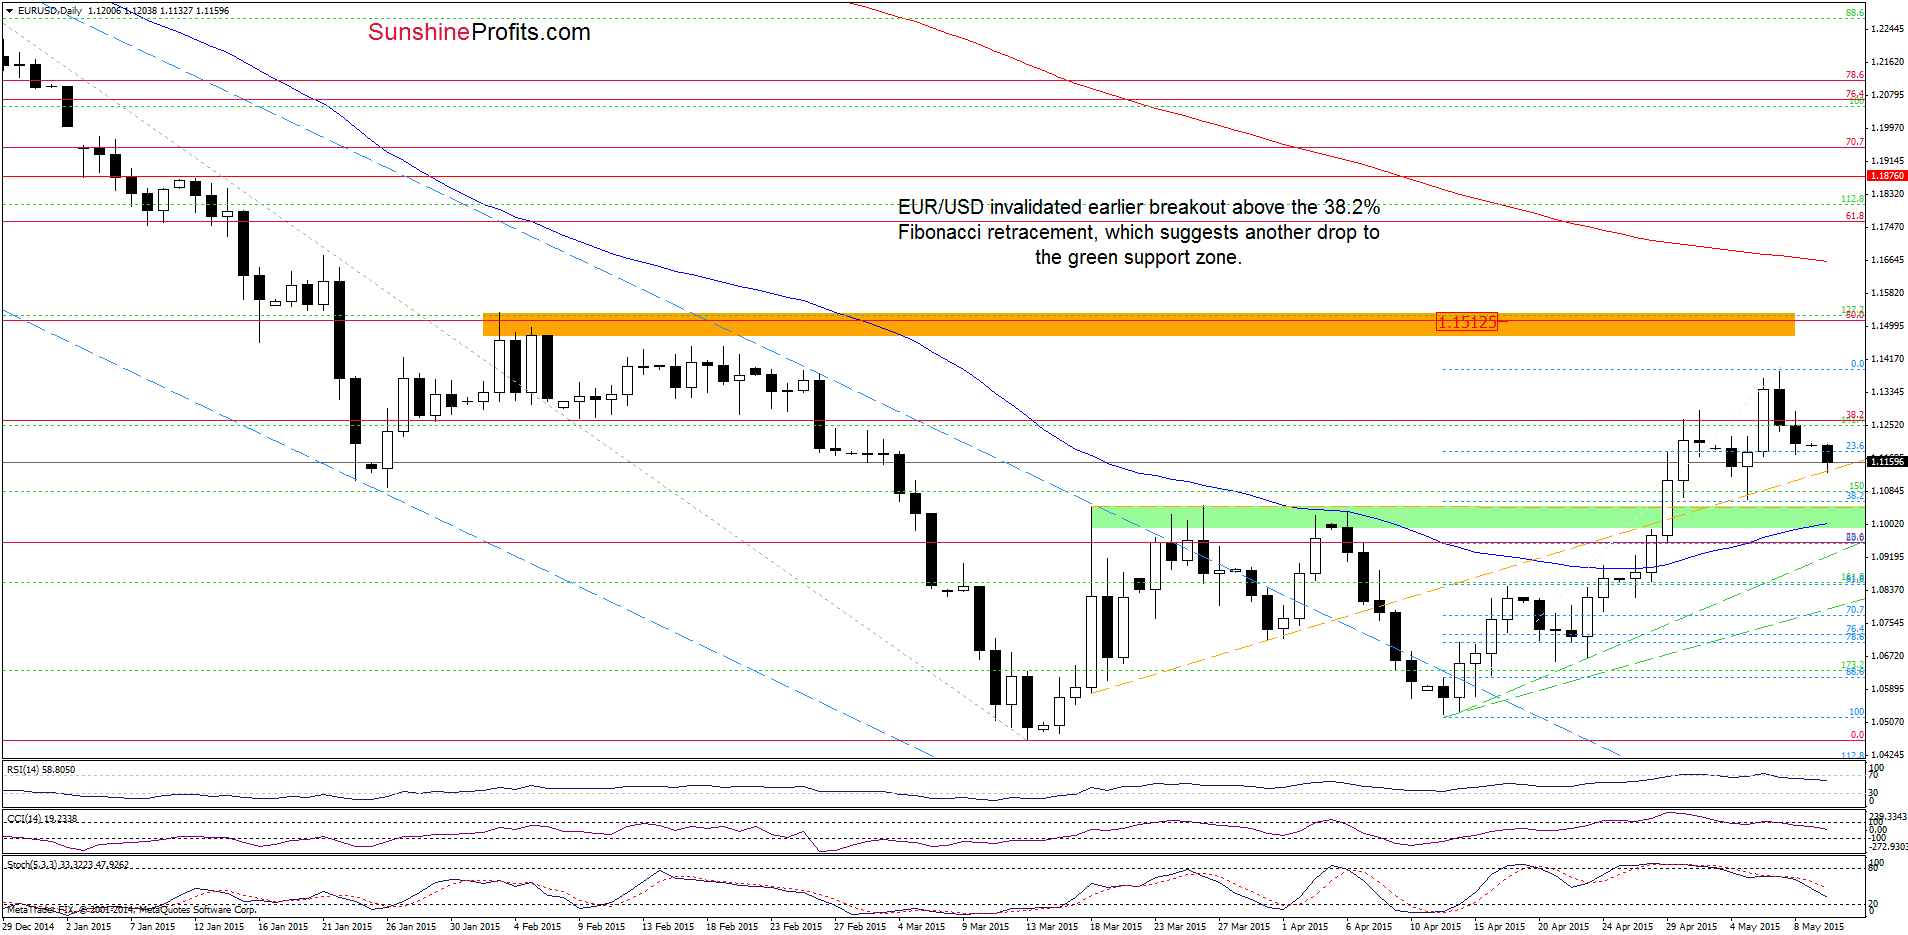
As you see on the above charts, EUR/USD extended losses and closed Friday’s session under the 23.6% and 38.2% Fibonacci retracements, invalidating earlier breakout above these levels. This is a bearish signal, which in combination with sell signals generated by all daily indicators, suggests further deterioration and another test of the green support zone (around 1.1000-1.1050) in the coming week. At this point, it is worth noting that slightly above this area is also 38.2% retracement (based on the recent rally), which reinforces this zone and could pause declines.
Very short-term outlook: mixed with bearish bias
Short-term outlook: mixed
MT outlook: mixed
LT outlook: mixed
Trading position (short-term; our opinion): No positions are justified from the risk/reward perspective at the moment. We will keep you informed should anything change, or should we see a confirmation/invalidation of the above.
GBP/USD
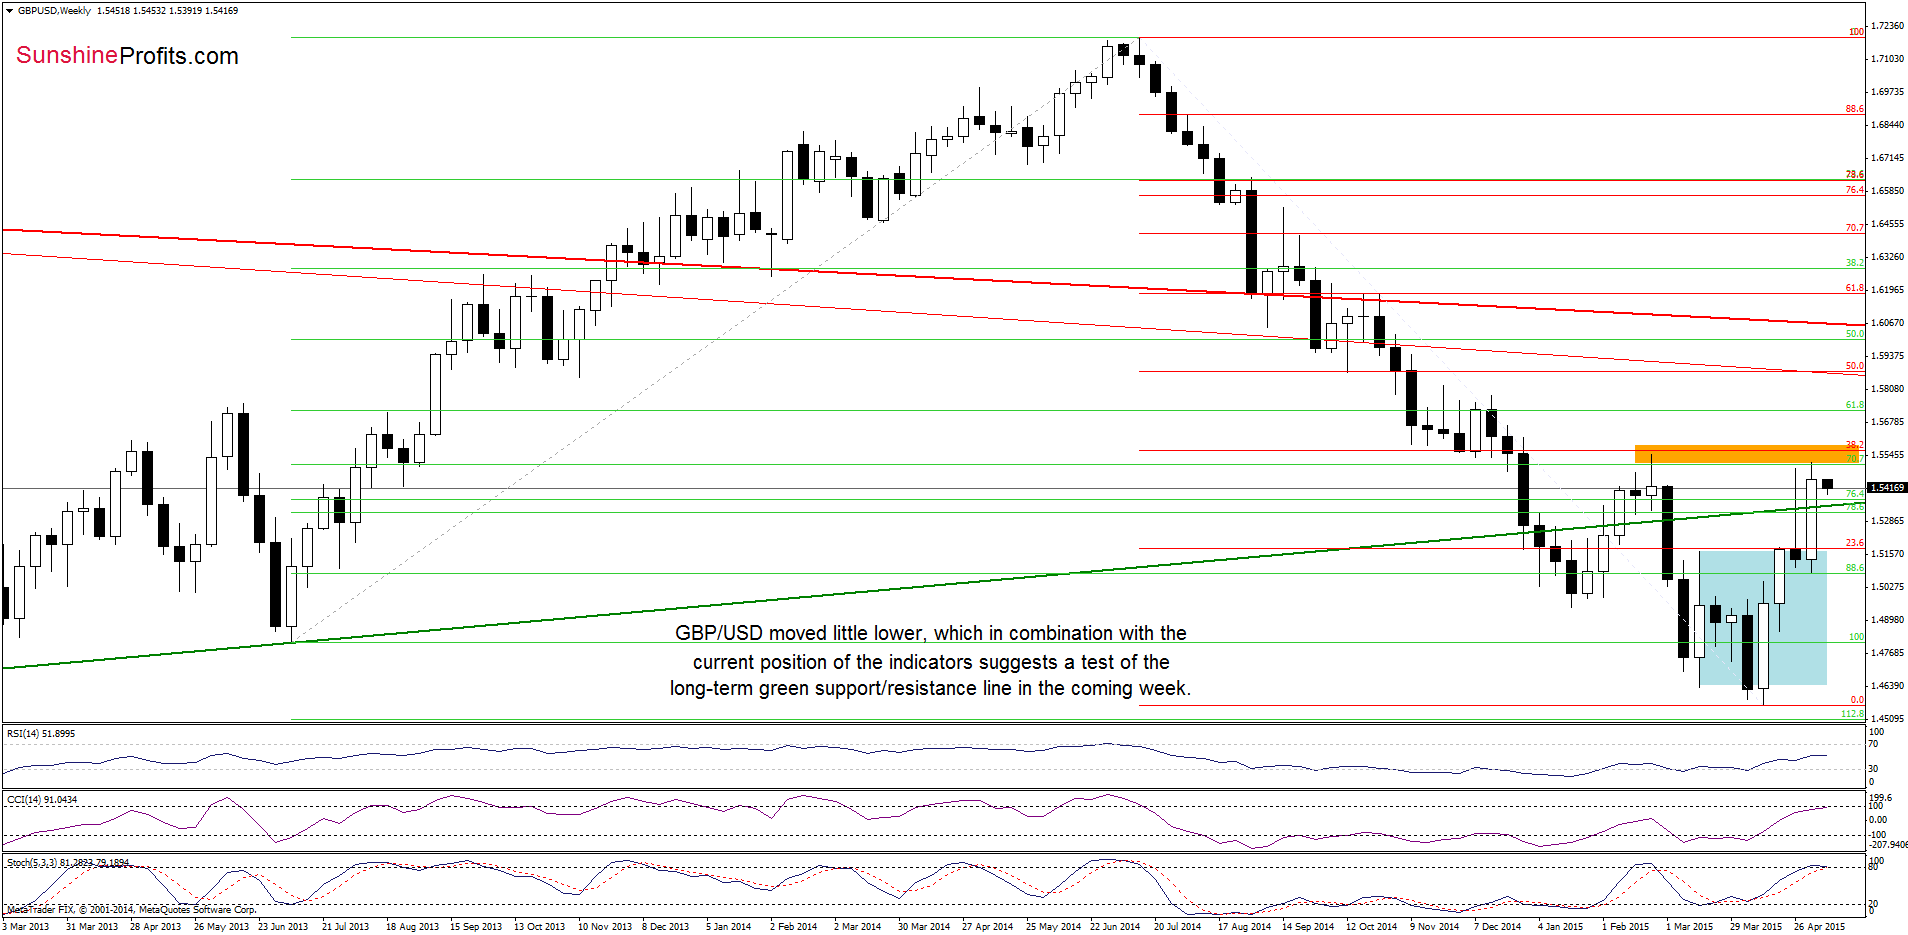
On the weekly chart we see that the orange resistance zone triggered a pullback, which in combination with the current position of the indicators (the Stochastic Oscillator is very close to generating a sell signal, while the CCI is almost overbought) suggests a drop to the long-term green support/resistance line (currently around 1.5350) in th coming week.
Are there any short-term factors that could encourage currency bears to act? Let’s examine the daily chart and find out.
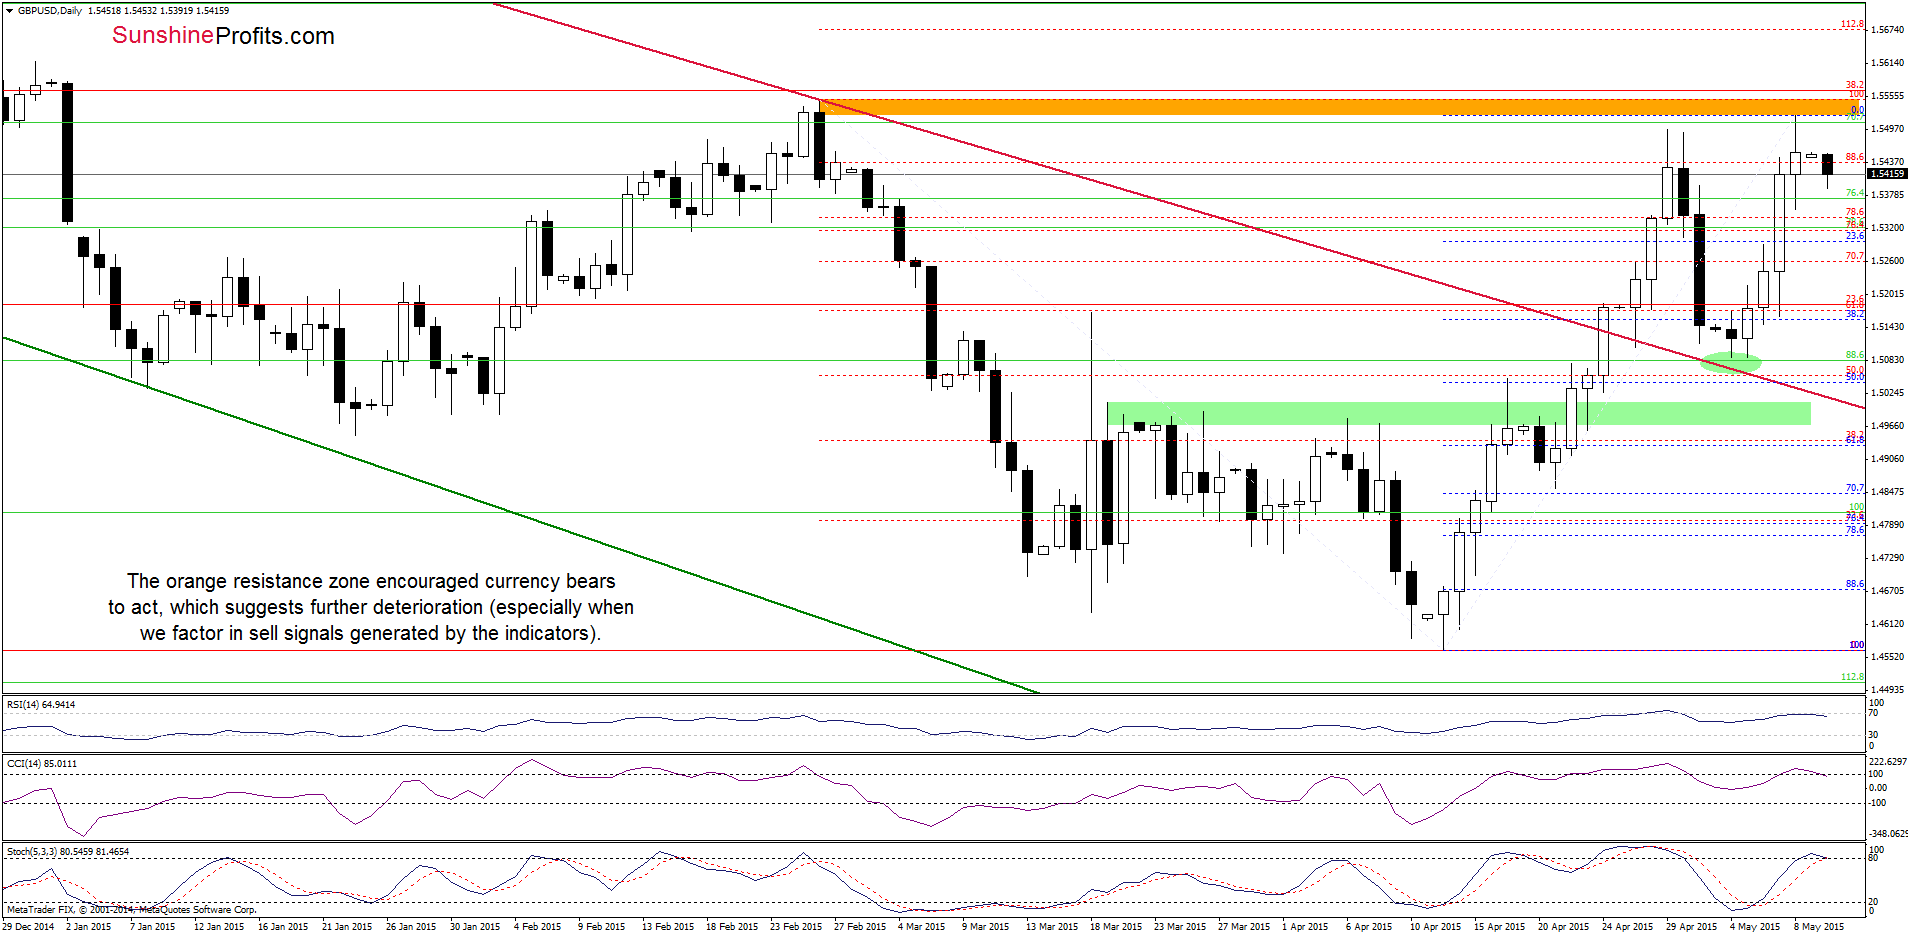
From this perspective, we see that the orange resistance zone stopped further improvement and triggered a pullback earlier today. Although it is not deep or sharp at the moment, we think that the current position of the indicators (they all generated sell signals) will encourage currency bears to act and we’ll see lower values of the exchange rate in the coming days. If this is the case, the initial downside target would be the 23.6% Fibonacci retracement (based on the entire recent rally) around 1.5300. If it is broken, the next target would be around 1.5088-1.5155, where the bottom of the recent pullback and the 38.2% Fibonacci retracement (based on the Apr-May rally) are.
Very short-term outlook: mixed with bearish bias
Short-term outlook: mixed
MT outlook: mixed
LT outlook: mixed
Trading position (short-term; our opinion): No positions are justified from the risk/reward perspective at the moment. We will keep you informed should anything change, or should we see a confirmation/invalidation of the above.
AUD/USD
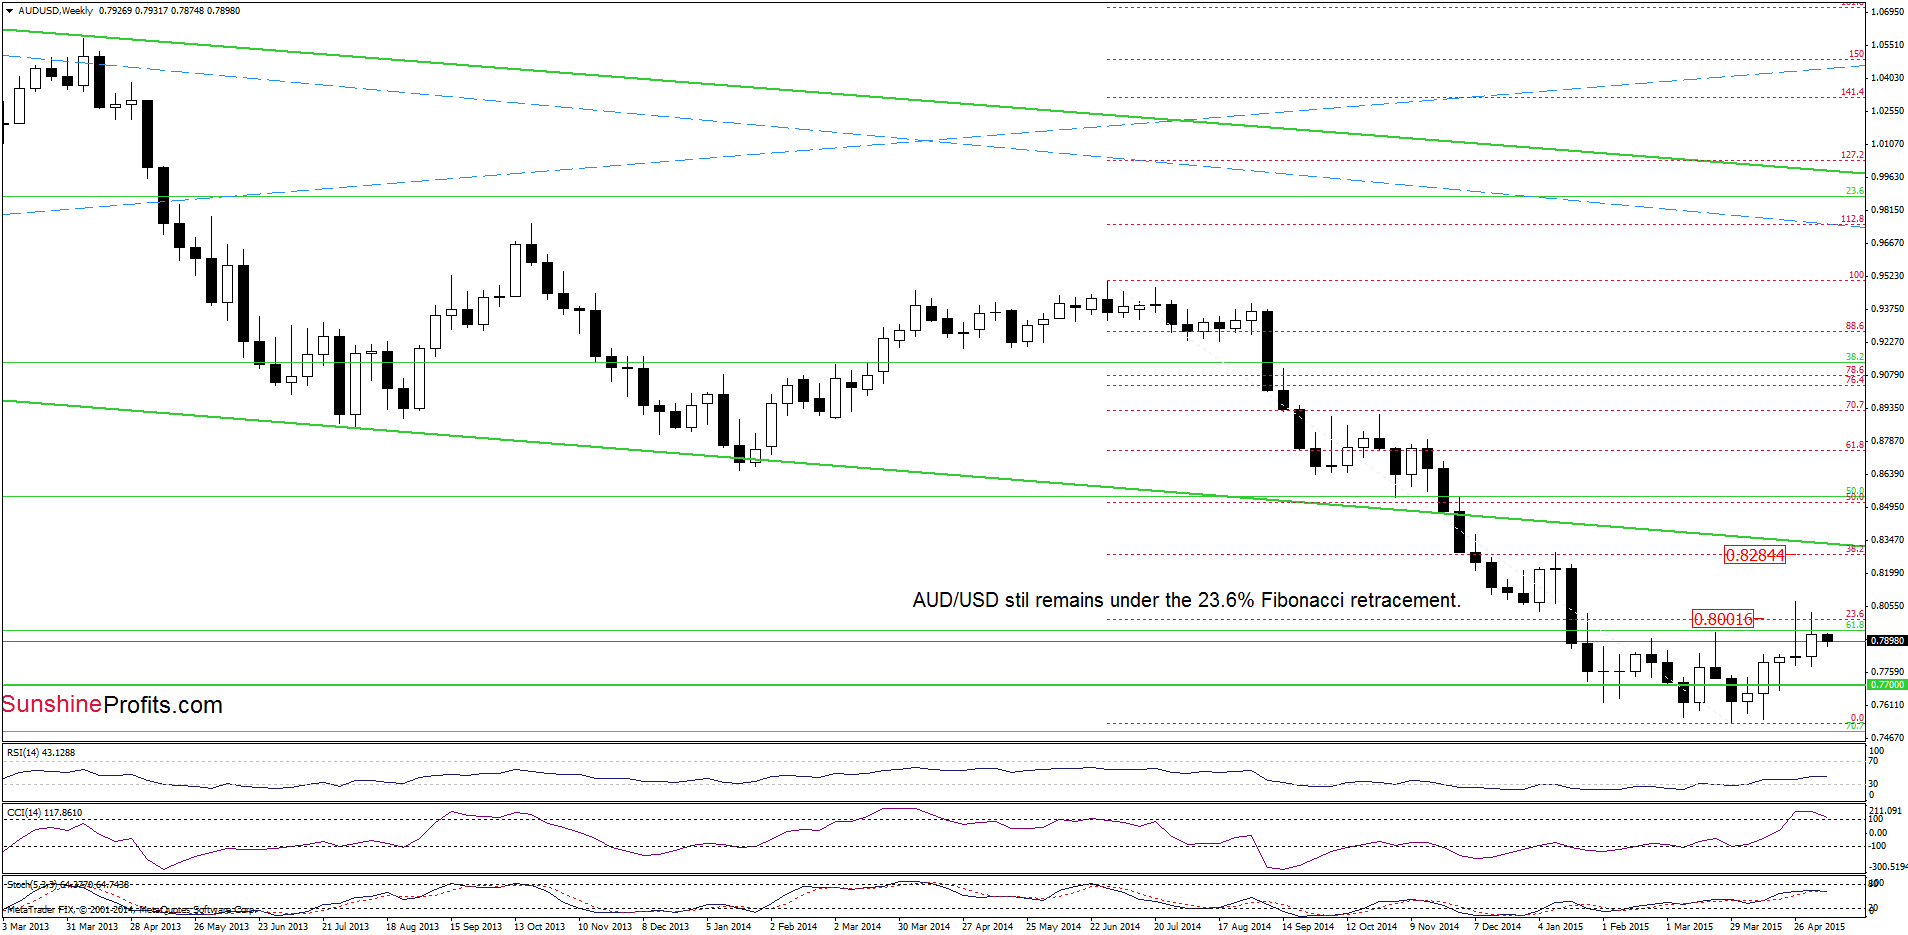
The medium-term picture hasn’t changed much as AUD/USD is still trading below the 23.6% Fibonacci retracement, which suggests that an invalidation of the breakout and its potential negative impact on future moves is still in effect.
What can we infer from the very short-term picture?
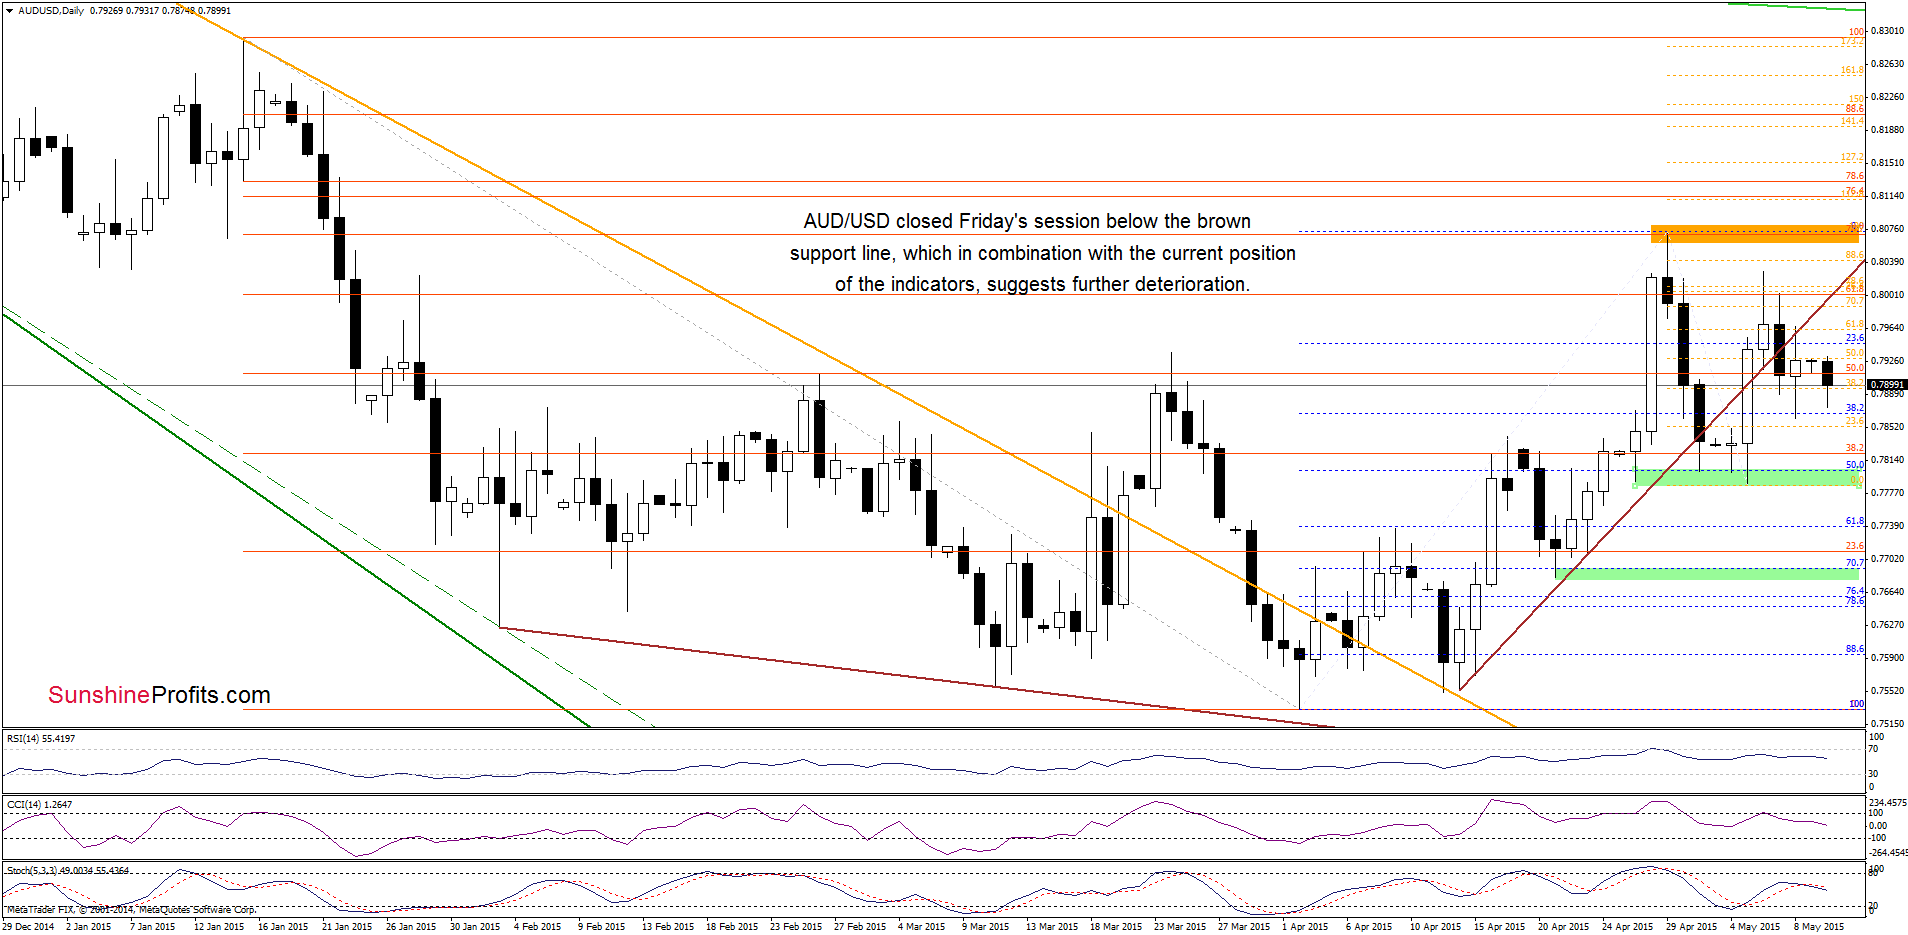
On the above chart, we see that AUD/USD extended losses and closed Friday’s session below the brown support line, which means that what we wrote in our last commentary on this currency pair is up-to-date:
(…) the current position of the indicators (sell signals remain in place) suggests further deterioration. If this is the case, today’s upswing will be nothing more than a verification of earlier breakdown, which will result in lower values of the exchange rate. How low could the pair go? In our opinion, the initial downside target would be around 0.7800, where the bottom of the recent pullback and the 50% Fibonacci retracement are. If this area is broken, we might see a decline even to around 0.7690, where the Apr 21 low and the 70.7% Fibonacci retracement are.
Very short-term outlook: bearish
Short-term outlook: mixed
MT outlook: mixed
LT outlook: mixed
Trading position (short-term; our opinion): No positions are justified from the risk/reward perspective at the moment. We will keep you informed should anything change, or should we see a confirmation/invalidation of the above.
Thank you.
Nadia Simmons
Forex & Oil Trading Strategist
Przemyslaw Radomski, CFA
Founder, Editor-in-chief
Gold & Silver Trading Alerts
Forex Trading Alerts
Oil Investment Updates
Oil Trading Alerts

