

Earlier today, the Department of Labor reported that the U.S. economy added 223,000 jobs in April, slightly below expectations for an increase of 224,000. The report also showed that the U.S. unemployment rate slipped to 5.4% in the previous month from 5.5% in March. These positive numbers supported the USD Index, which climbed above 95, but did this increase change the short-term picture of major currency pairs?
In our opinion the following forex trading positions are justified - summary:
EUR/USD
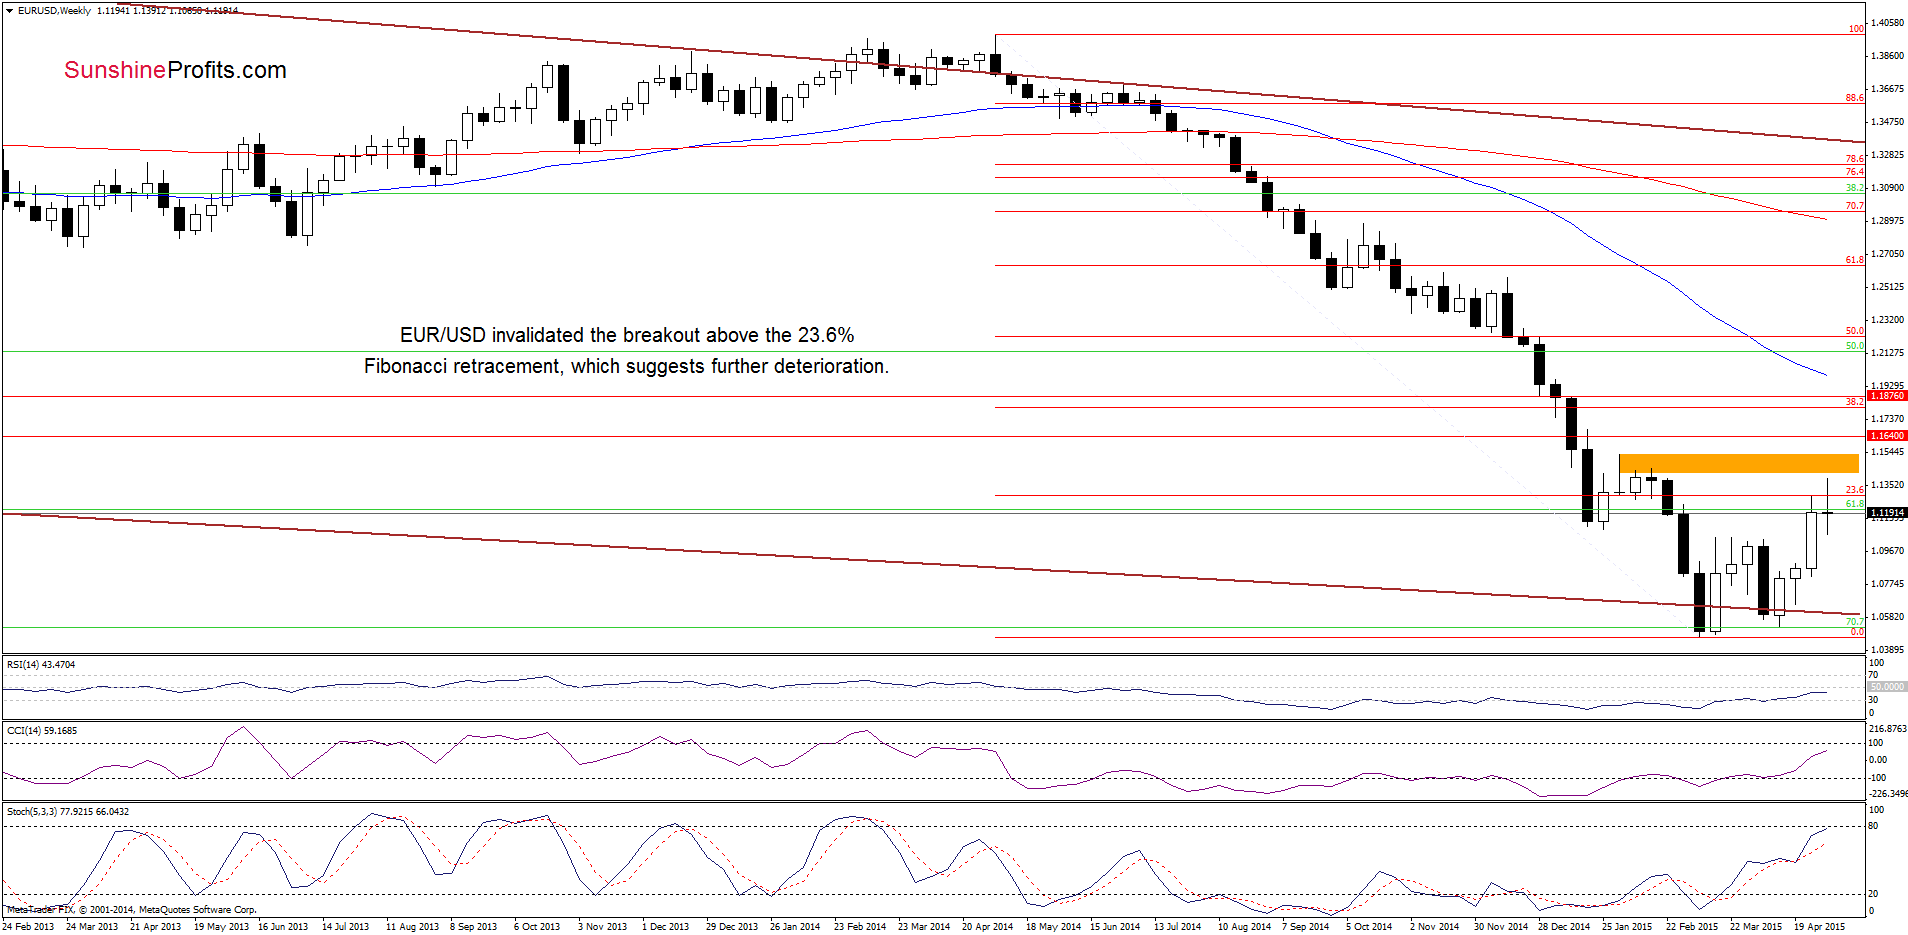
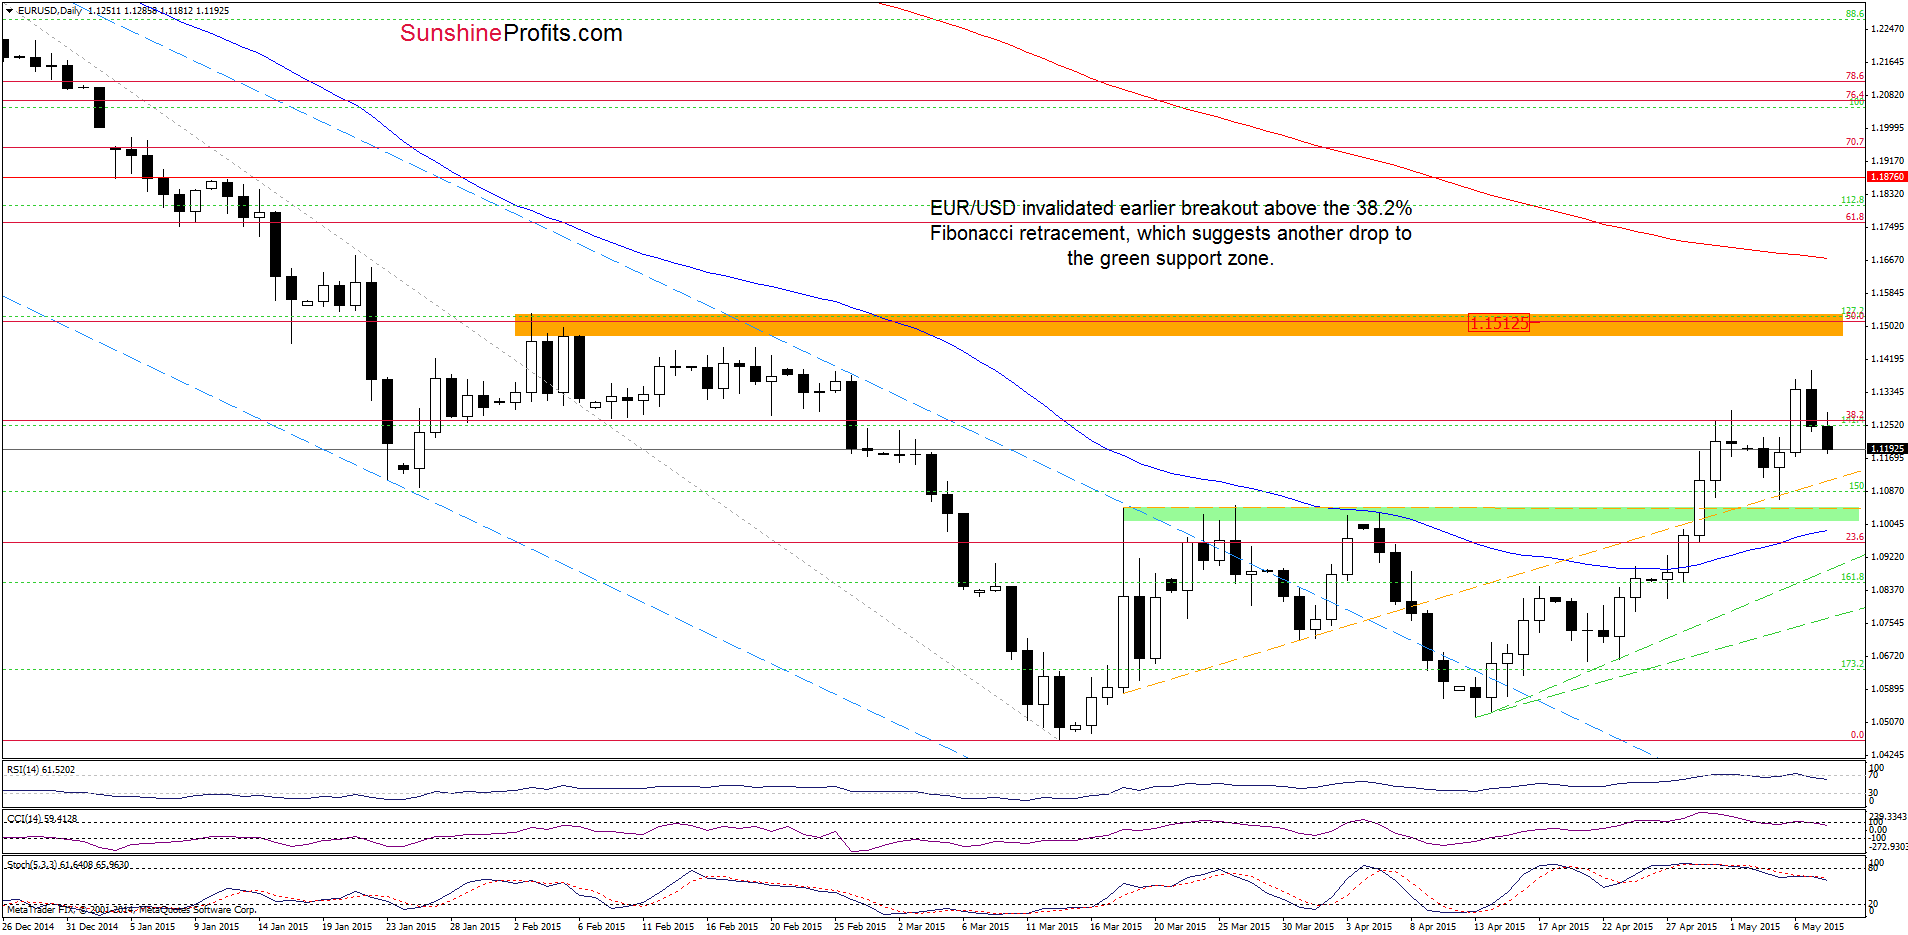
Looking at the charts, we see that EUR/USD moved lower and invalidated earlier breakout above the 23.6% and 38.2% Fibonacci retracement levels. Additionally, all indicators generated sell signals, which suggest further deterioration (especially if the pair closes today’s session below these retracement levels). If we see such price action, the initial downside target for currency bears would be the green support zone (around 1.1000-1.1050).
Very short-term outlook: mixed with bearish bias
Short-term outlook: mixed
MT outlook: mixed
LT outlook: mixed
Trading position (short-term; our opinion): No positions are justified from the risk/reward perspective at the moment. We will keep you informed should anything change, or should we see a confirmation/invalidation of the above.
GBP/USD
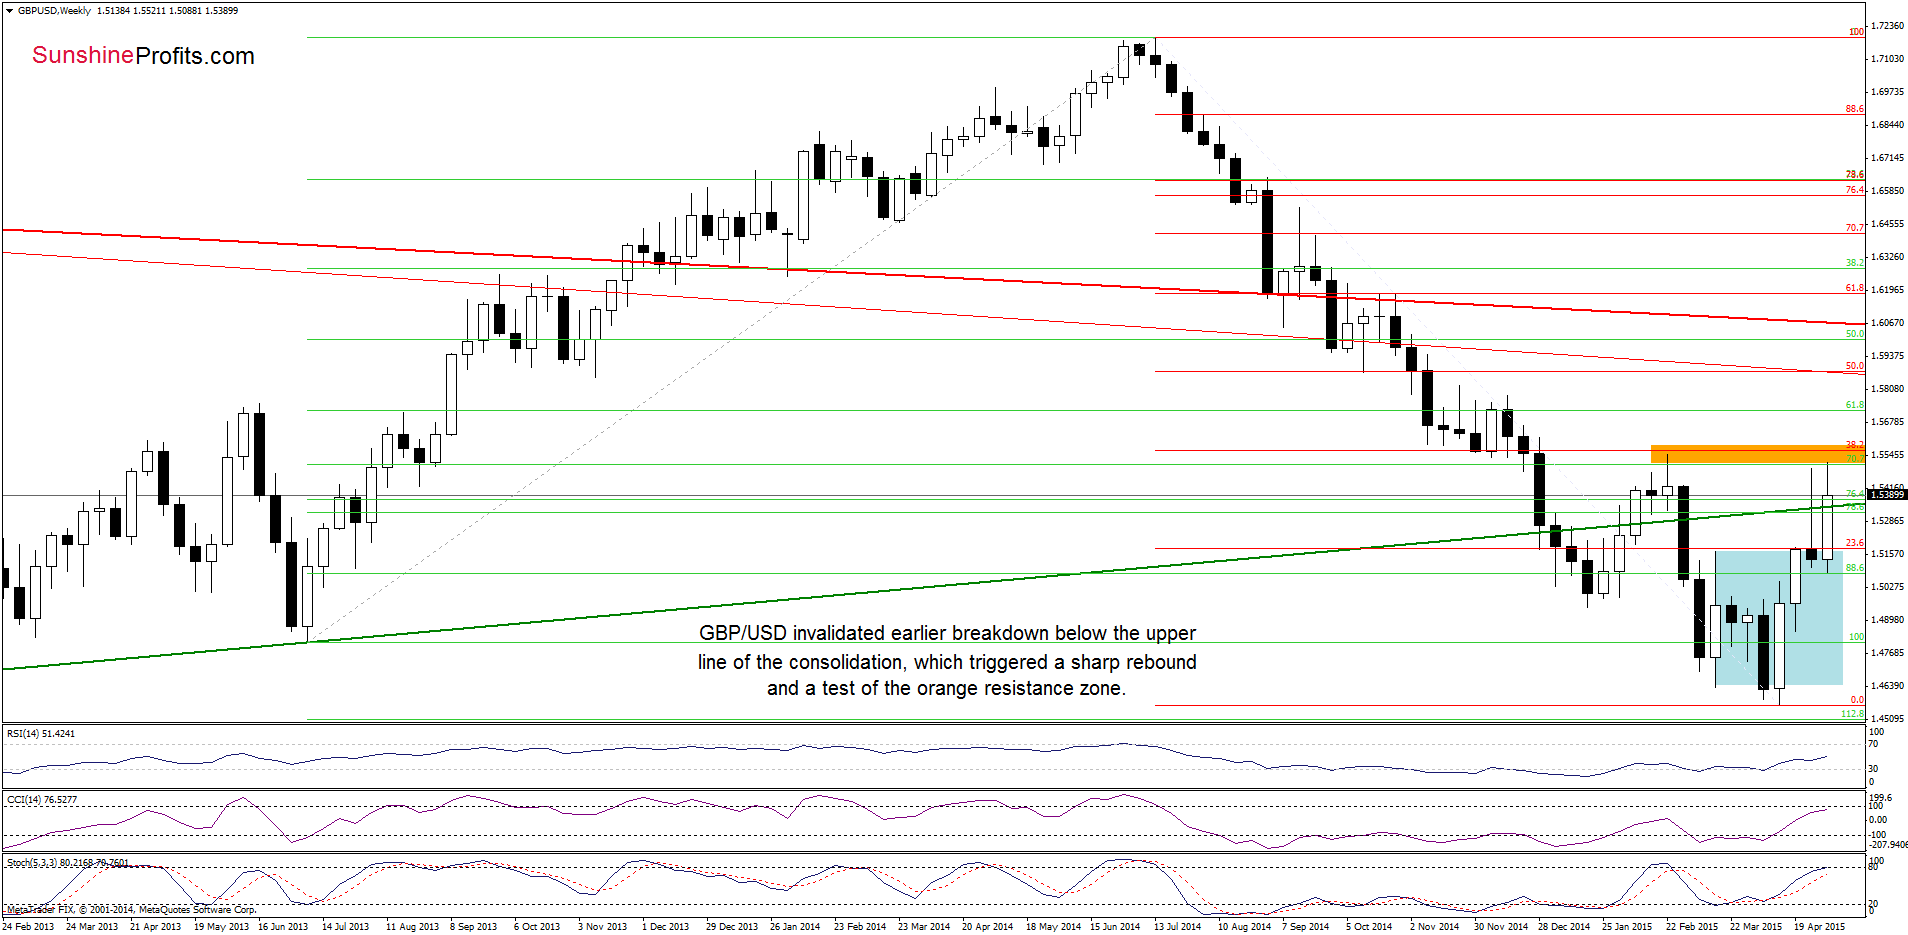
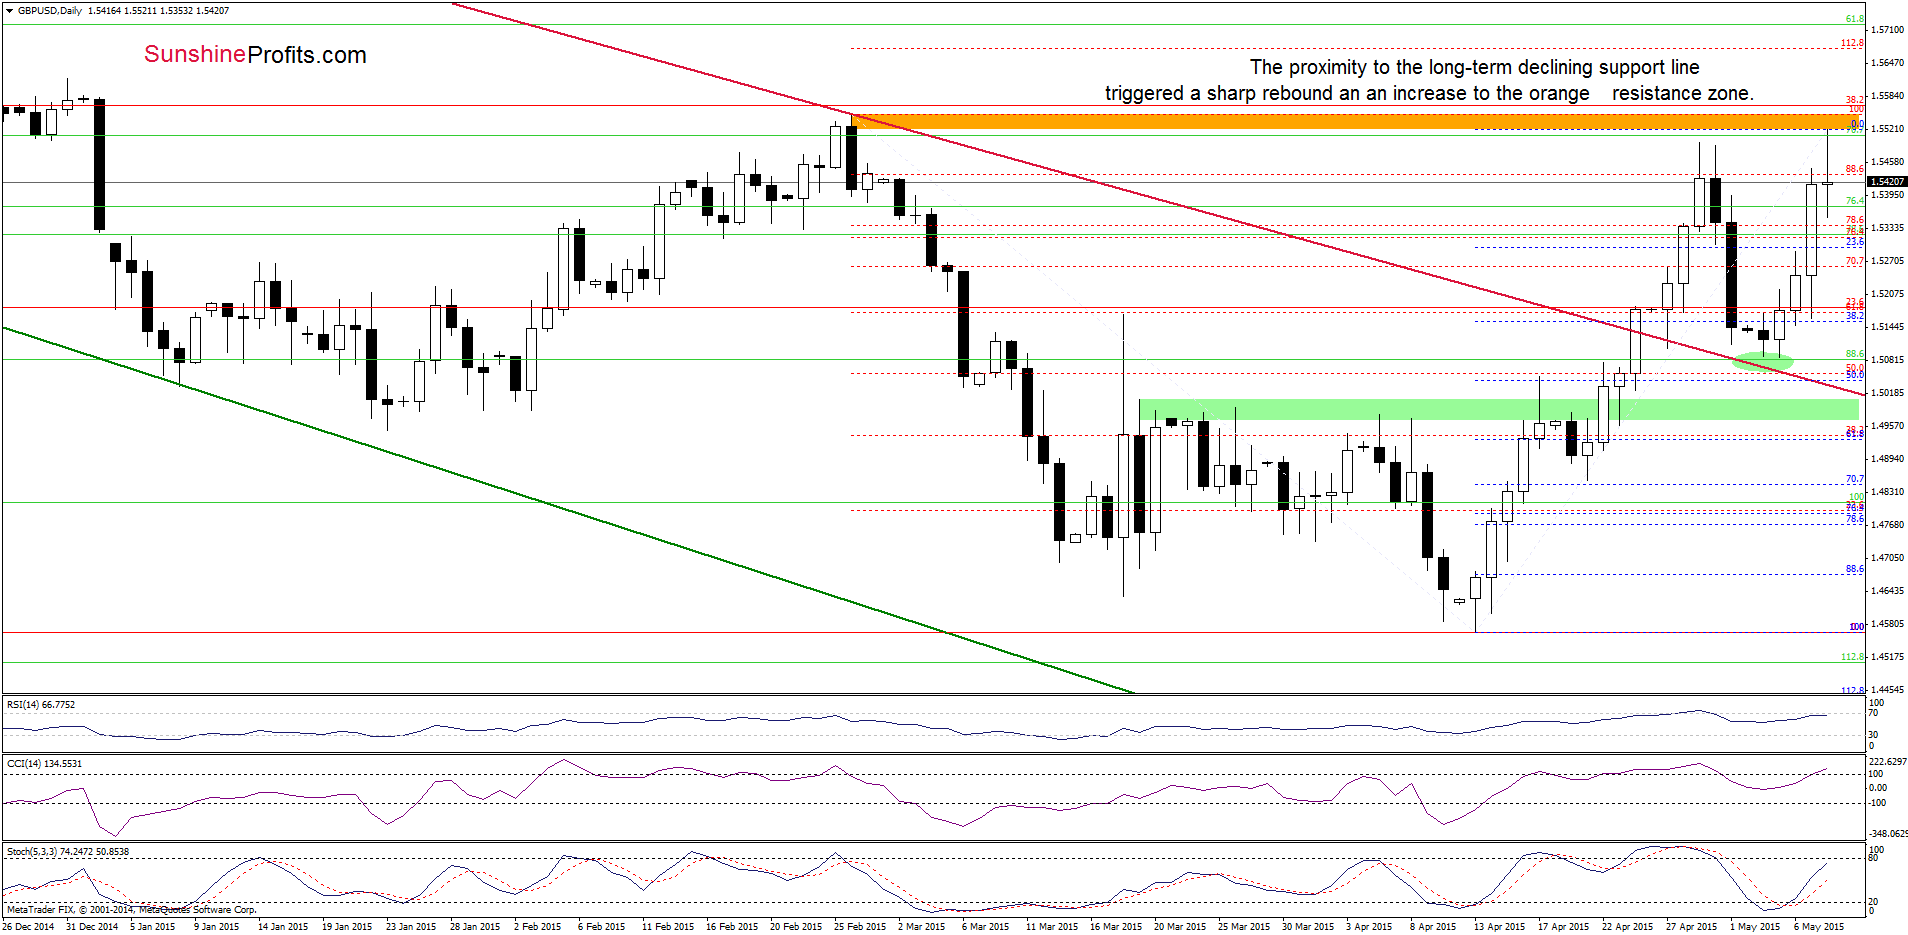
From today’s point of view we see that the proximity to the long-term crimson declining support line (marked on the daily chart) encouraged currency bulls to act, which resulted in an invalidation of the breakdown below the upper line of the consolidation (marked with blue on the weekly chart). This positive signal triggered further improvement and a comeback above the green long-term support/resistance line. With this upward move, GBP/USD climbed to the orange resistance zone created by the Feb high and the 38.2% Fibonacci retracement (based on the entire Jul-Apr declines), which could stop further improvement. If this is the case, and the pair moves lower from here, the initial downside target would be around 1.5088-1.5155, where the bottom of the recent pullback and the 38.2% Fibonacci retracement (based on the Apr-May rally) are.
Very short-term outlook: mixed with bearish bias
Short-term outlook: mixed
MT outlook: mixed
LT outlook: mixed
Trading position (short-term; our opinion): No positions are justified from the risk/reward perspective at the moment. We will keep you informed should anything change, or should we see a confirmation/invalidation of the above.
USD/JPY
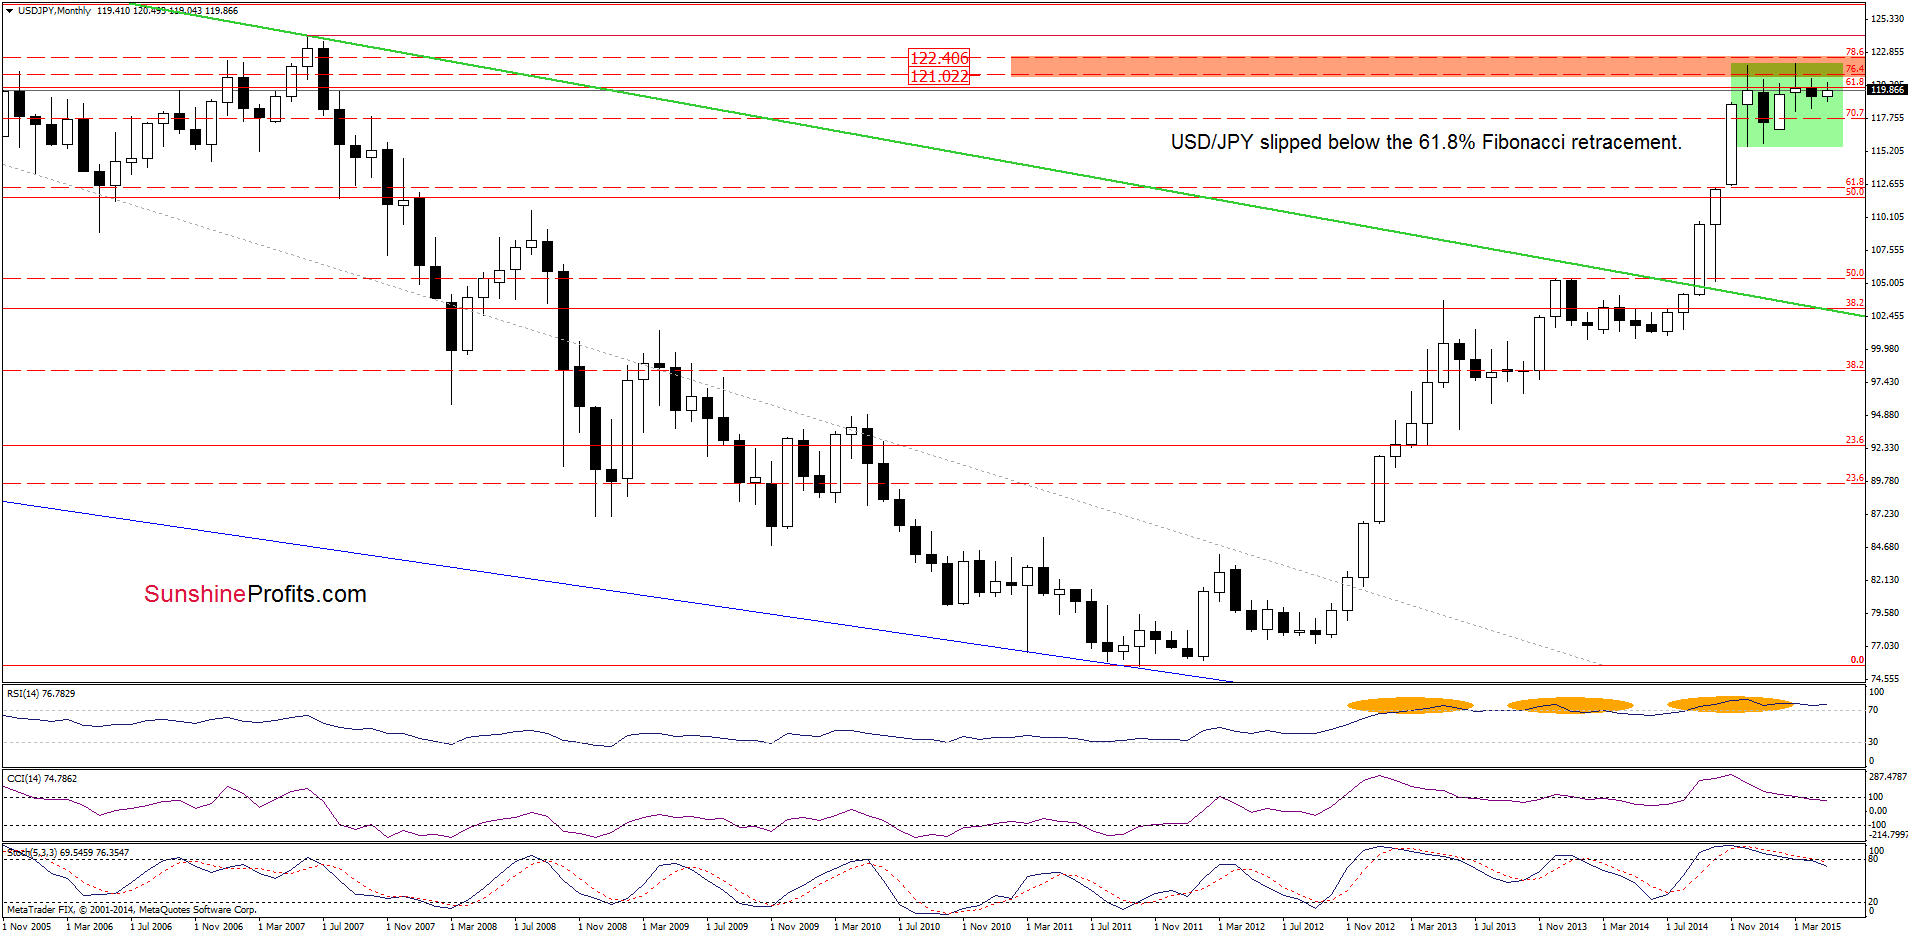
From this perspective we see that USD/JPY slipped under the 61.8% Fibonacci retracement level once again. Nevertheless, as long as the pair is trading in a consolidation, the long-term picture remains unclear.
Will the daily chart give us some valuable clues about future moves? Let’s check.
In our last commentary on this currency pair, we wrote:
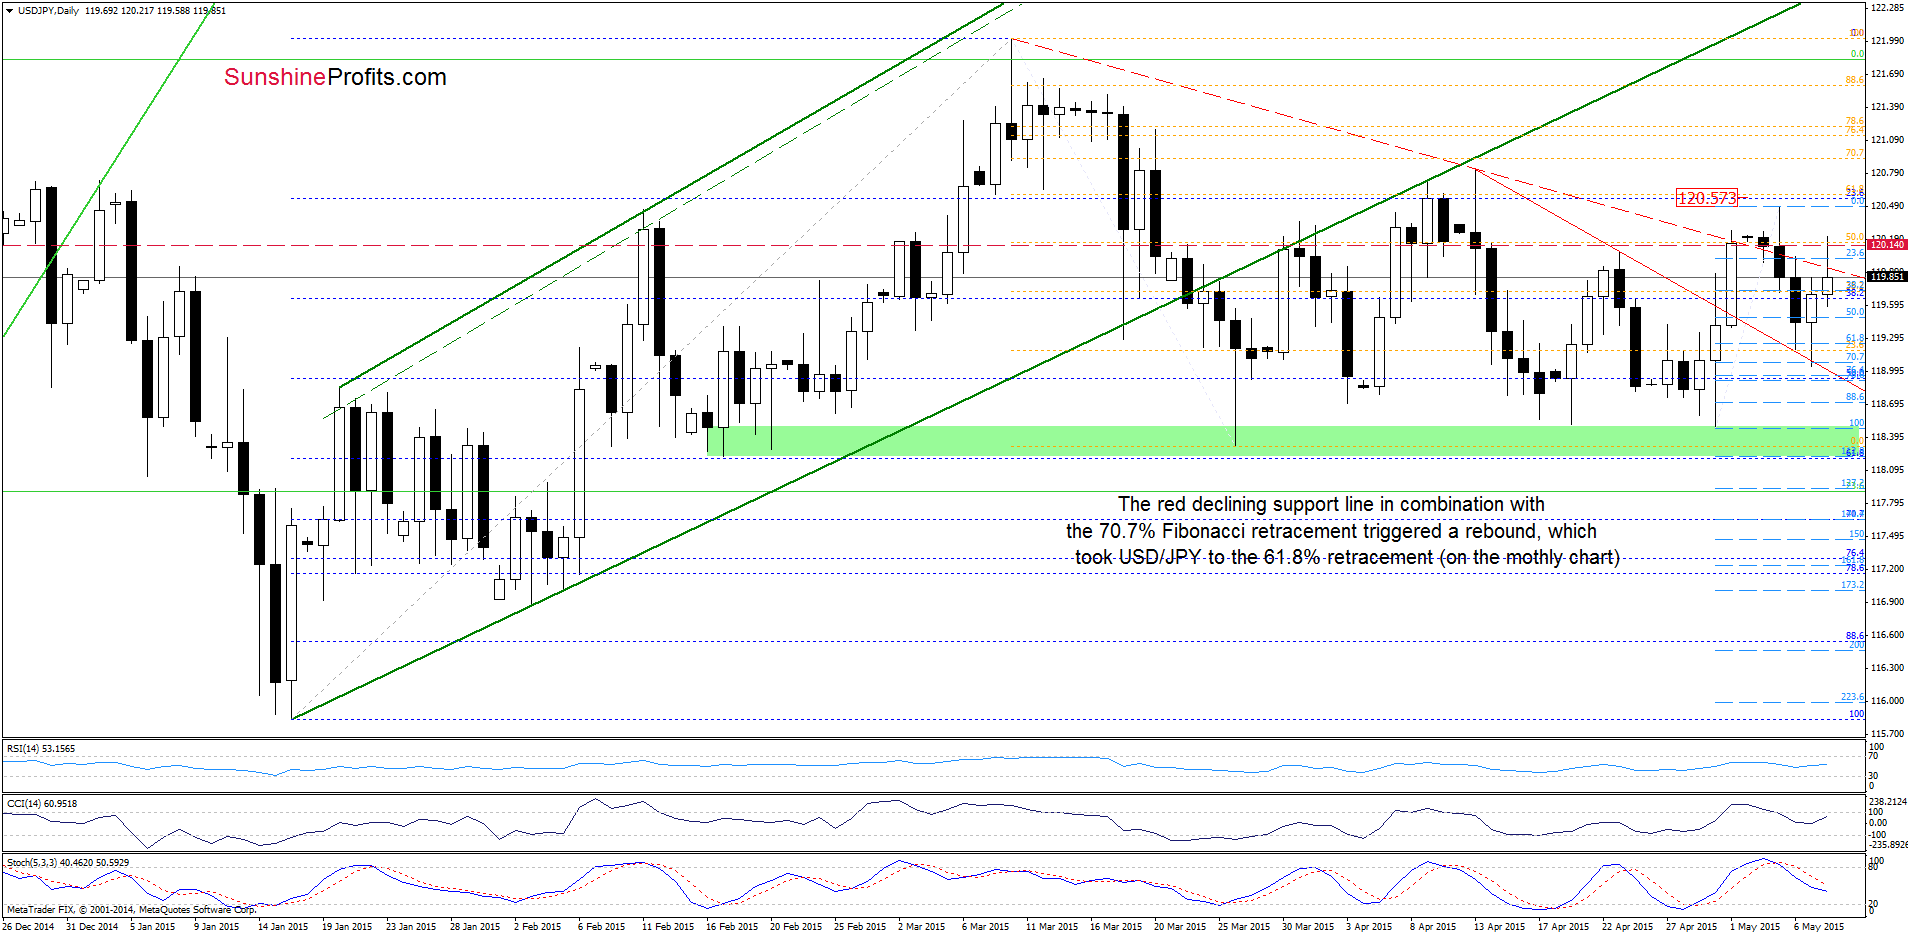
(…) USD/JPY moved sharply lower and reached the 50% Fibonacci retracement (based on the recent rally) earlier today. Although the pair could rebound from here, we think that the current position of the indicators will trigger further deterioration. If this is the case, the initial downside target would be around 119.24, where the 61.8% retracement is. If it is broken, we might see a drop to the previously-broken red declining line (currently at 119.07), which intersects the 70.7% Fibonacci retracement at the moment.
As you see on the daily chart, the situation developed in line with the above scenario and USD/JPY declined to our downside target. This support area triggered a sharp rebound, which erased most of the recent decline and took the exchange rate to the 61.8% Fibonacci retracement (marked on the monthly chart). Despite the improvement, this key resistance still keeps gains in check, which in combination with sell signals generated by the indicators suggests that we could see another pullback in the coming week. If this is the case, the initial downside target would be the red declining line (currently at 119.02), which is slightly above the support zone created by the 76.4% and 78.6% Fibonacci retracement levels (marked with green ellipse).
Very short-term outlook: mixed
Short-term outlook: mixed
MT outlook: mixed
LT outlook: bullish
Trading position (short-term; our opinion): No positions are justified from the risk/reward perspective at the moment. We will keep you informed should anything change, or should we see a confirmation/invalidation of the above.
USD/CAD
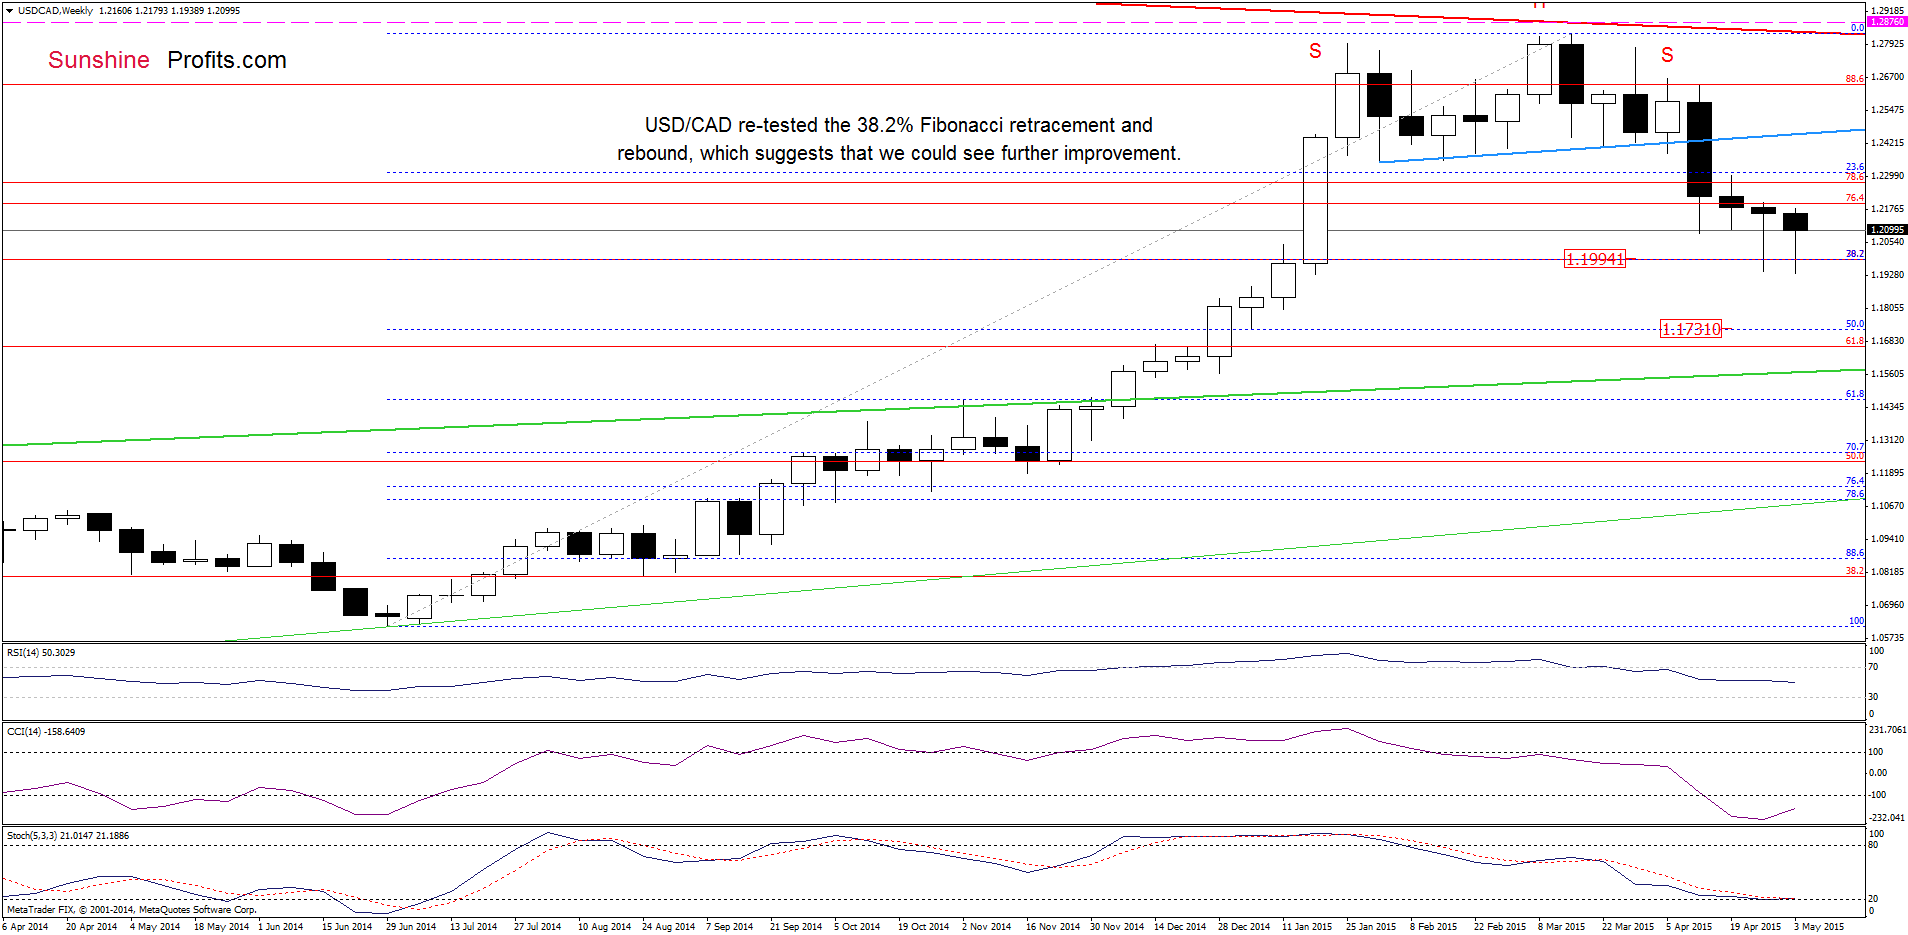
The situation in the medium term hasn’t changed much as USD/CAD is still trading above the 38.2% Fibonacci retracement. This means that an invalidation of the breakdown below this level and its poential positive impact on future moves is still in effect.
Having sais that, let’s focus on the very short-term changes.
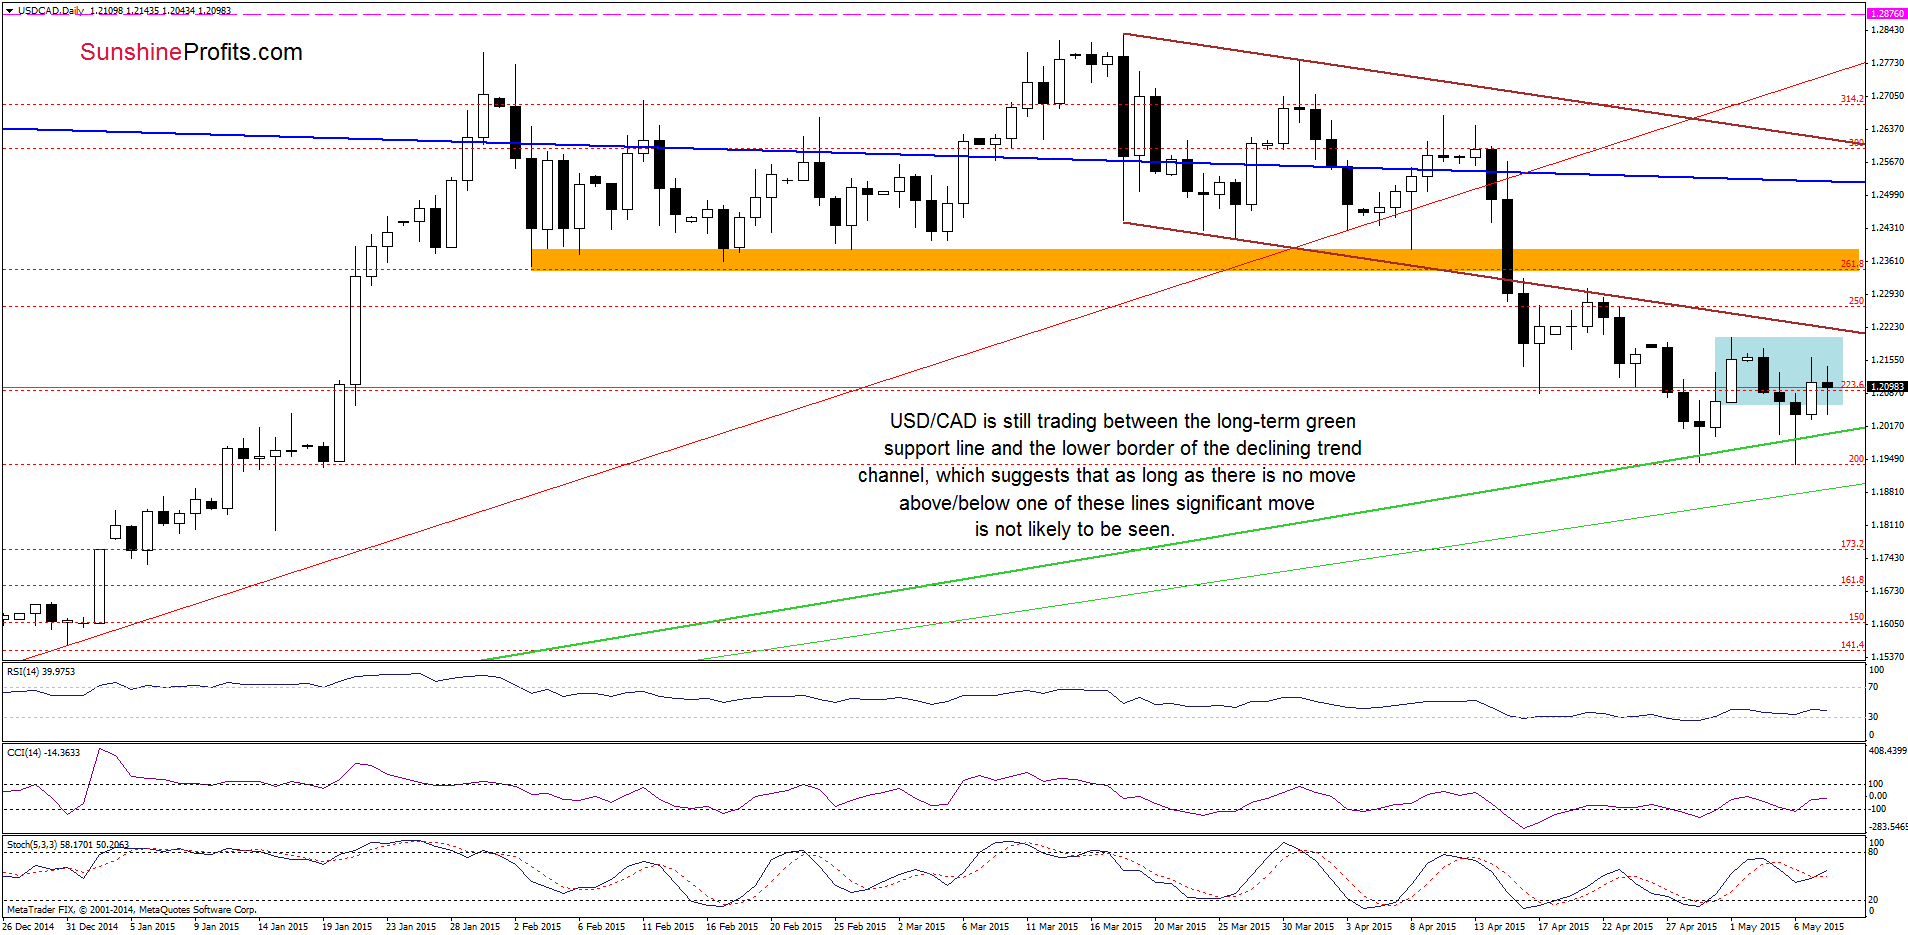
On the above chart, we see that the situation in the very short-term has improved slightly as USD/CAD bounced off the long-term green support line and came back to the consolidation range. Despite yesterday’s increase, the pair is still trading between the above-mentioned long-term support line and the lower border of the declining trend channel, which suggests that as long as there is no move above/below one of these lines significant upward or downward move is not likely to be seen. Nevertheless, we should keep in mind that buy signals generated by the daily indicators remain in place, supporting further improvement.
Very short-term outlook: mixed with bullish bias
Short-term outlook: mixed
MT outlook: mixed
LT outlook: mixed
USD/CHF
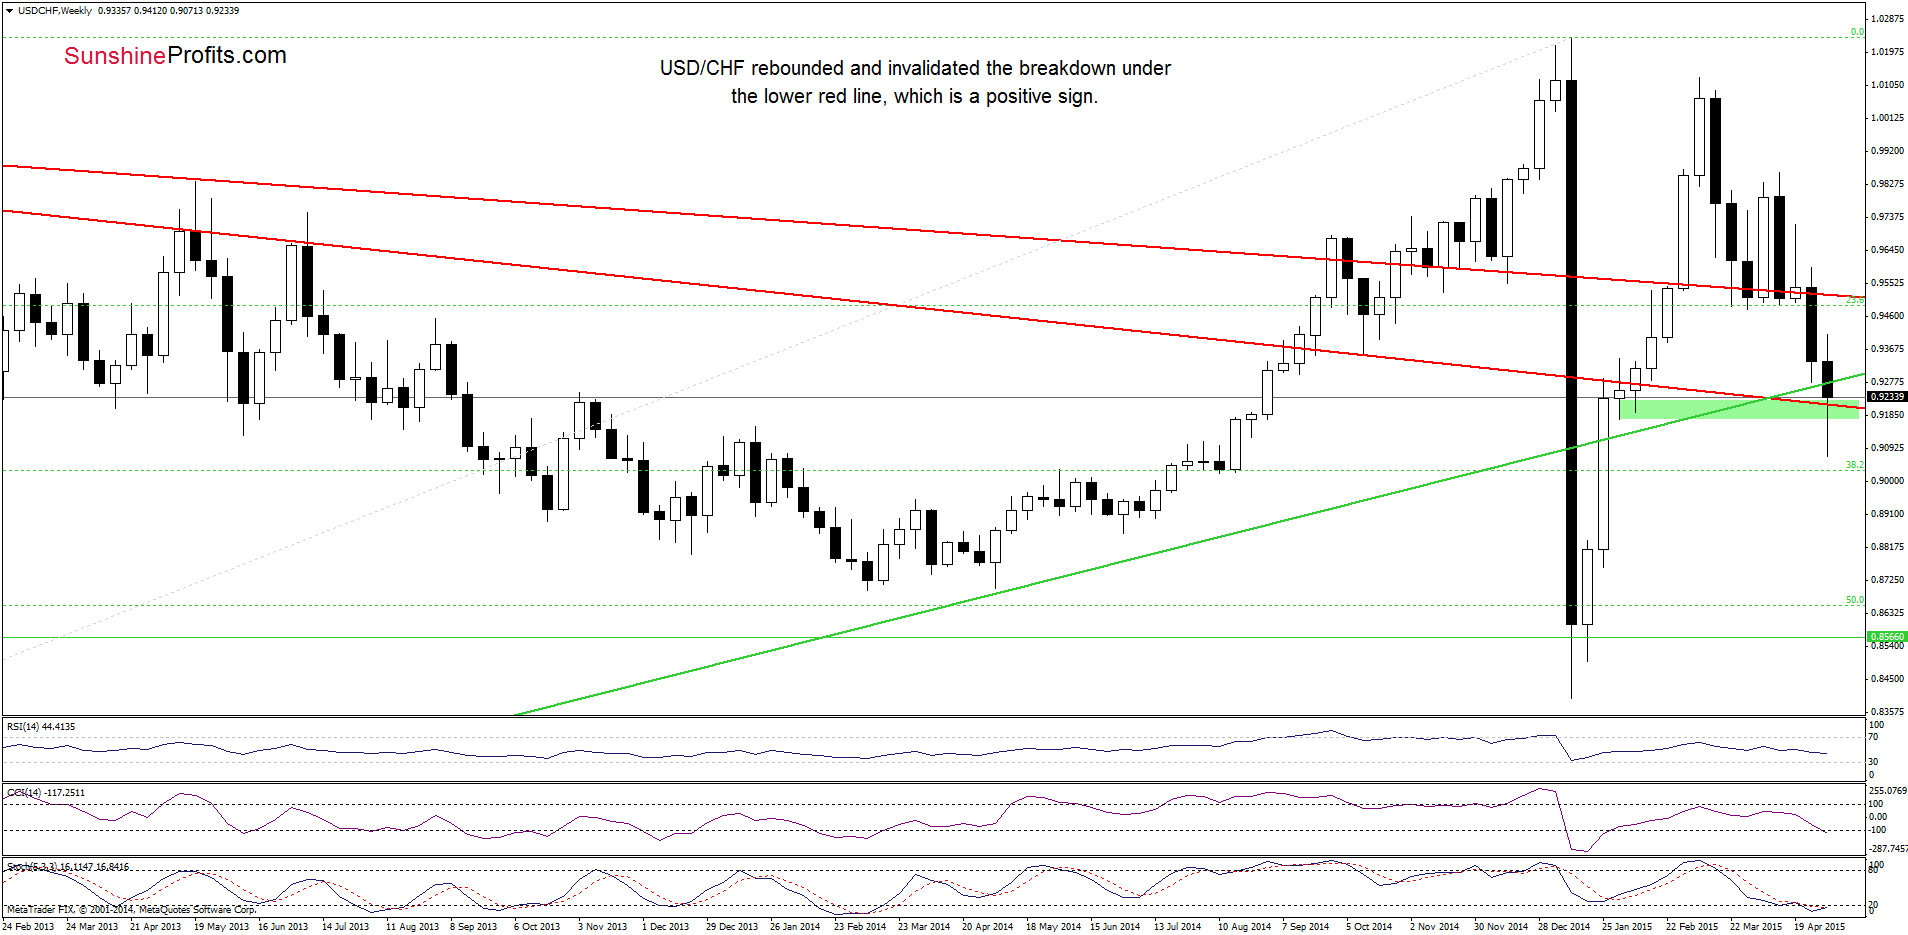
The first ting that catches the eye on the weekly chat is an invalidation of the breakdown below the lower red declining line. This is a positive sign, which suggests that currency bulls will likely try to invalidate the breakdown below the green line in the coming week.
Are there any short-term factors that could support the above scenario? Let’s take a closer look at the daily chart and find out.
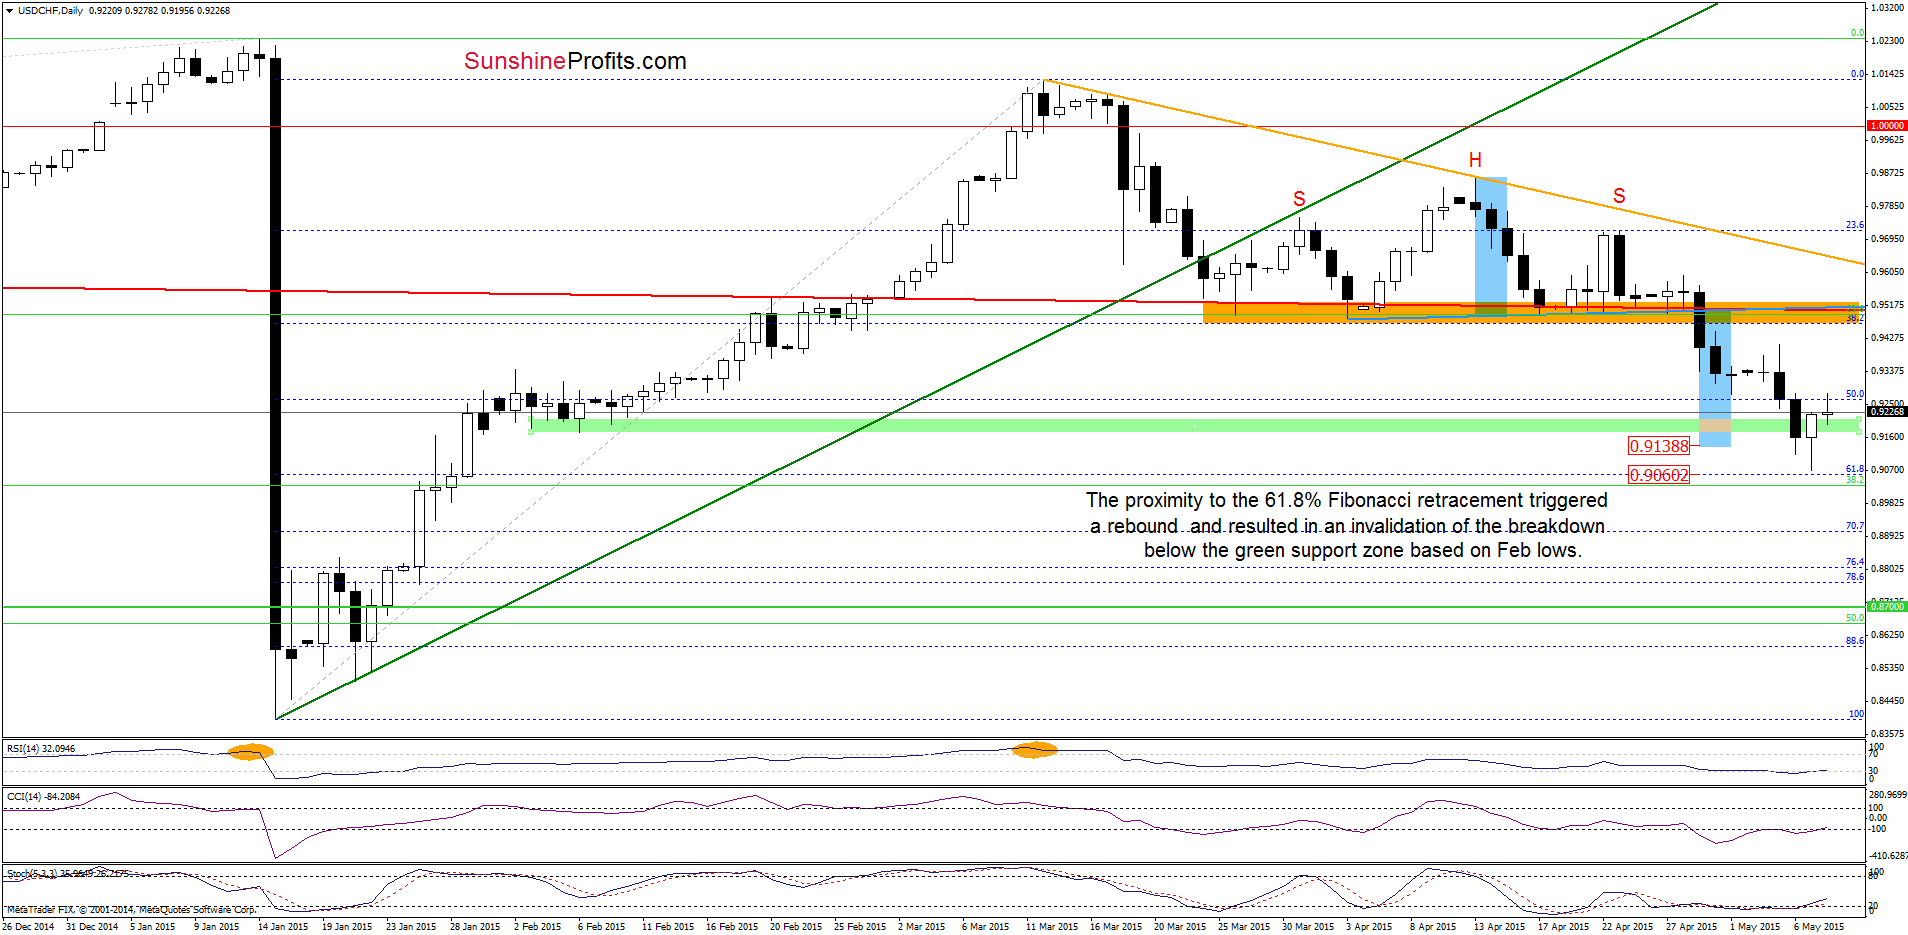
On Wednesday, we wrote the following:
(…) we think that the breakdown below the long-term red line (marked on the weekly chart) will encourage currency bears to act and result in a drop to 0.9138, where the size of the downward move will correspond to the height of the formation. At this point it is worth noting that if this area doesn’t stop declines, we might see a drop even to 0.9060, where the 61.8% Fibonacci retracement is.
From this perspective, we see that the situation developed in line with our last commentary and USD/CHF approached our downside target yesterday. As you see on the daily chart, the proximity to the 61.8% Fibonacci retracement encouraged currency bulls to act, which resulted in an invalidation of the breakdown below the green support zone based on the Feb lows. This is a positive signal, which in combination with the current position of the indicators (hey all generated buy signals) and the medium-term picture suggests further improvement. If this is the case, the initial upside target would be the orange resistance zone created by the long-term red resistance line and the neck line of the head and shoulders formation (around 0.9500).
Very short-term outlook: bullish
Short-term outlook: mixed
MT outlook: mixed
LT outlook: bearish
Trading position (short-term; our opinion): No positions are justified from the risk/reward perspective at the moment. We will keep you informed should anything change, or should we see a confirmation/invalidation of the above.
AUD/USD
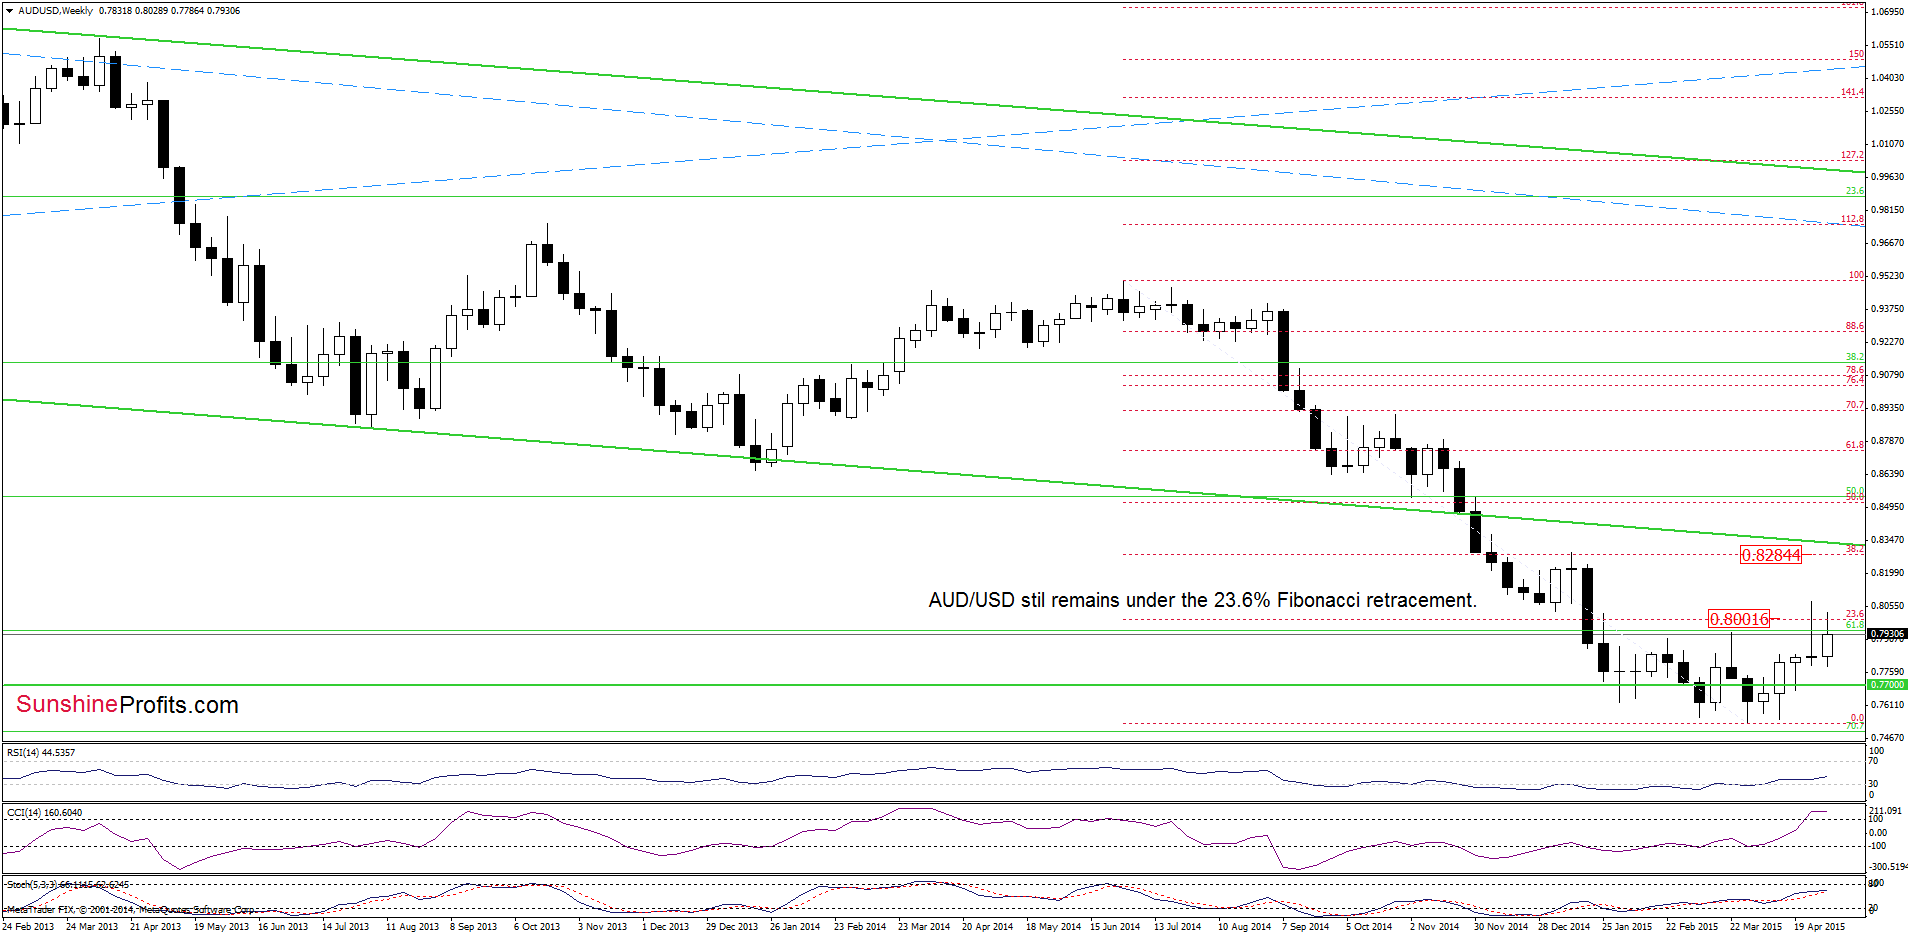
The medium-term picture hasn’t changed much as AUD/USD is still trading below the 23.6% Fibonacci retracement, which suggests that an invalidation of the breakout and its potential negative impact on future moves is still in effect.
What can we infer from the very short-term picture?
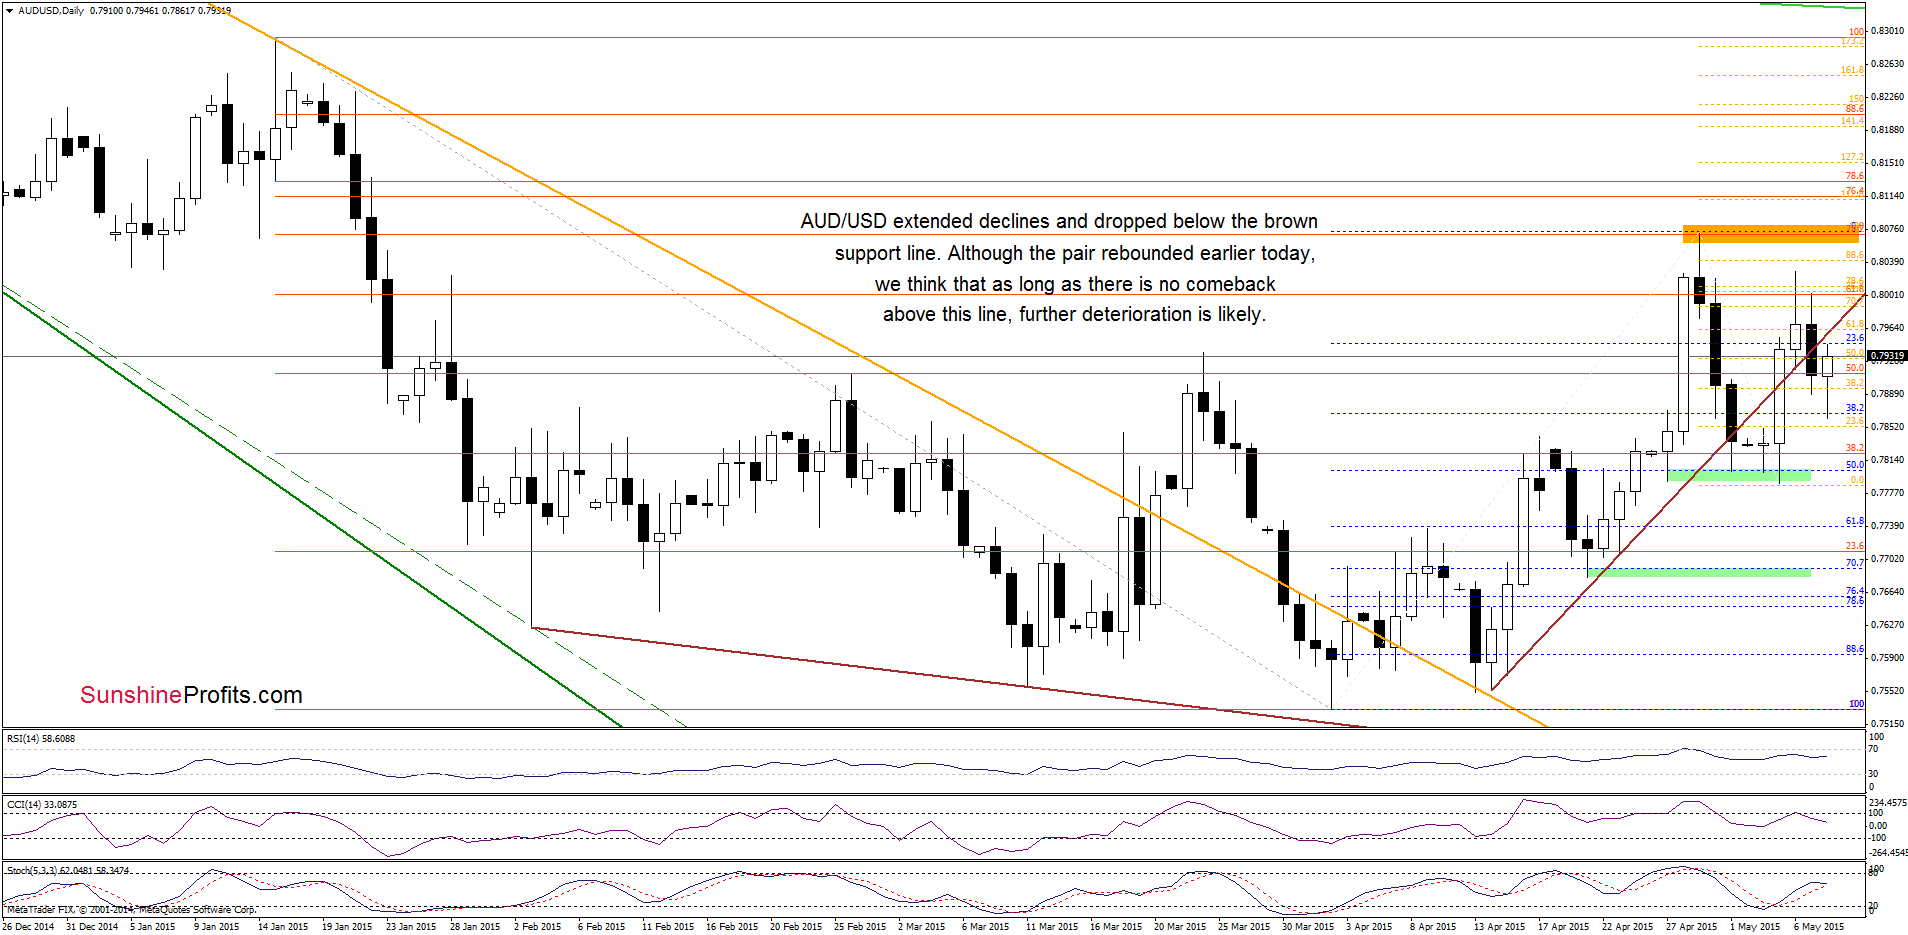
On the above chart, we see that AUD/USD extended losses and declined below the brown support line. Although the pair rebounded earlier today, the current position of the indicators (sell signals remain in place) suggests further deterioration. If this is the case, today’s upswing will be nothing more than a verification of earlier breakdown, which will result in lower values of the exchange rate. How low could the pair go? In our opinion, the initial downside target would be around 0.7800, where the bottom of the recent pullback and the 50% Fibonacci retracement are. If this area is broken, we might see a decline even to around 0.7690, where the Apr 21 low and the 70.7% Fibonacci retracement are.
Very short-term outlook: bearish
Short-term outlook: mixed
MT outlook: mixed
LT outlook: mixed
Trading position (short-term; our opinion): No positions are justified from the risk/reward perspective at the moment. We will keep you informed should anything change, or should we see a confirmation/invalidation of the above.
Thank you.
Nadia Simmons
Forex & Oil Trading Strategist
Przemyslaw Radomski, CFA
Founder, Editor-in-chief
Gold & Silver Trading Alerts
Forex Trading Alerts
Oil Investment Updates
Oil Trading Alerts

