

Earlier today, the ADP report showed that non-farm private employment increased only by 169,000 in April, missing expectations for an increase of 200,000 and fuelling worries over the strength of the U.S. labor market. Thanks to these disappointing numbers the USD/CHF dropped below long-term support line. Is it enough to push the pair below 0.9100 in the coming days?
In our opinion the following forex trading positions are justified - summary:
EUR/USD
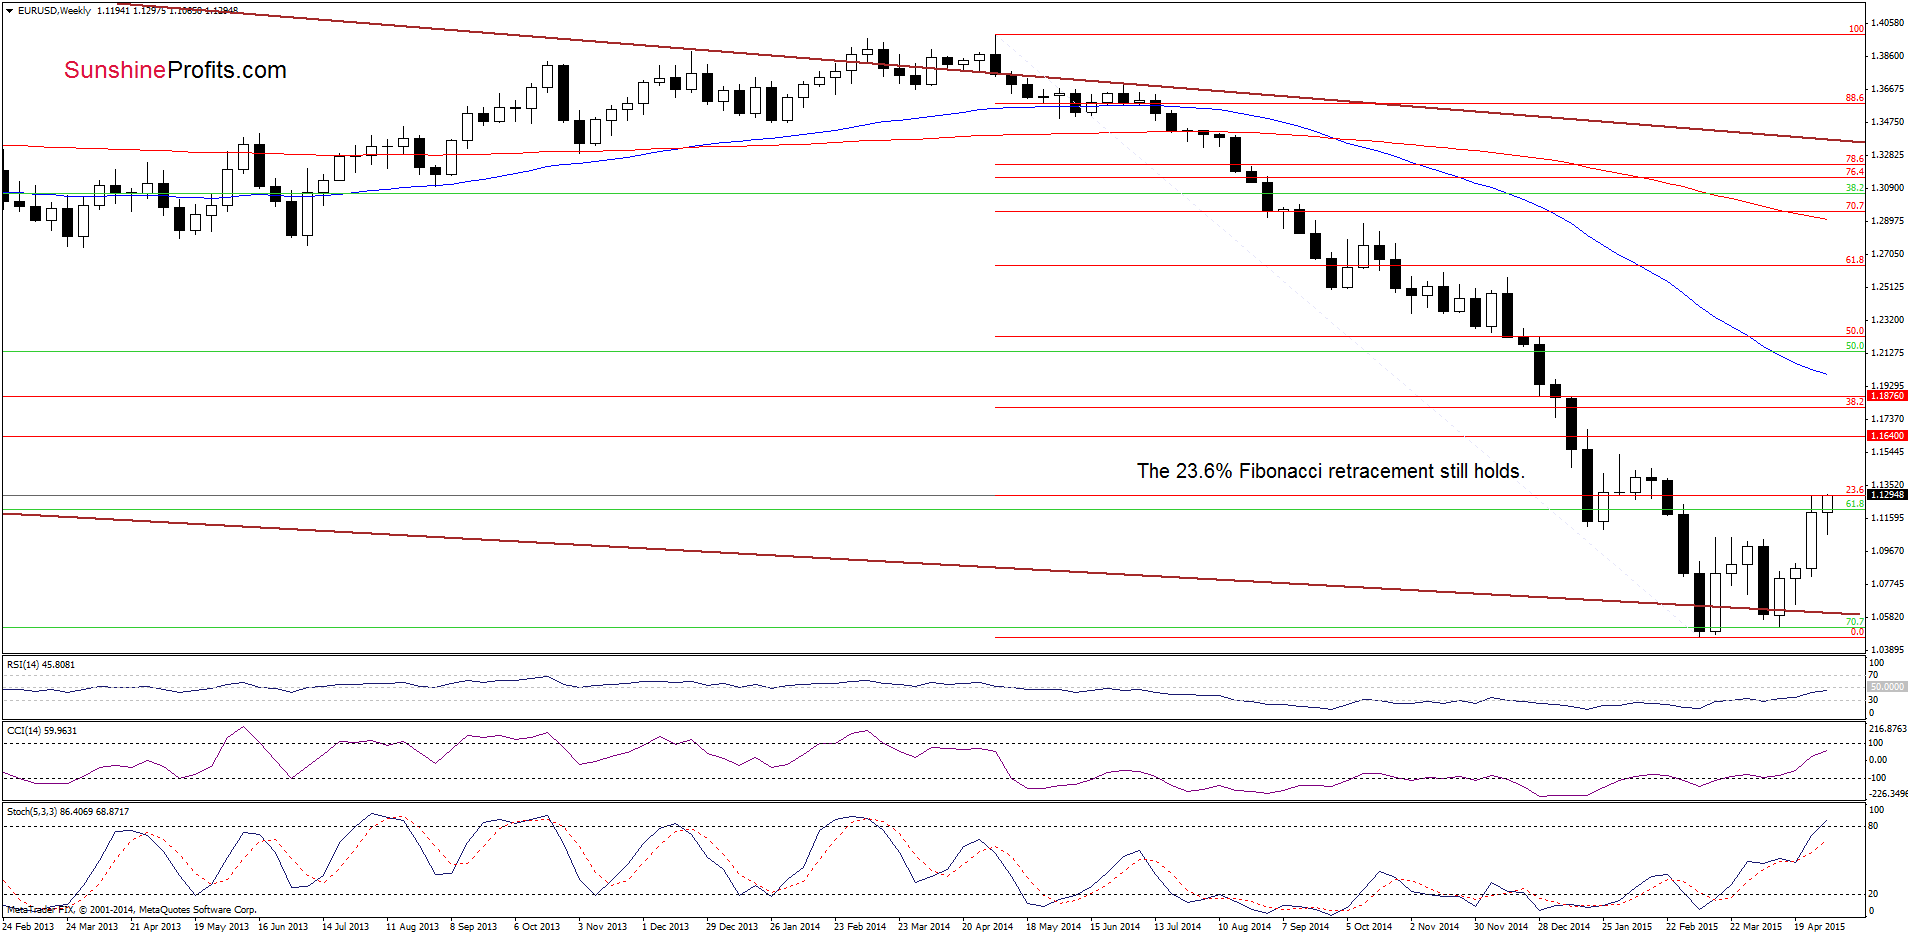
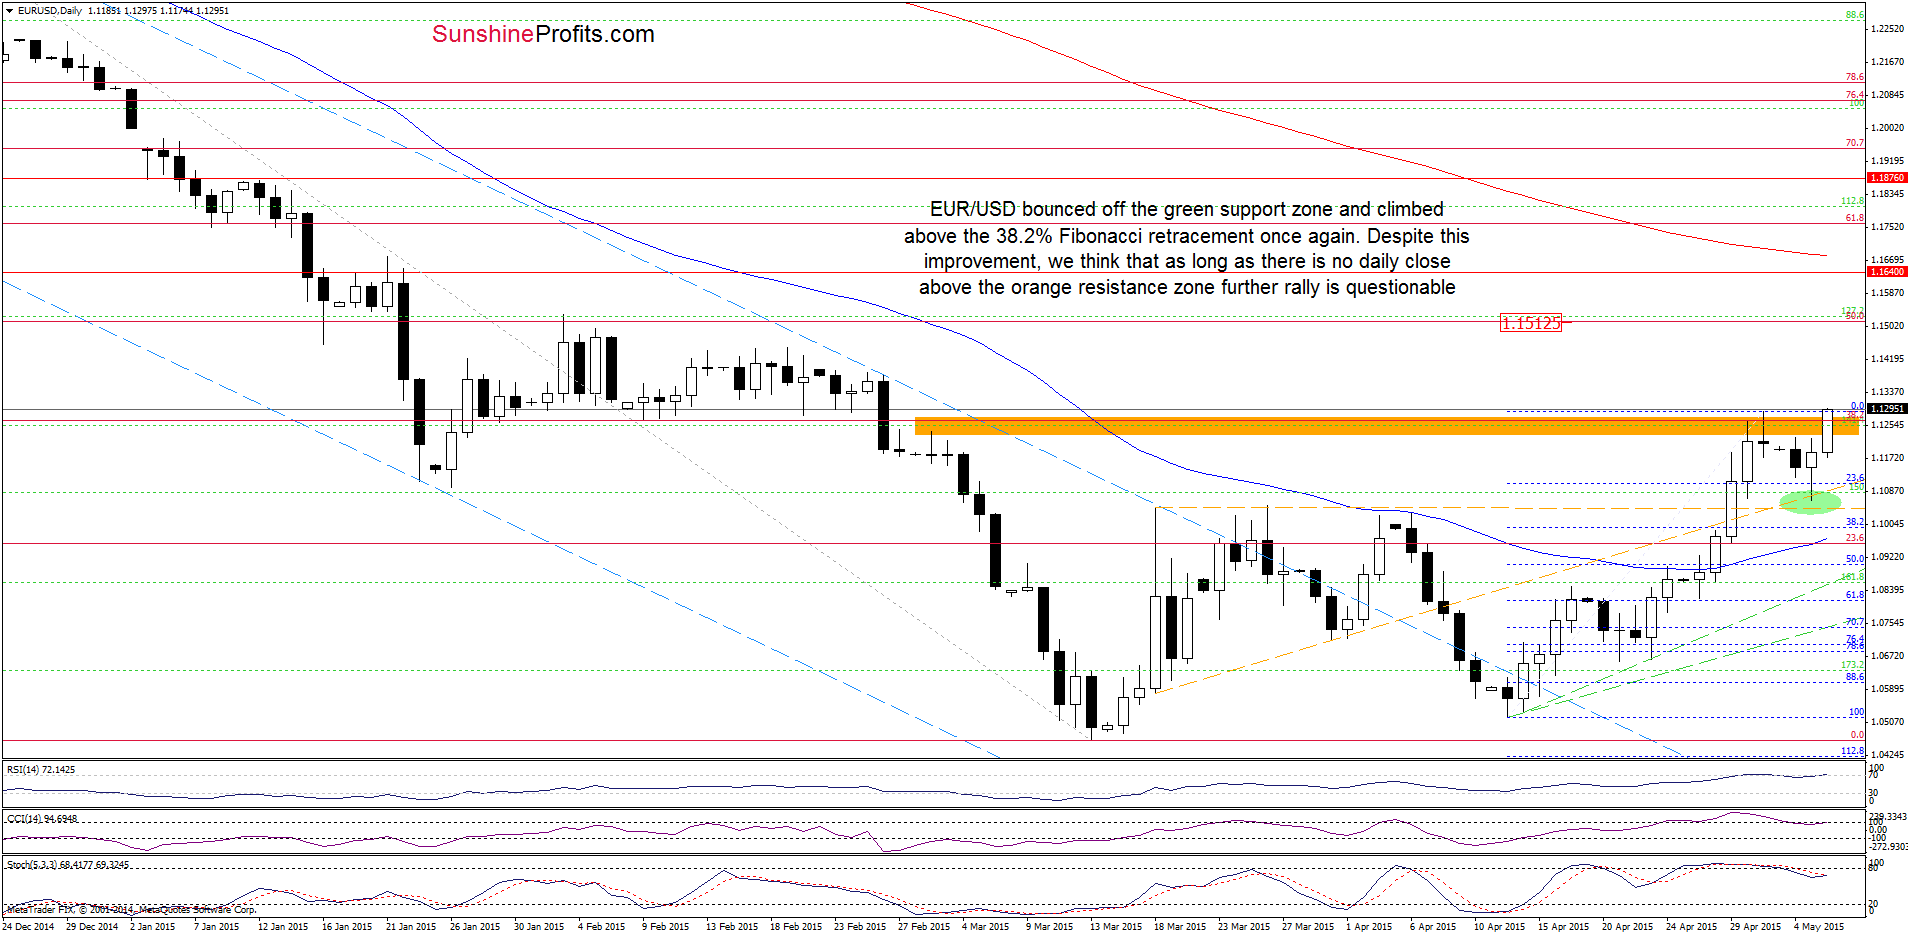
Looking at the daily chart we see that EUR/USD bounced off the green support zone and climbed above the 38.2% Fibonacci retracement once again. This is a bullish signal, which suggests further improvement – especially if the pair breaks above the 23.6% Fibonacci retracement based on the entire May-March decline (marked on the weekly chart) and closes today’s session above the orange resistance zone. If this is the case and we see such price action, the initial upside target would be around 1.1512, where the 50% Fibonacci retracement (marked on the daily chart) is.
Very short-term outlook: bullish
Short-term outlook: mixed
MT outlook: mixed
LT outlook: mixed
Trading position (short-term; our opinion): No positions are justified from the risk/reward perspective at the moment. We will keep you informed should anything change, or should we see a confirmation/invalidation of the above.
USD/JPY
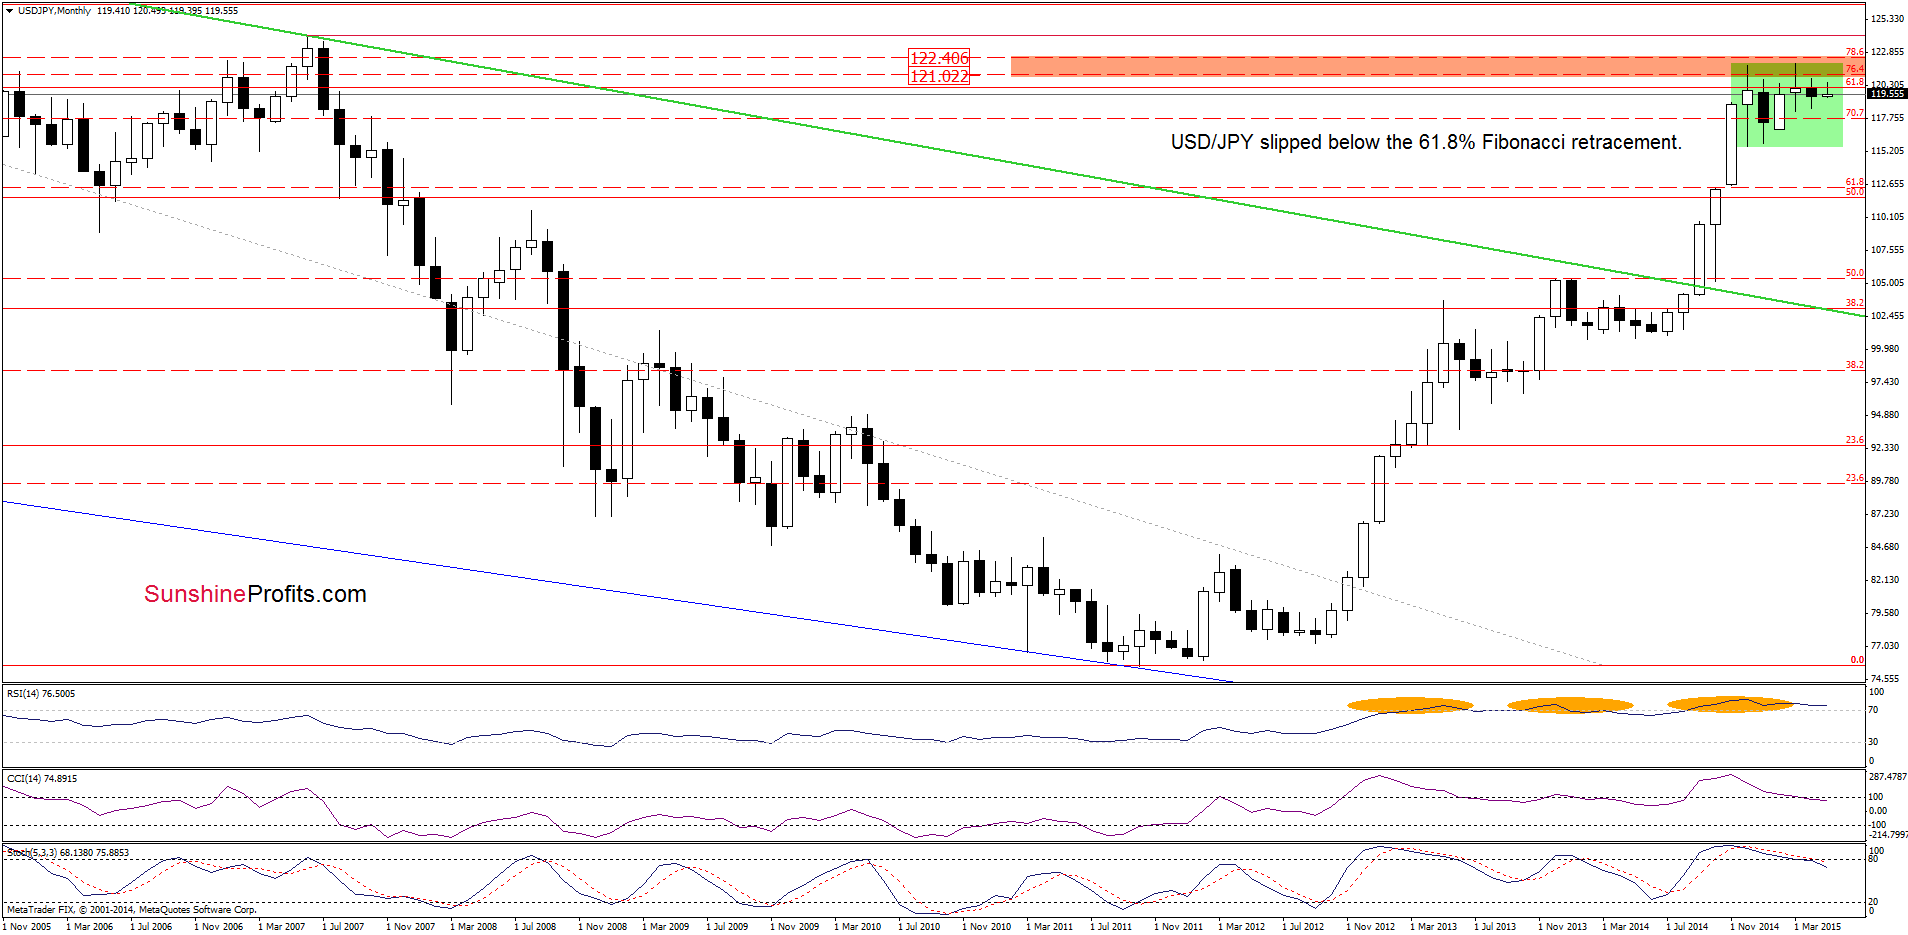
From this perspective we see that USD/JPY slipped under the 61.8% Fibonacci retracement level, which suggests further deterioration.
How did this drop affect the very short-term picture? Let’s check.
In our last commentary on this currency pair, we wrote:
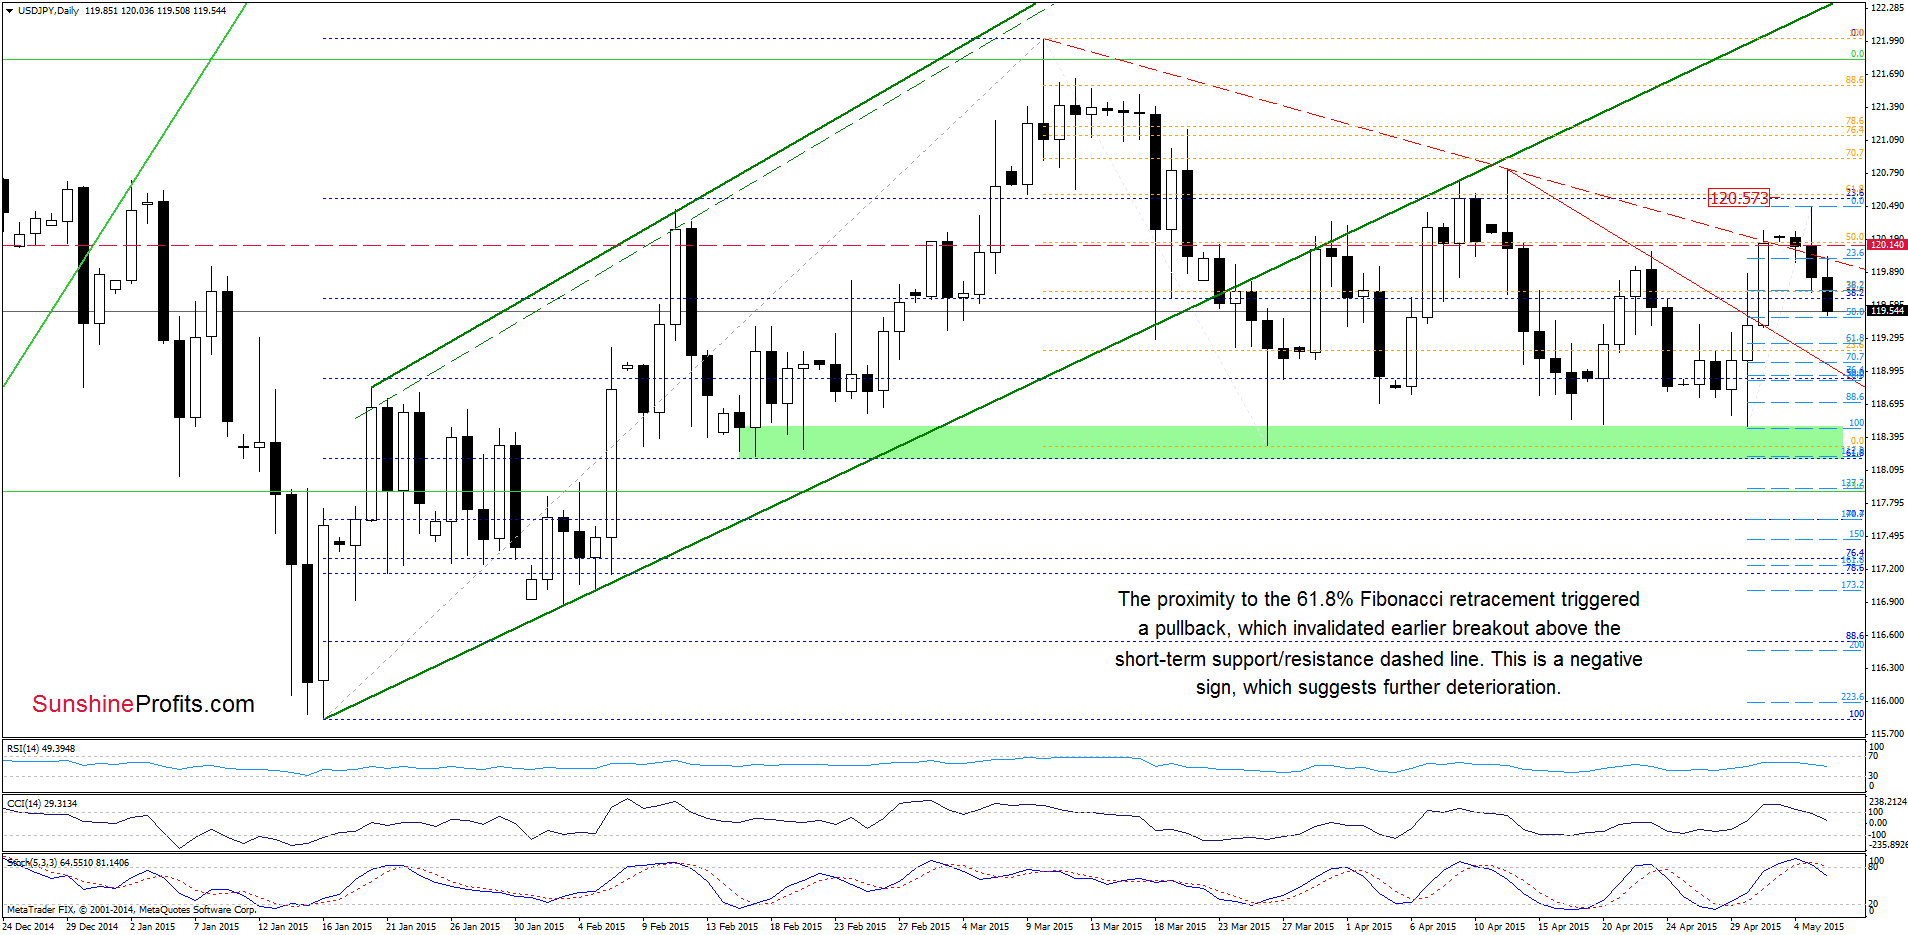
(…) USD/JPY verified earlier breakout above the red declining resistance line (…) and climbed above the 61.8% Fibonacci retracement earlier today. This is a bullish signal, which suggests further improvement in the coming days (nevertheless, we should keep in mind that the CCI and Stochastic Oscillator are overbought, which may translate to sell signals in the coming days). How high could the pair climb? In our opinion, the initial upside target would be around 120.57, where the 61.8% Fibonacci retracement (based on the March declines) is.
As you see on the above chart, the proximity to the 61.8% Fibonacci retracement (based on the March declines) in combination with sell signals generated by the indicators encouraged currency bears to act (as expected). As a result, USD/JPY moved sharply lower and reached the 50% Fibonacci retracement (based on the recent rally) earlier today. Although the pair could rebound from here, we think that the current position of the indicators will trigger further deterioration. If this is the case, the initial downside target would be around 119.24, where the 61.8% retracement is. If it is broken, we might see a drop to the previously-broken red declining line (currently at 119.07), which intersects the 70.7% Fibonacci retracement at the moment.
Very short-term outlook: bearish
Short-term outlook: mixed
MT outlook: mixed
LT outlook: bullish
Trading position (short-term; our opinion): No positions are justified from the risk/reward perspective at the moment. We will keep you informed should anything change, or should we see a confirmation/invalidation of the above.
USD/CHF
On Friday, we wrote the following:
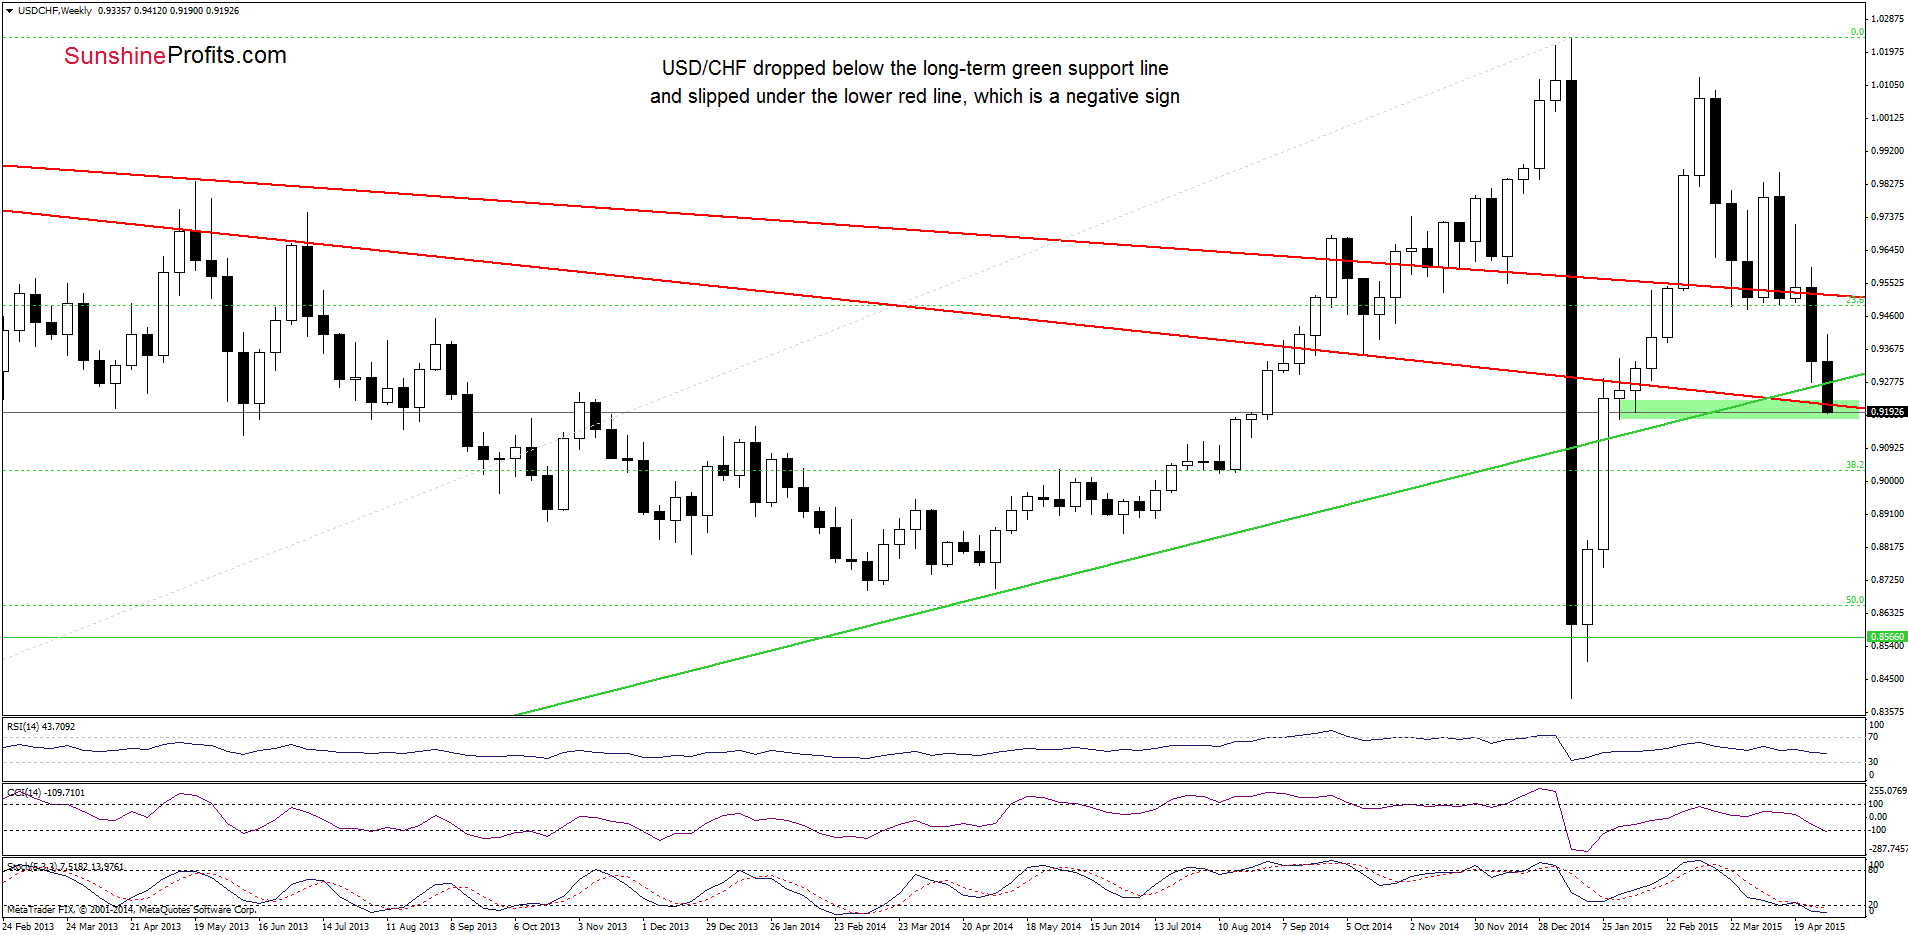
The first thing that catches the eye on the above chart is a breakout below the long-term red support line. This is a bearish signal, which suggests further deterioration and a drop to the green support line (around 0.9263) or even to the lower red line (around 0.9221) in the coming week.
From today’s point of view we see that the situation developed in line with the above scenario and USD/CHF not only reached our downside target, but currency bears managed to push the pair below it. This is a negative signal, which suggests that lower values of the exchange rate are still ahead us.
How low could the pair go? Let’s examine the daily chart and find out.
In our last commentary on this currency pair, we wrote:
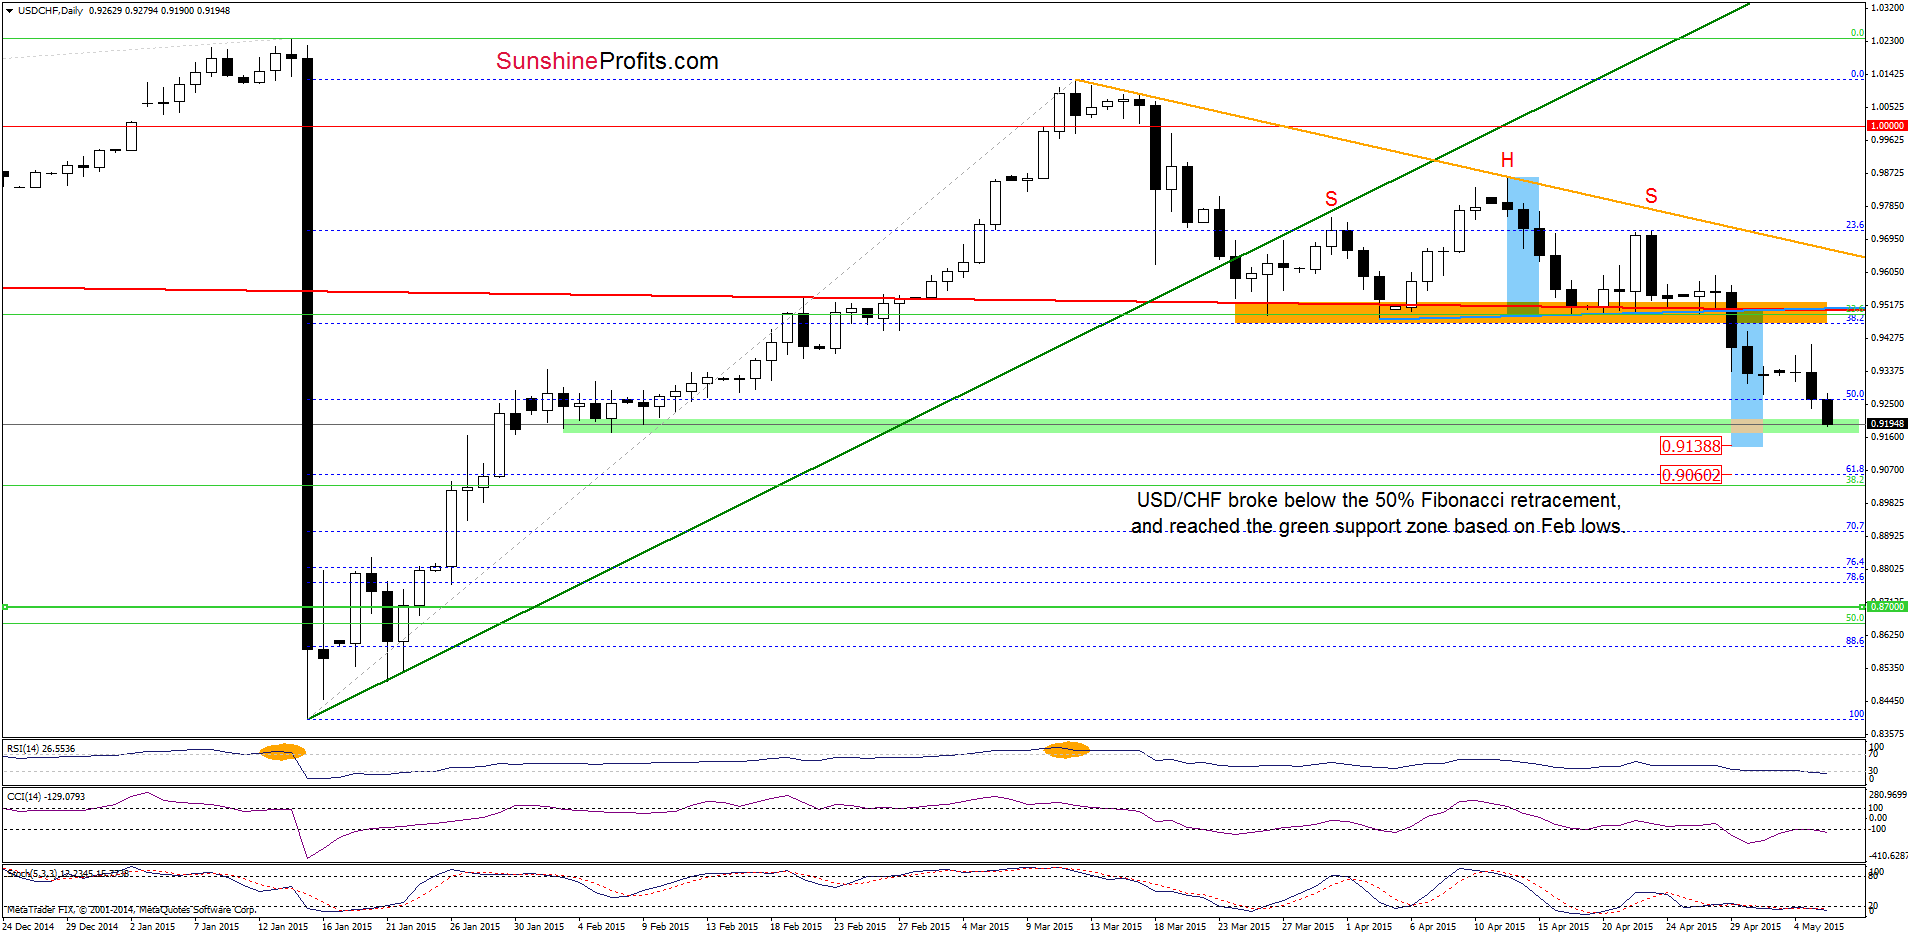
(…) USD/CHF broke below the long-term red support line, which triggered a sharp decline. With this downswing, the pair also dropped under the neck line of the head and shoulders formation (marked with blue) which suggests further deterioration and a pullback to around 0.9168, where the Feb lows are (nevertheless, we could also see a decline to 0.9138, where the size of the downward move will correspond to the height of the formation).
Looking at the above chart, we see that USD/CHF reached our initial downside target earlier today. Although the pair could rebound from here, we think that the breakdown below the long-term red line (marked on the weekly chart) will encourage currency bears to act and result in a drop to 0.9138, where the size of the downward move will correspond to the height of the formation. At this point it is worth noting that if this area doesn’t stop declines, we might see a drop even to 0.9060, where the 61.8% Fibonacci retracement is.
Very short-term outlook: bearish
Short-term outlook: mixed
MT outlook: mixed
LT outlook: bearish
Trading position (short-term; our opinion): No positions are justified from the risk/reward perspective at the moment. We will keep you informed should anything change, or should we see a confirmation/invalidation of the above.
Thank you.
Nadia Simmons
Forex & Oil Trading Strategist
Przemyslaw Radomski, CFA
Founder, Editor-in-chief
Gold & Silver Trading Alerts
Forex Trading Alerts
Oil Investment Updates
Oil Trading Alerts

