

Earlier today, EUR/USD extended losses after data showed that Germany’s manufacturing index slipped to 52.1, while the final reading of Markit’s manufacturing PMI declined to 52.0 from March's 10-month high of 52.2. These disappointing numbers pushed EUR/USD below 1.1200, but will we see further deterioration in the coming week?
In our opinion the following forex trading positions are justified - summary:
EUR/USD
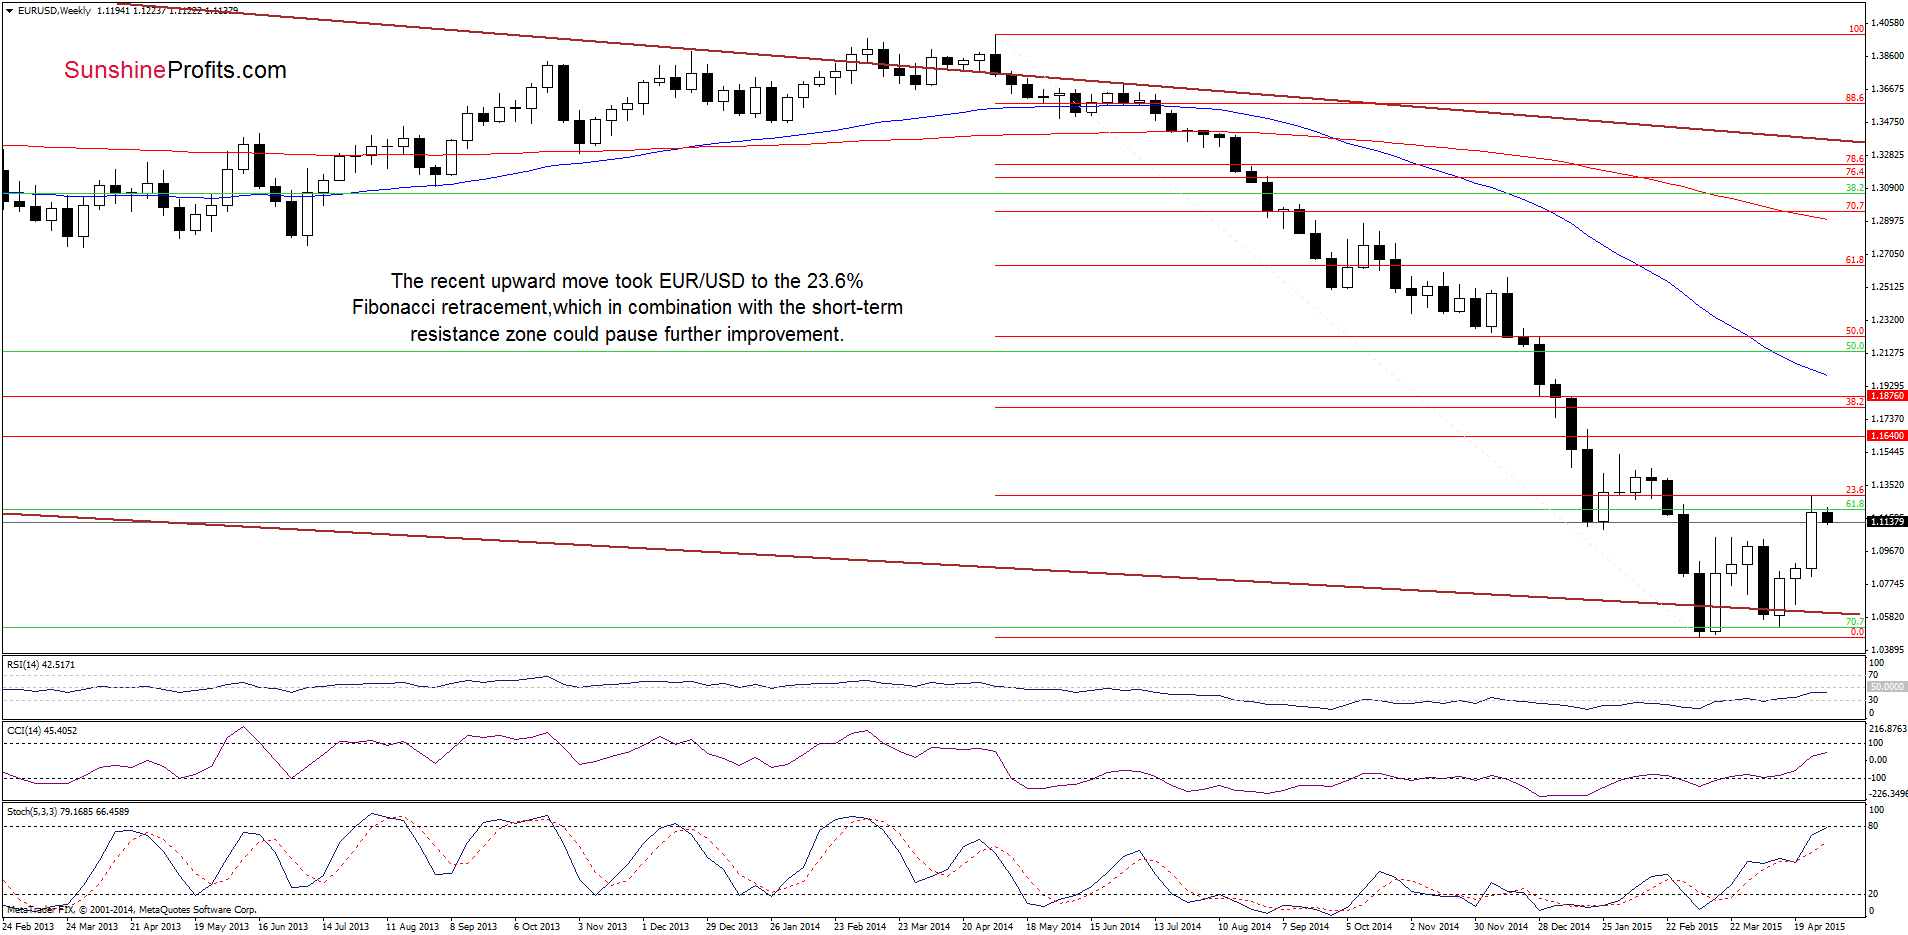
Looking at the weekly chart, we see that EUR/USD climbed to the 23.6% Fibonacci retracement based on the entire May-March decline in the previous week. As you see on the char, this resistance, in combination with the previously-broken 61.8% Fibonacci retracement, paused further rally, triggering a pullback.
How low could the exchange rate go in the coming week? Let’s take a closer look at the very short-term picture and find out.
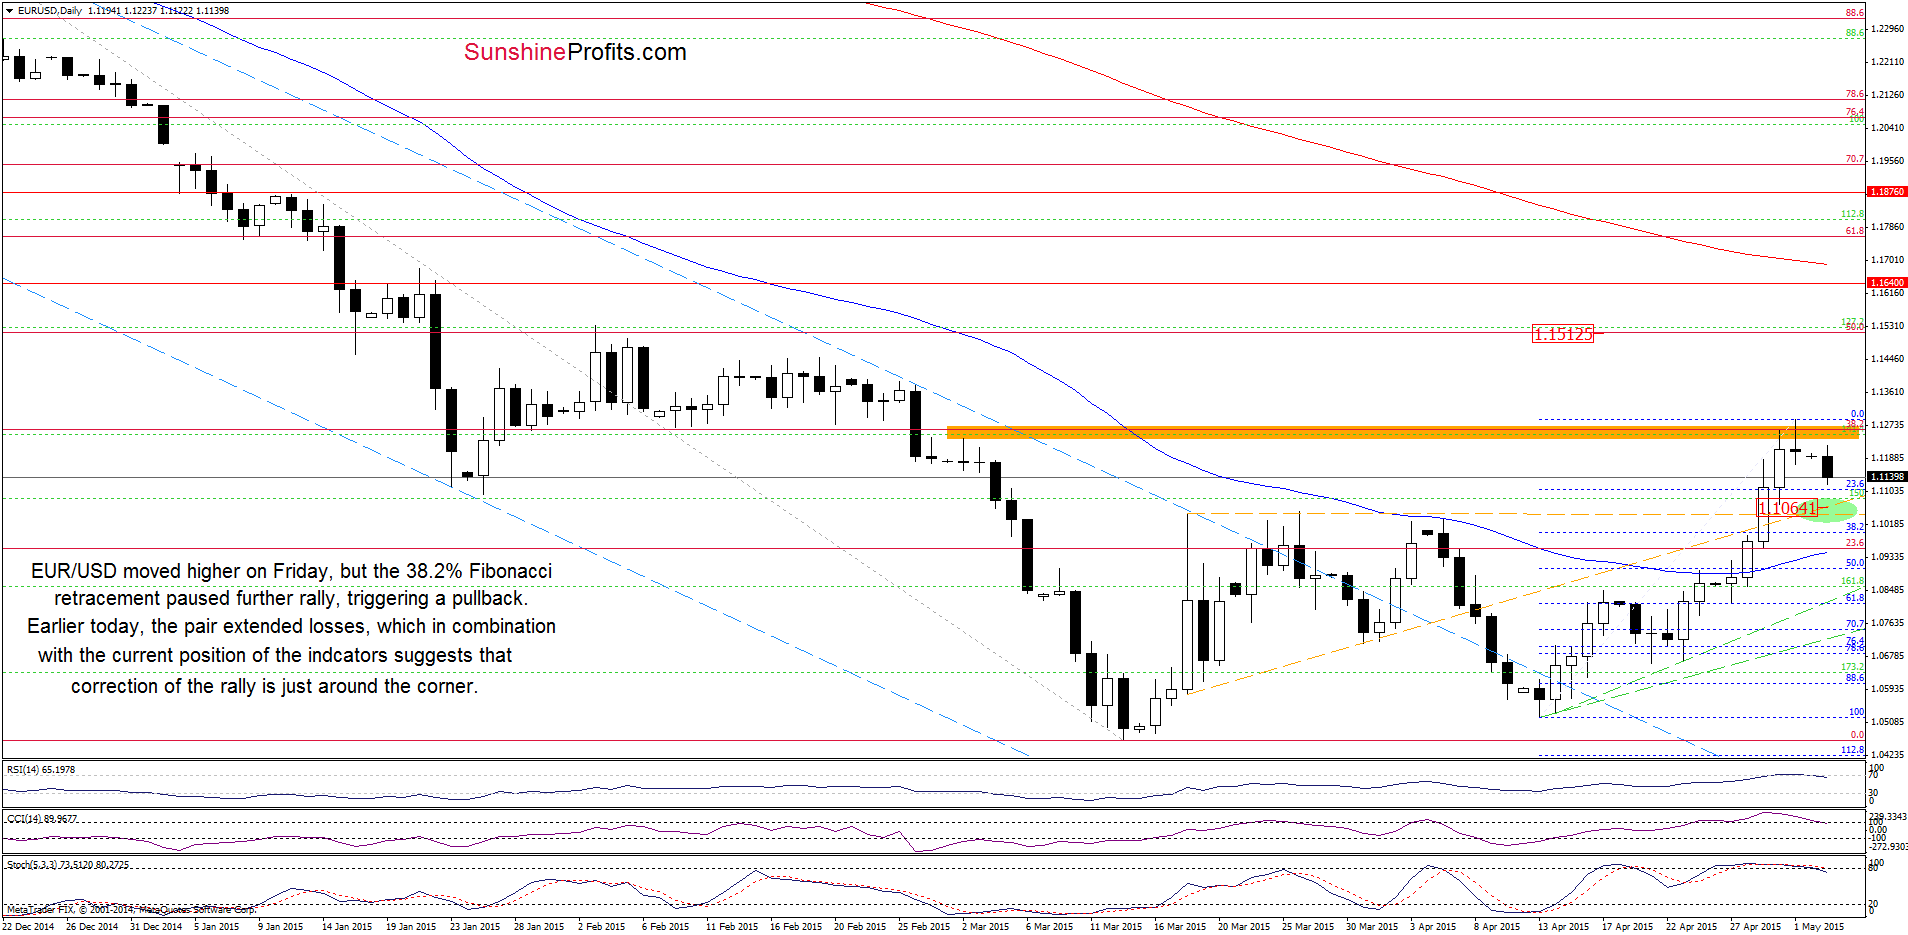
From this perspective, we see that EUR/USD moved higher on Friday, but the 38.2% Fibonacci retracement level paused further improvement and triggered a pullback. Earlier today, the pair extended losses, which in combination with the medium-term picture and the current position of the indicators suggests that correction of the recent rally is just around the corner. If this is the case, the initial downside target would be around 1.1051-1.1064, where the previously-broken orange support/resistance lines are. If they are broken, we might see a decline to 1.0993 (the 38.2% Fibonacci retracement based on the recent rally), 1.0906 (the 50% retracement) or even to 1.0816, where the 61.8% Fibonacci retracement is.
Very short-term outlook: mixed with bearish bias
Short-term outlook: mixed
MT outlook: mixed
LT outlook: mixed
Trading position (short-term; our opinion): No positions are justified from the risk/reward perspective at the moment. We will keep you informed should anything change, or should we see a confirmation/invalidation of the above.
GBP/USD
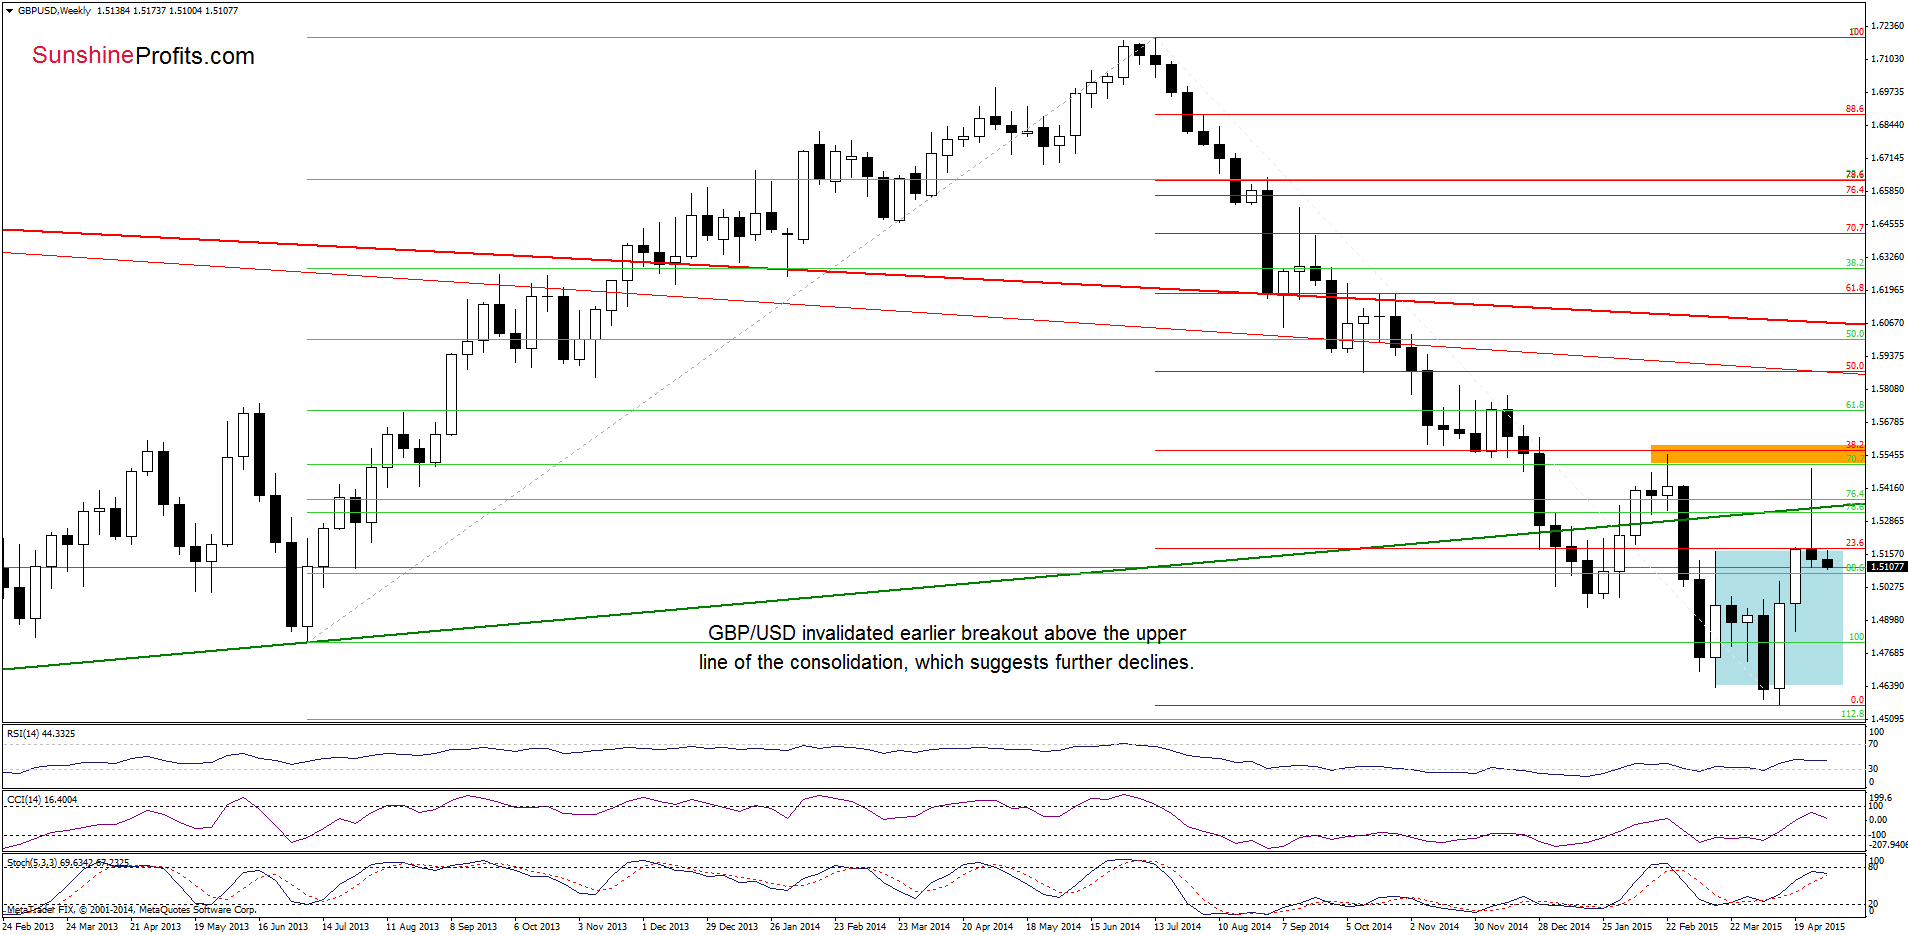
As you see on the weekly chart GBP/USD closed the previous week below the long-term support line and the upper line of the consolidation, which is a negative signal that suggests further declines.
Having said that, let’s examine the daily chart and find out how this decline affected the very short-term picture.
On Friday, we wrote the following:
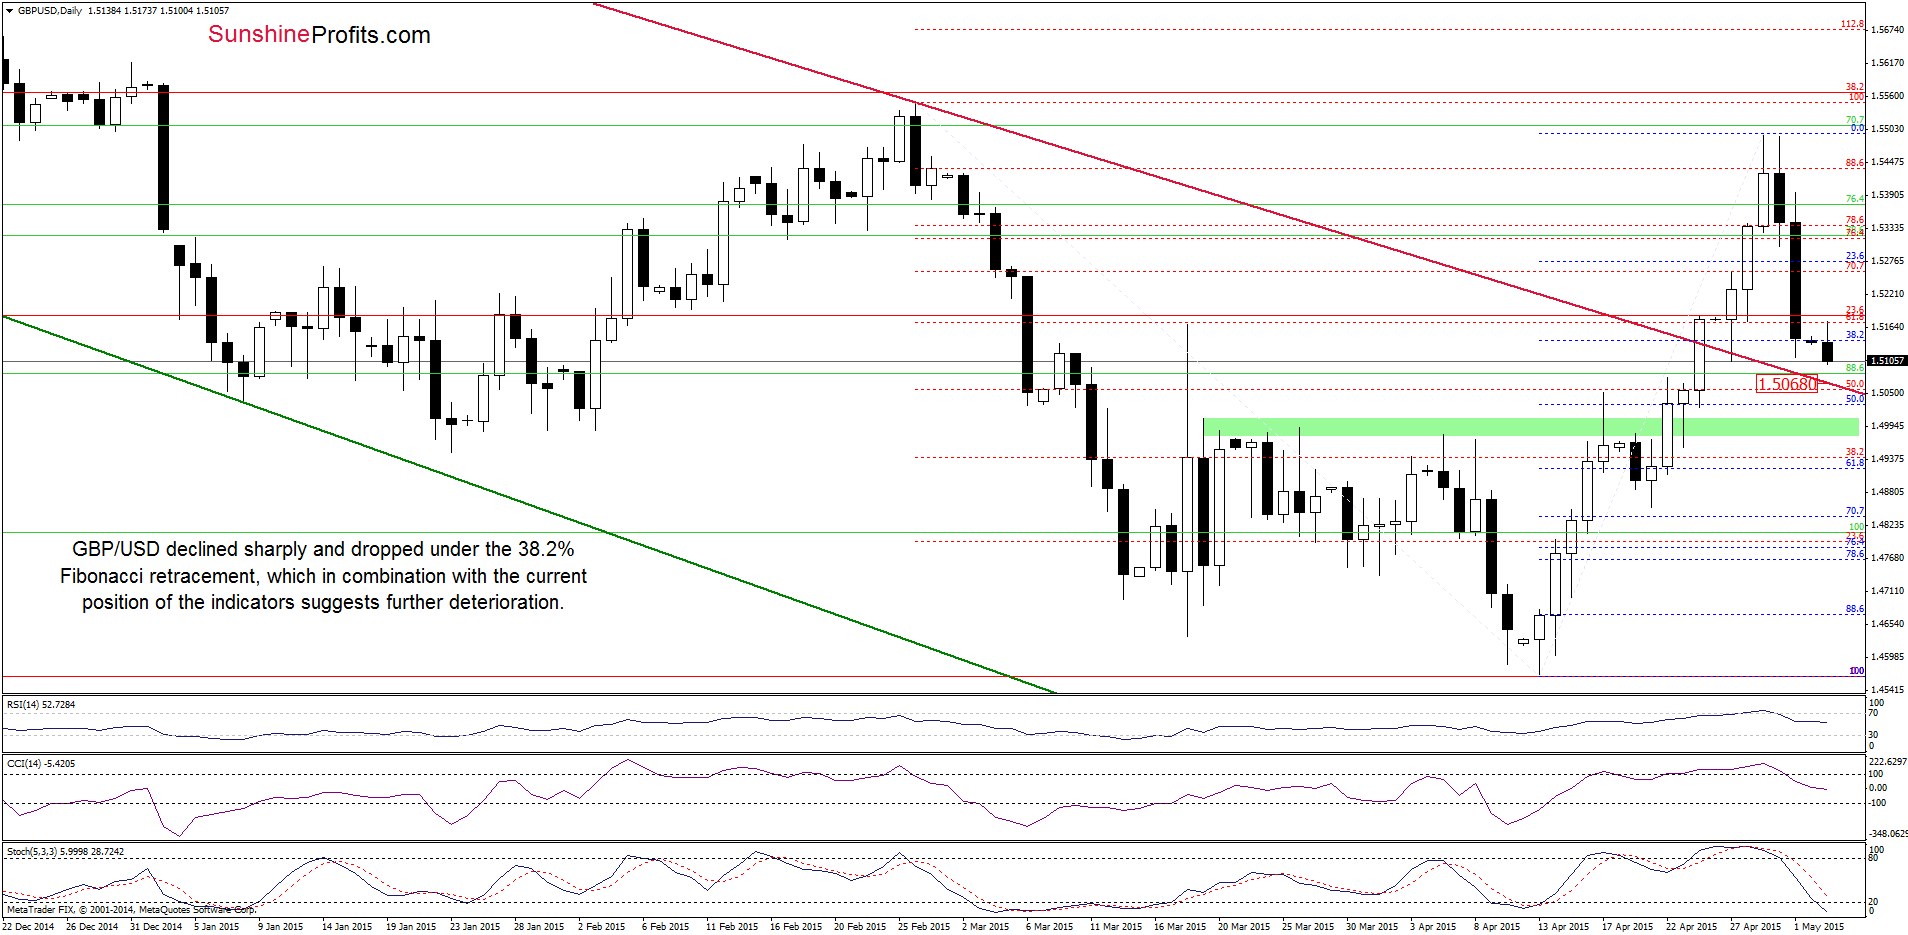
(…) GBP/USD reversed, invalidating earlier breakout above the 88.6% Fibonacci retracement. This negative signal triggered further deterioraion, which in combination with sell signals generated by the indicators suggests lower values of the exchange rtae. If this is the case, and GBP/USD moves drops from here, the initial downside target would be around 1.5140, where the 38.2% Fibonacci retracement based on the recent rally is.
On the above chart, we see that currency bears pushed GBP/USD lower as we expected. Friday’s downswing took the pair to our initial downside target, but taking into account sell signals generated by the indicators, we think that the exchange rate will test the strength of the previously-broken long-term declining crimson line (currently around 1.5068) in the coming day(s). If it is broken, we might see a decline to 1.5030 (the 50% Fibonacci retracement) or even to the green support zone (around 1.4980-1.5008) in the coming week.
Very short-term outlook: bearish
Short-term outlook: mixed
MT outlook: mixed
LT outlook: mixed
Trading position (short-term; our opinion): No positions are justified from the risk/reward perspective at the moment. We will keep you informed should anything change, or should we see a confirmation/invalidation of the above.
USD/JPY
In our last commentary on this currency pair, we wrote:
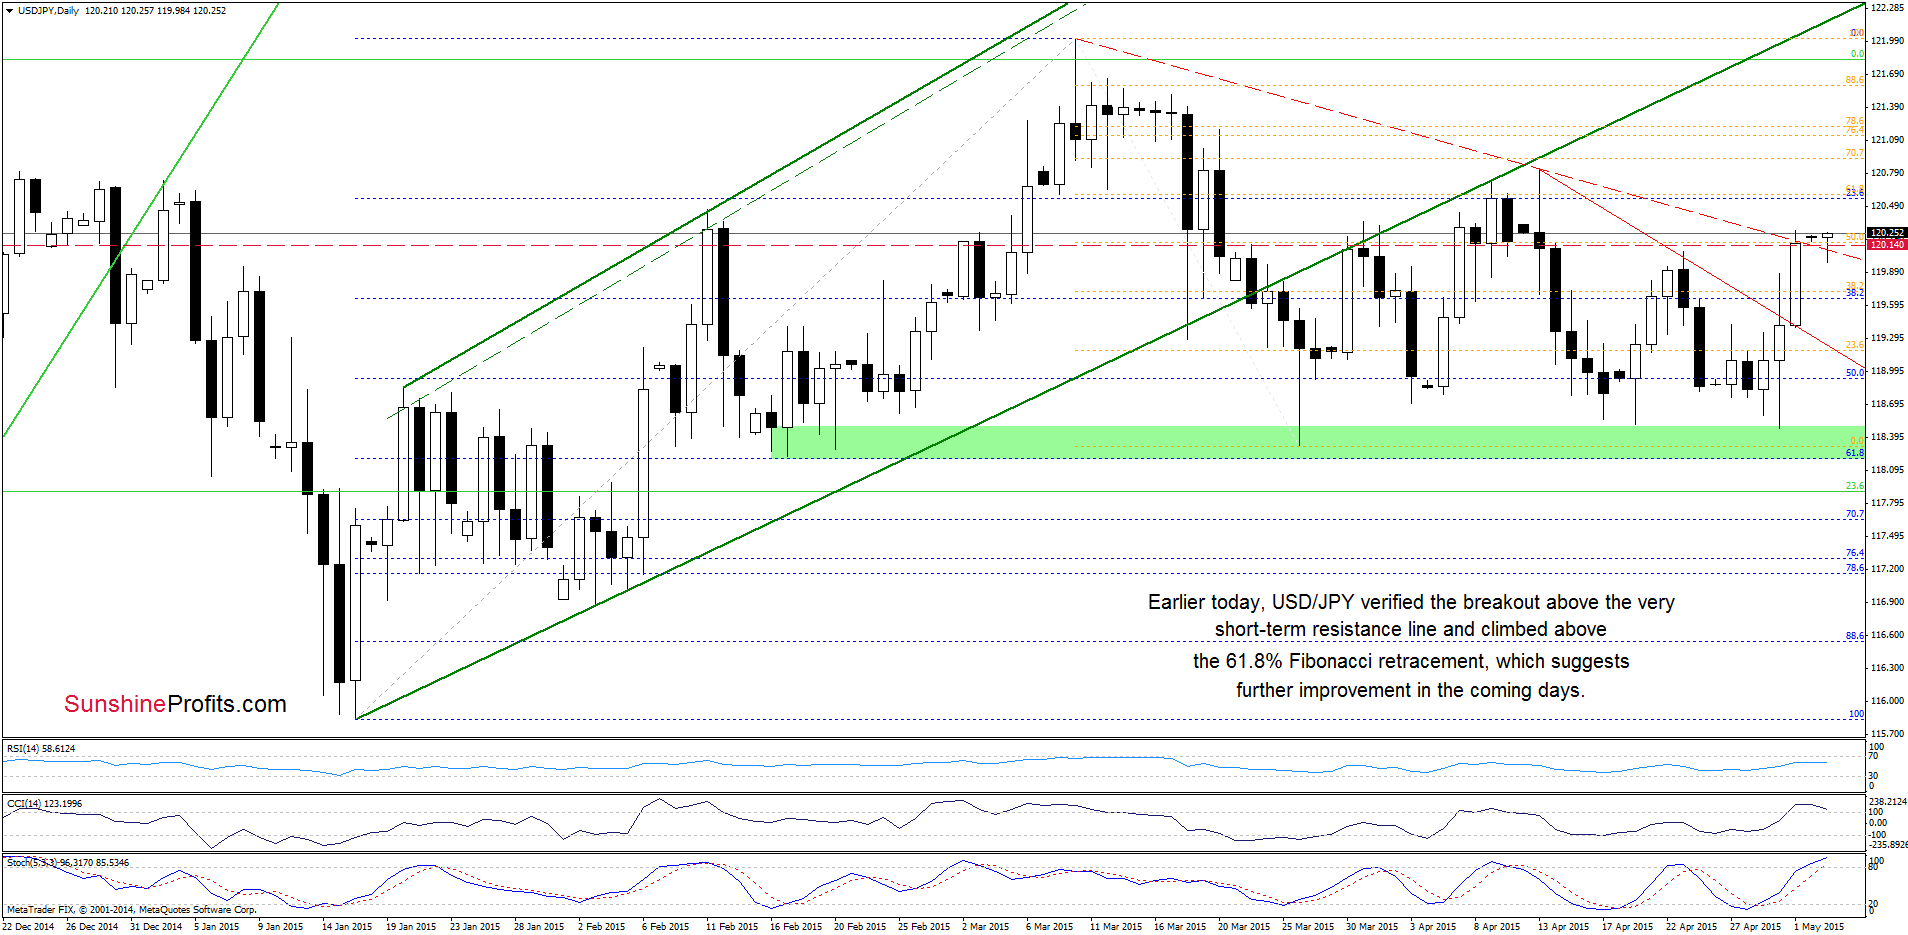
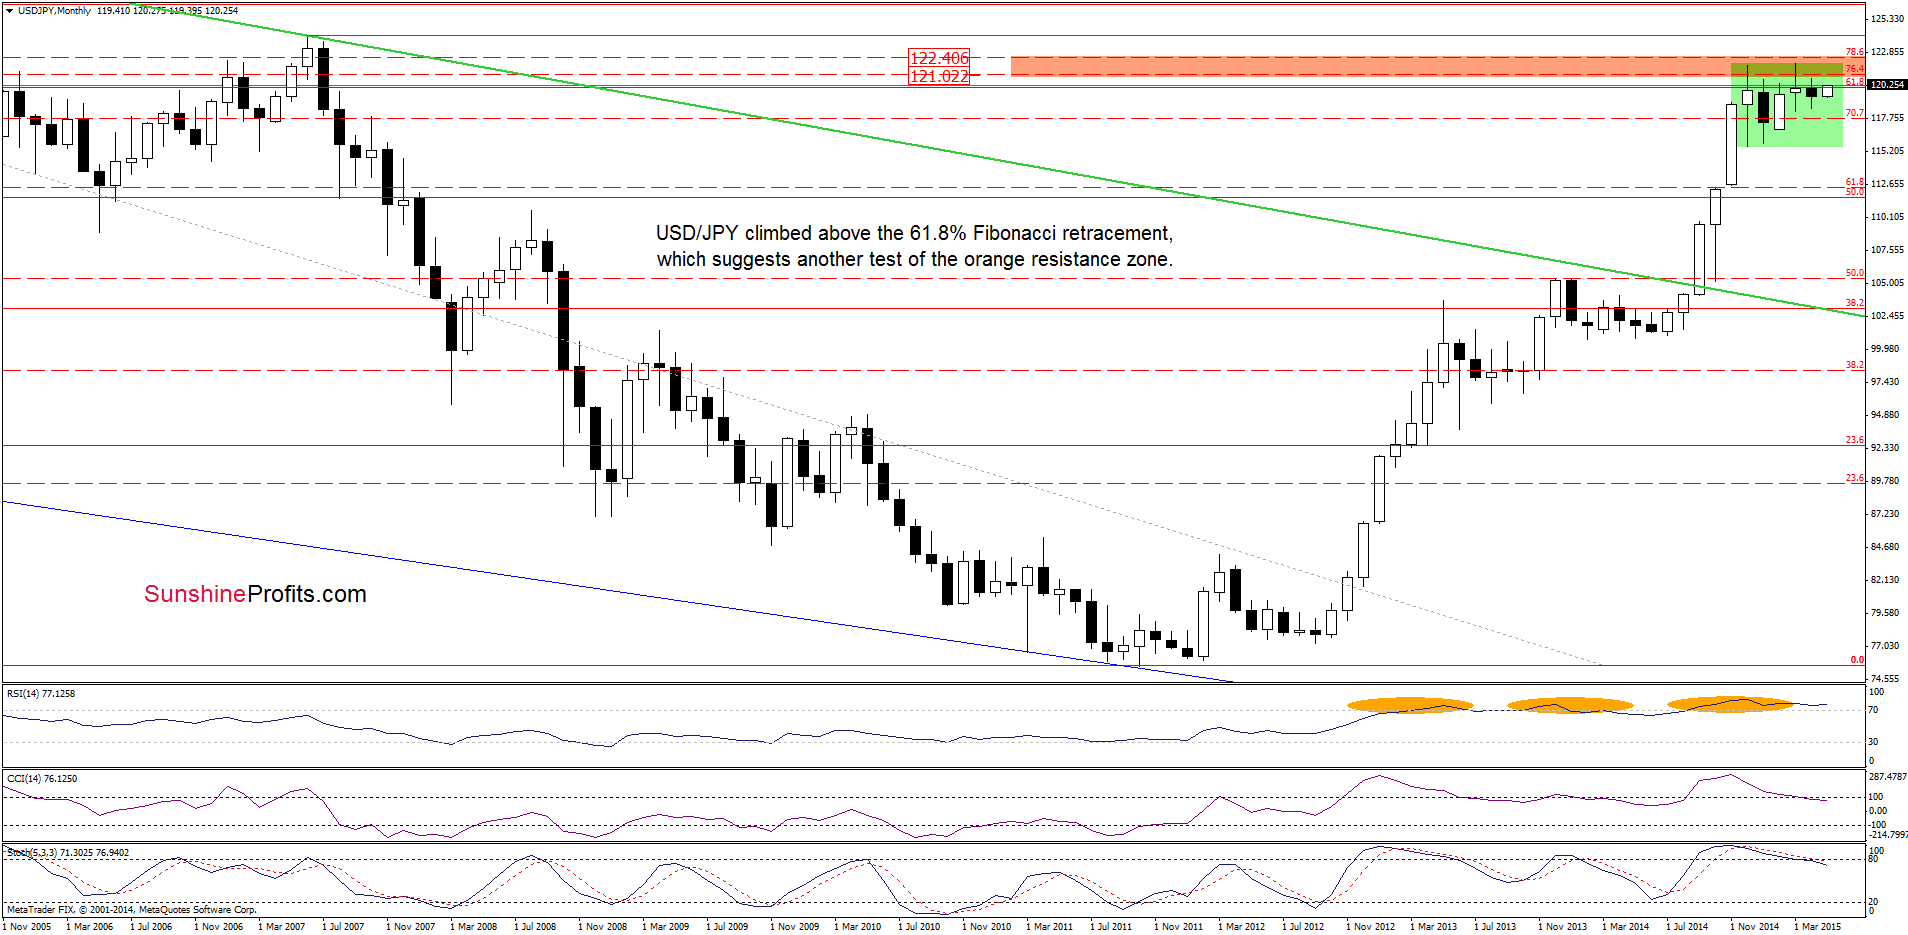
(…) USD/JPY broke above the very short-term resistance line as we expected. This is a bullish sign, which in combination with buy signals suggests further improvement. If this is the case, the upside target would be around 120.14, where the 61.8% Fibonacci retracement (marked on the monthly chart) is (in this area is also the red declining resistance line based on the March and Apr highs, which serves as an additional resistance).
From today’s point of view, we see that USD/JPY verified earlier breakout above the red declining resistance line based on the March and Apr highs and climbed above the 61.8% Fibonacci retracement earlier today. This is a bullish signal, which suggests further improvement in the coming days (nevertheless, we should keep in mind that the CCI and Stochastic Oscillator are overbought, which may translate to sell signals in the coming days).
How high could the pair climb? In our opinion, the initial upside target would be around 120.57, where the 61.8% Fibonacci retracement (based on the March declines) is. However, if it s broken, currency bulls might push the exchange rate to around 121-122.40, where the orange resistance zone (marked on the monthly chart below) is.
Very short-term outlook: bullish
Short-term outlook: mixed
MT outlook: mixed
LT outlook: bullish
Trading position (short-term; our opinion): No positions are justified from the risk/reward perspective at the moment. We will keep you informed should anything change, or should we see a confirmation/invalidation of the above.
Thank you.
Nadia Simmons
Forex & Oil Trading Strategist
Przemyslaw Radomski, CFA
Founder, Editor-in-chief
Gold & Silver Trading Alerts
Forex Trading Alerts
Oil Investment Updates
Oil Trading Alerts

