

Although the USD Index bounced off session’s lows and came back above 95 after yesterday’s positive job data, this improvement was only temporary and the index moved lower in the following hours. How did this move affect major currency pairs?
In our opinion the following forex trading positions are justified - summary:
EUR/USD
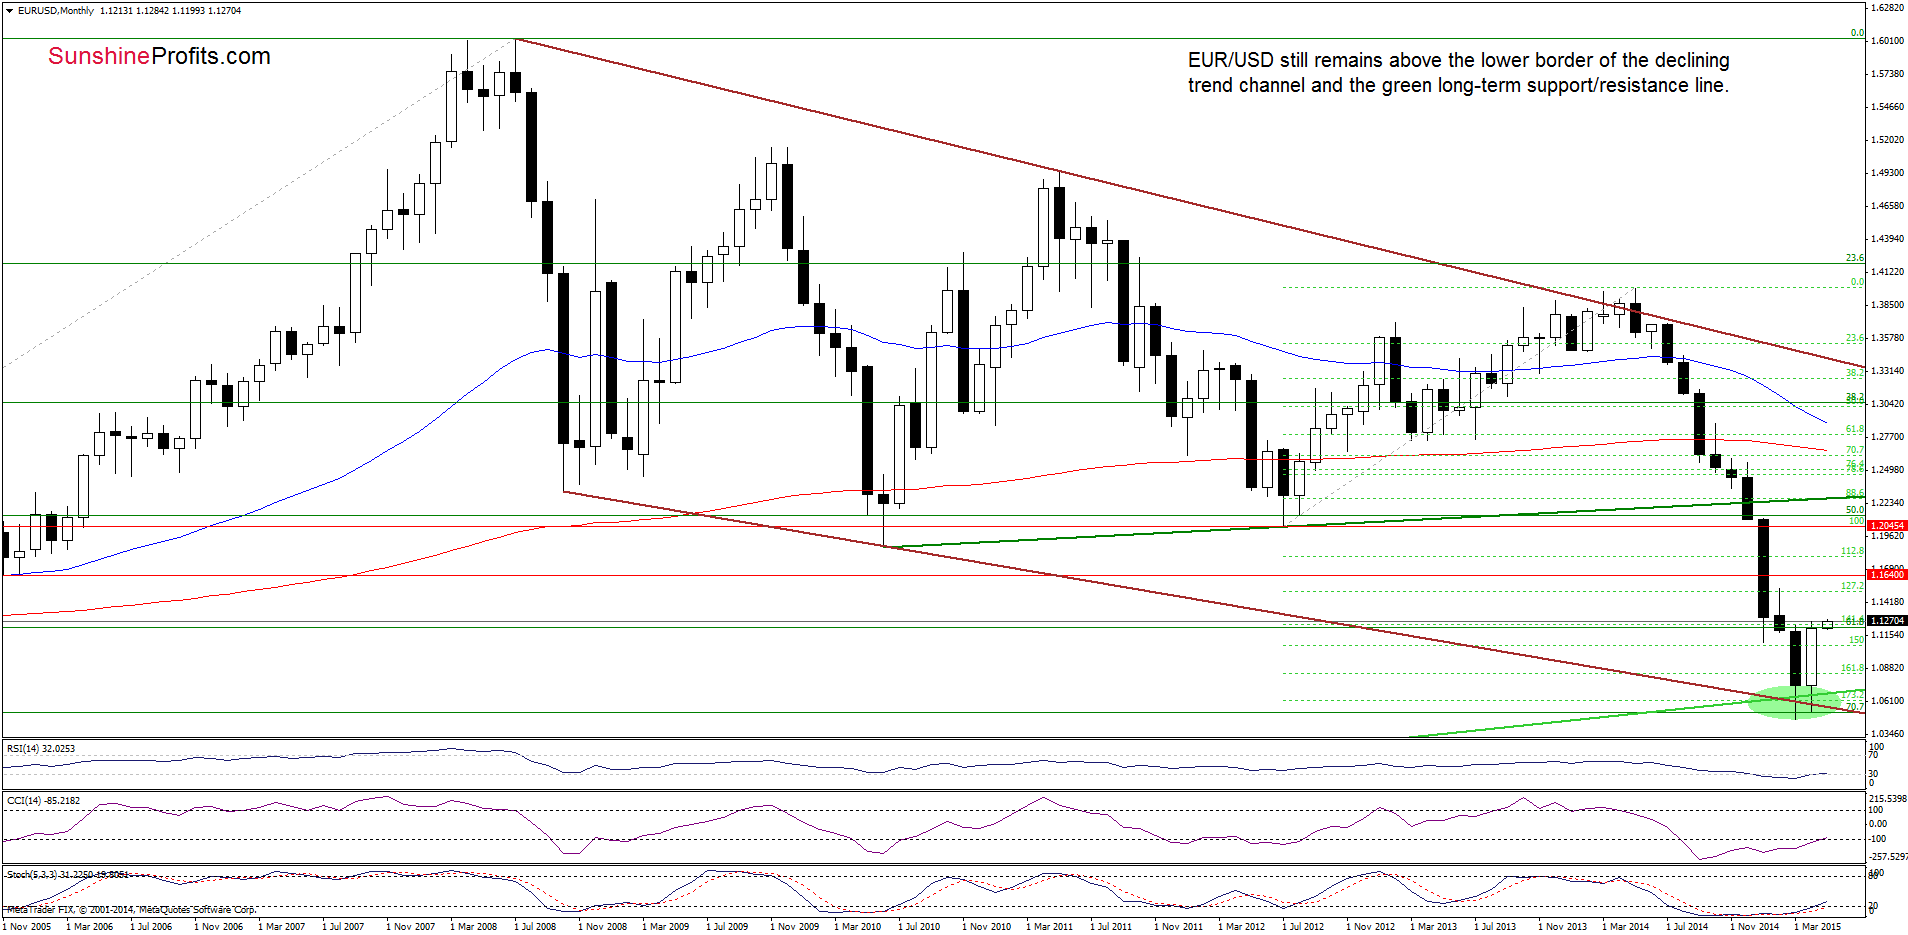
The situation in the medium term hasn’t changed much as EUR/USD is still trading around the March high and the previously-broken 61.8% Fibonacci retracement, which together could pause further rally.
Having said that, let’s take a closer look at the very short-term picture.
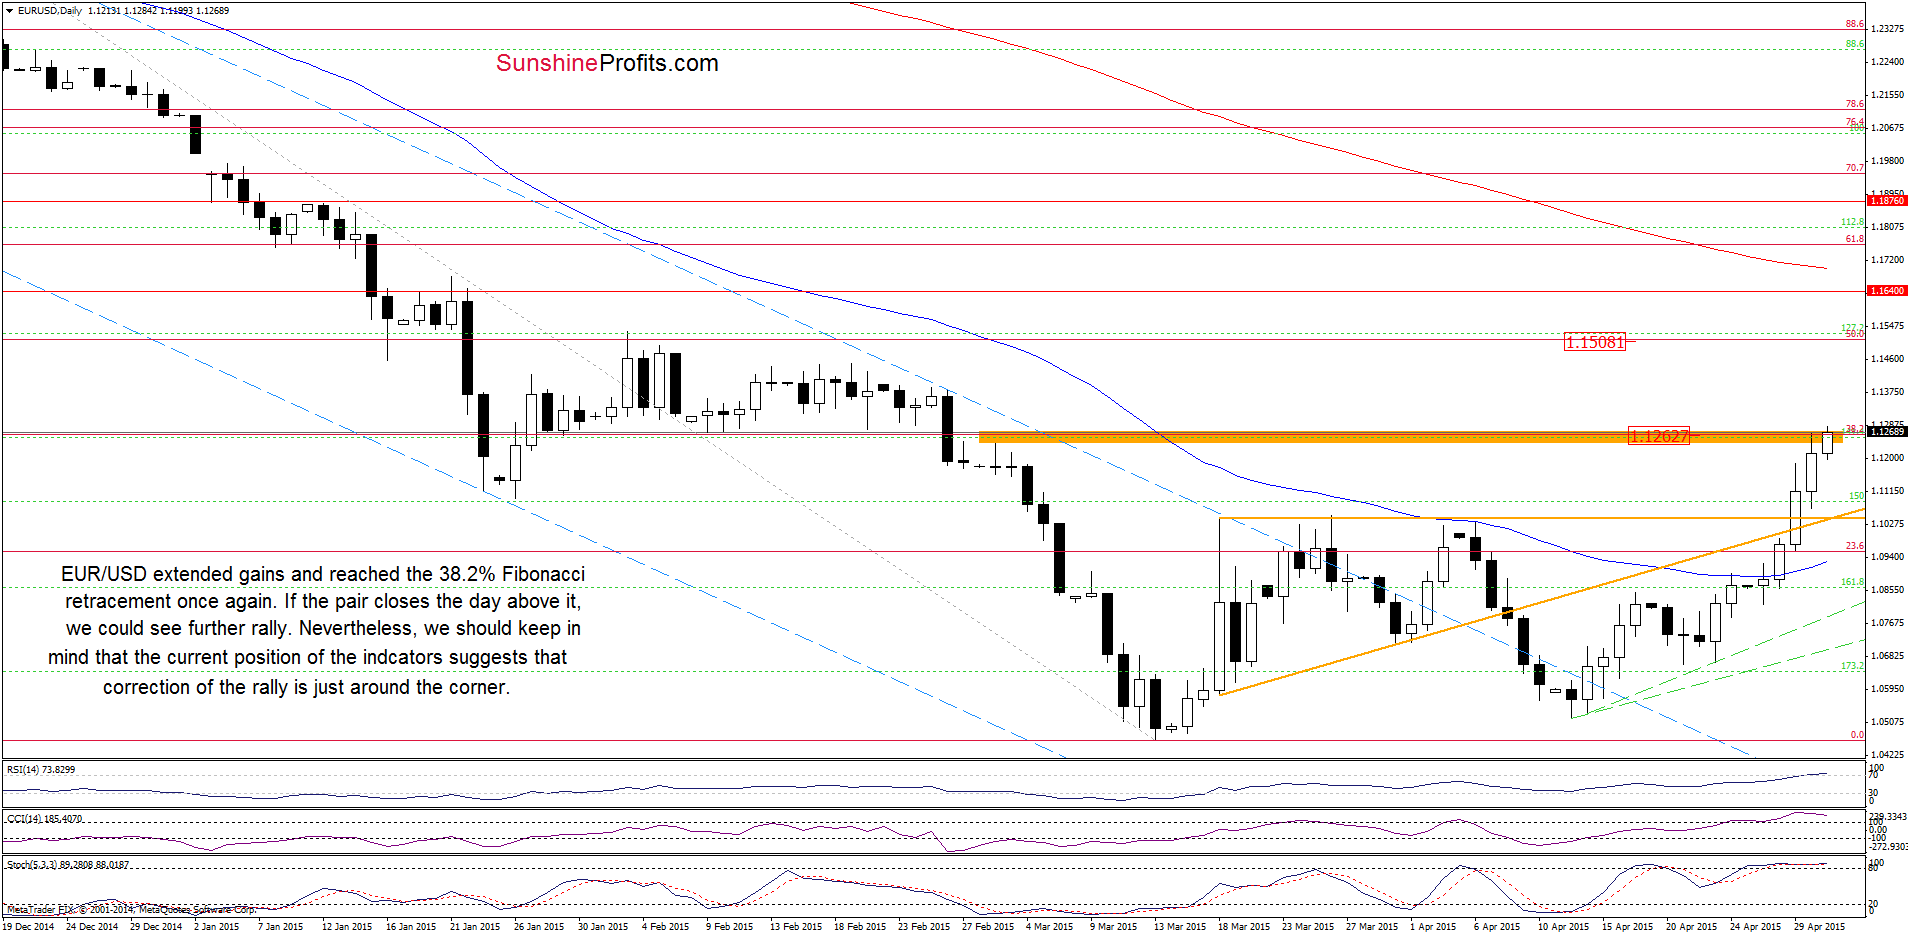
Looking at the daily chart, we see that currency bulls pushed EUR/USD higher once again, which resulted in an increase to the 38.2% Fibonacci retracement level. In our opinion, if the pair closes the day above it, we could see further improvement and an increase even to around 1.1510, where the next Fibonacci retracement is. Nevertheless, we should keep in mind that the current position of the indicators suggests that correction of the recent rally is just around the corner. If this is the case, the initial downside target would be around 1.1050, where the previously-broken orange support/resistance lines are.
Very short-term outlook: mixed
Short-term outlook: mixed
MT outlook: mixed
LT outlook: mixed
Trading position (short-term; our opinion): No positions are justified from the risk/reward perspective at the moment. We will keep you informed should anything change, or should we see a confirmation/invalidation of the above.
GBP/USD
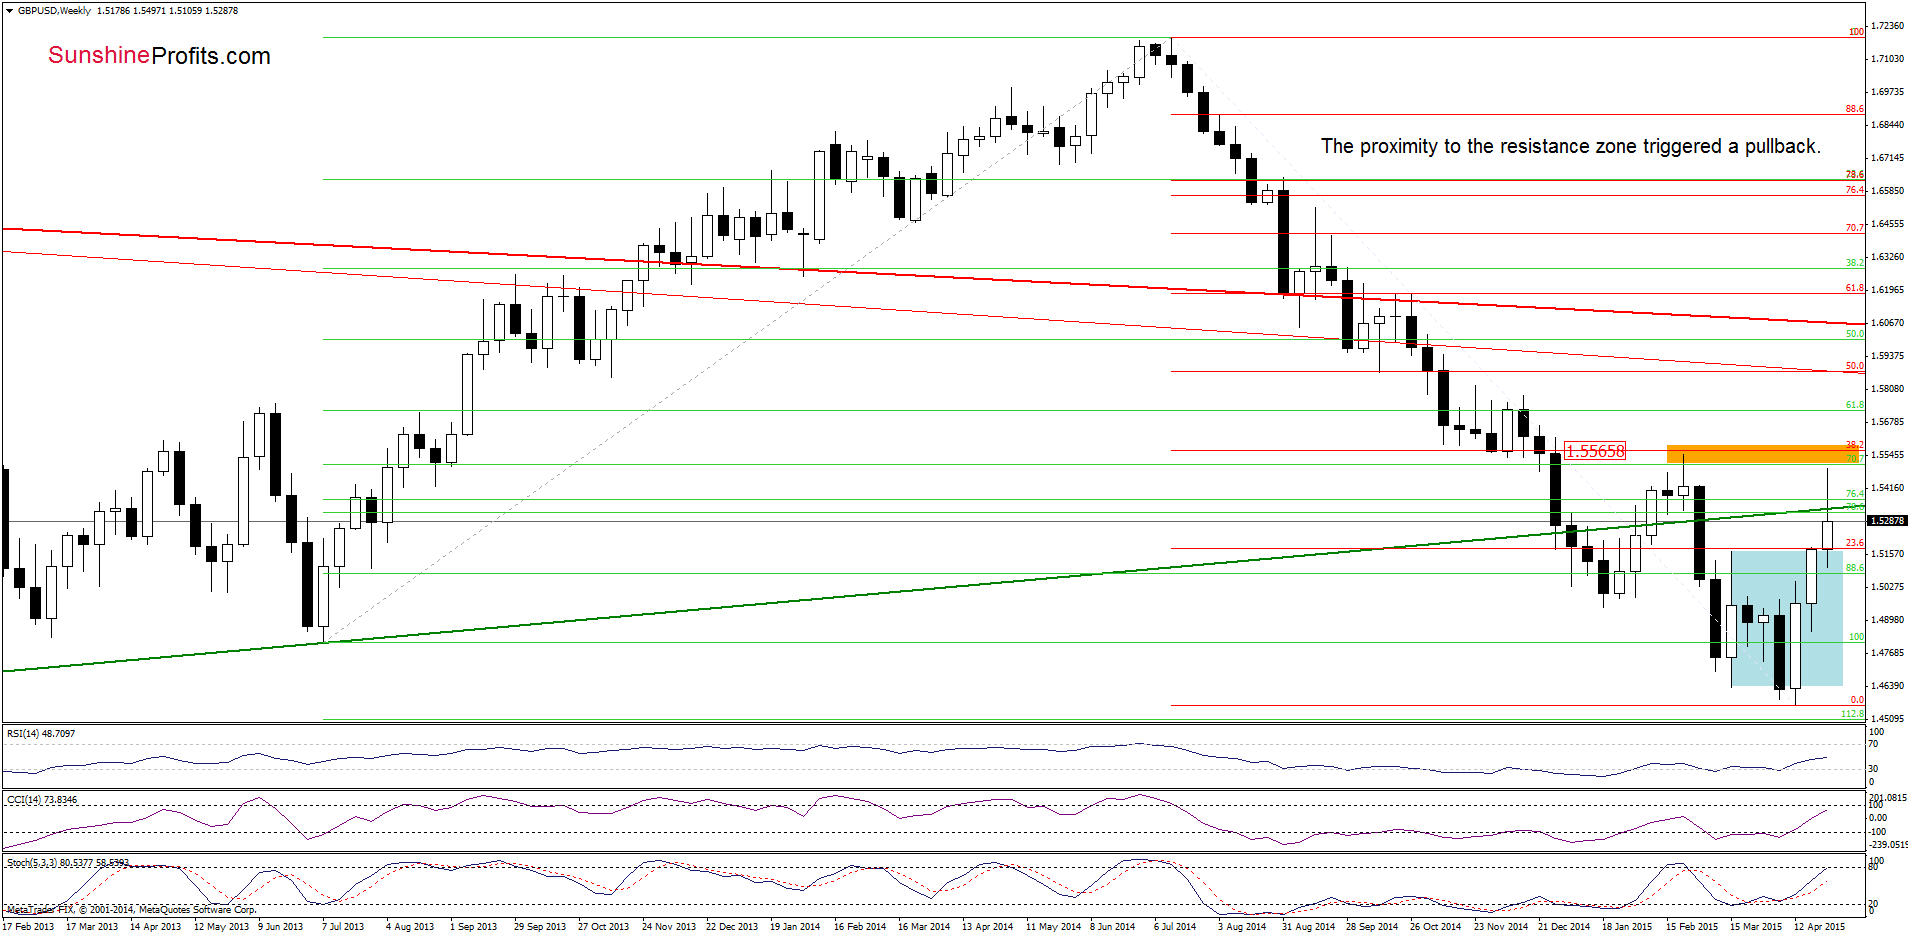
As you see on the weekly chart the proximity to the orange resistance zone created by the Feb high and the 38.2% Fibonacci retracement (based on the entire Jul-Apr declines) encouraged currency bears to act and resulted in a pullback, which took the exchange rate below the previously-broken long-term support line, which s a negative signal.
How did this decline affect the very short-term picture? Let’s examine the daily chart and find out.
On Wednesday, we wrote the following:
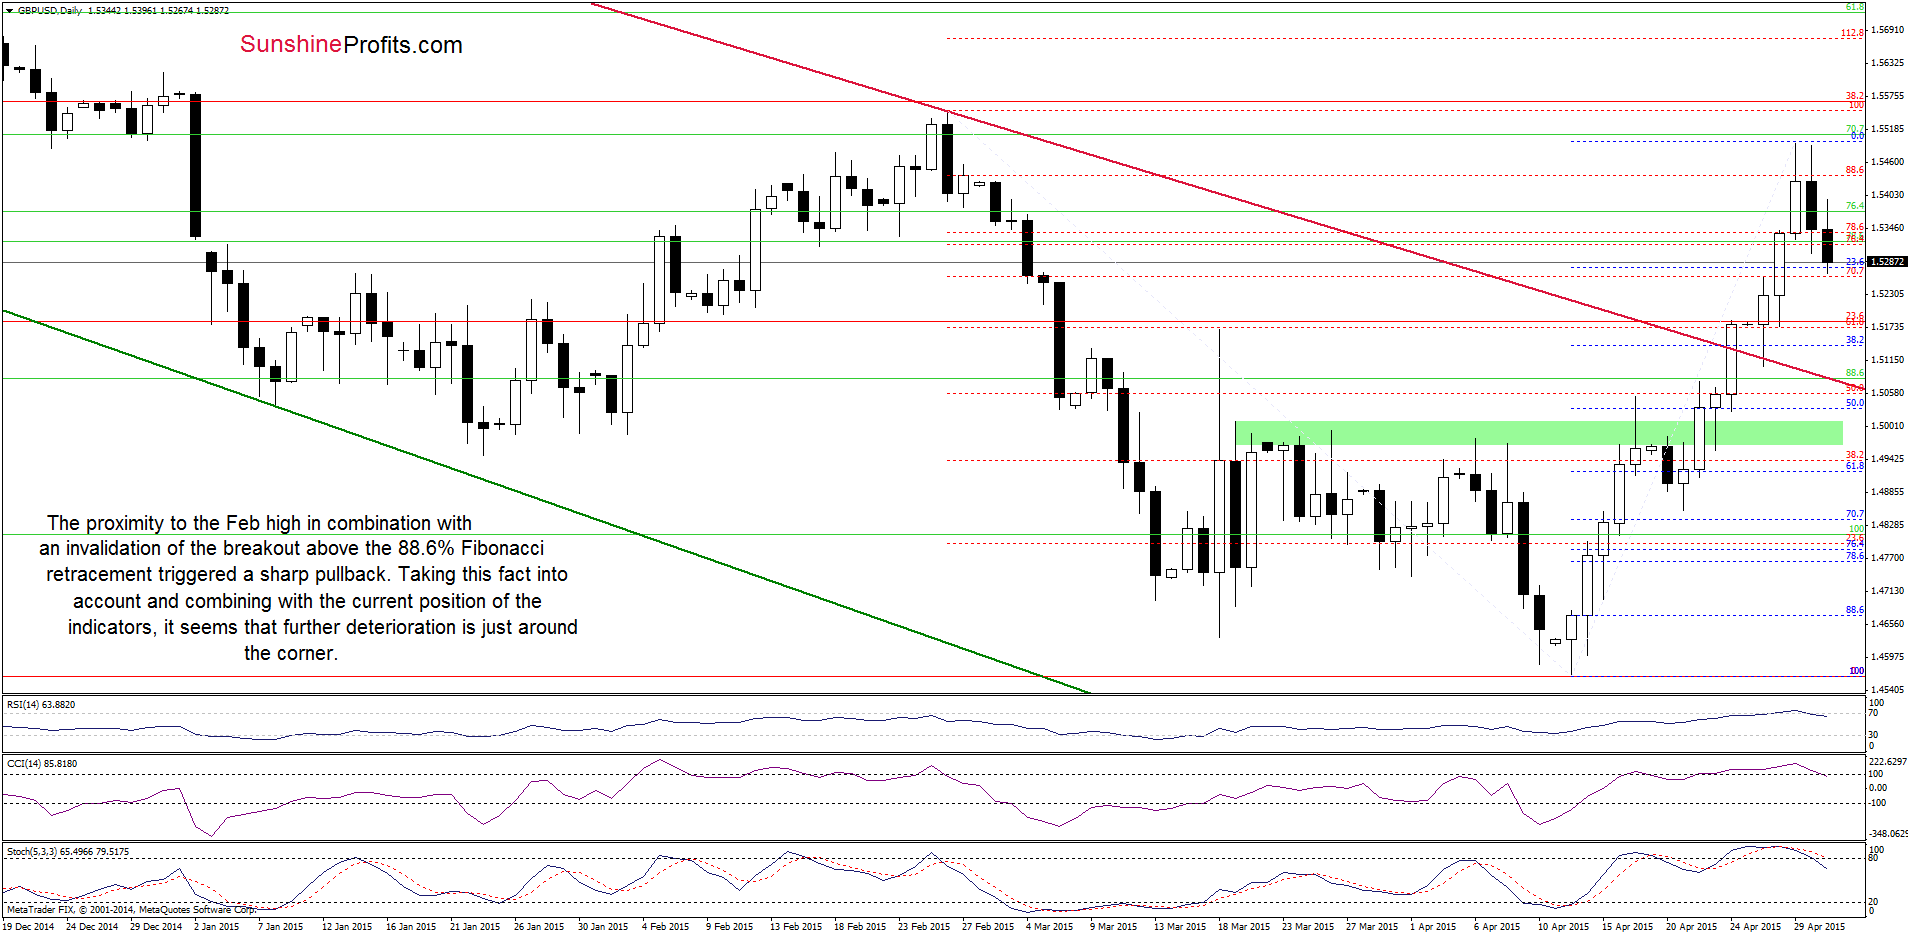
(…) the long-term support withstood the selling pressure, which triggered a sharp rebound and a breakout above both orange resistance zones. This is a bullish signal, which suggests ffurther improvement and an ncrease to the 88.6% Fibonacci retracement or even to the Feb high of 1.5550 (…). Nevertheless, we should keep in mind that the current position of the indicators (the RSI climbed above the level of 70, while the CCI and Stochastic Oscillator are extremely overbought) suggests that reversal is just around the corner.
As you see on the daily chart, the situation developed in line with the above scenario and GBP/USD reversed, invalidating earlier breakout above the 88.6% Fibonacci retracement. This negative signal triggered further deterioraion, which in combination with sell signals generated by the indicators suggests lower values of the exchange rtae. If this is the case, and GBP/USD moves drops from here, the initial downside target would be around 1.5140, where the 38.2% Fibonacci retracement based on the recent rally is. If it is broken, the next target for currecy bears would be around 1.5181, where the previously-broken long-term declining crimson line is.
Very short-term outlook: bearish
Short-term outlook: mixed
MT outlook: mixed
LT outlook: mixed
Trading position (short-term; our opinion): No positions are justified from the risk/reward perspective at the moment. We will keep you informed should anything change, or should we see a confirmation/invalidation of the above.
USD/JPY
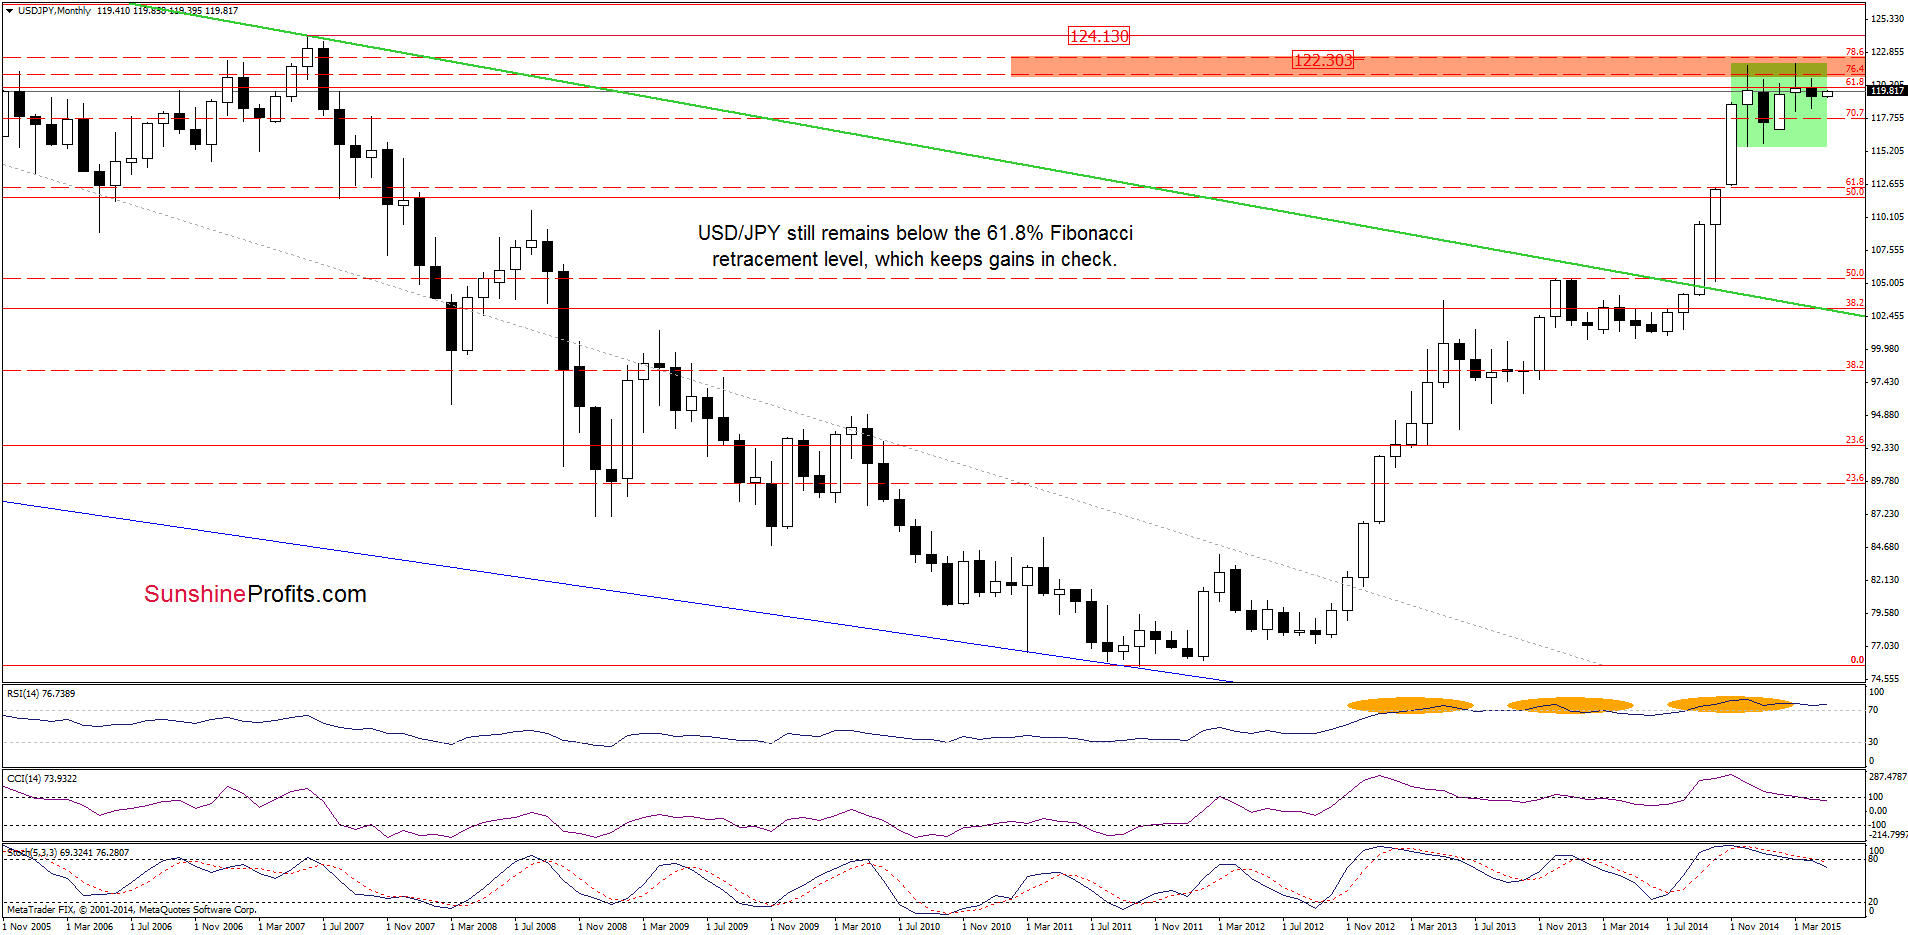
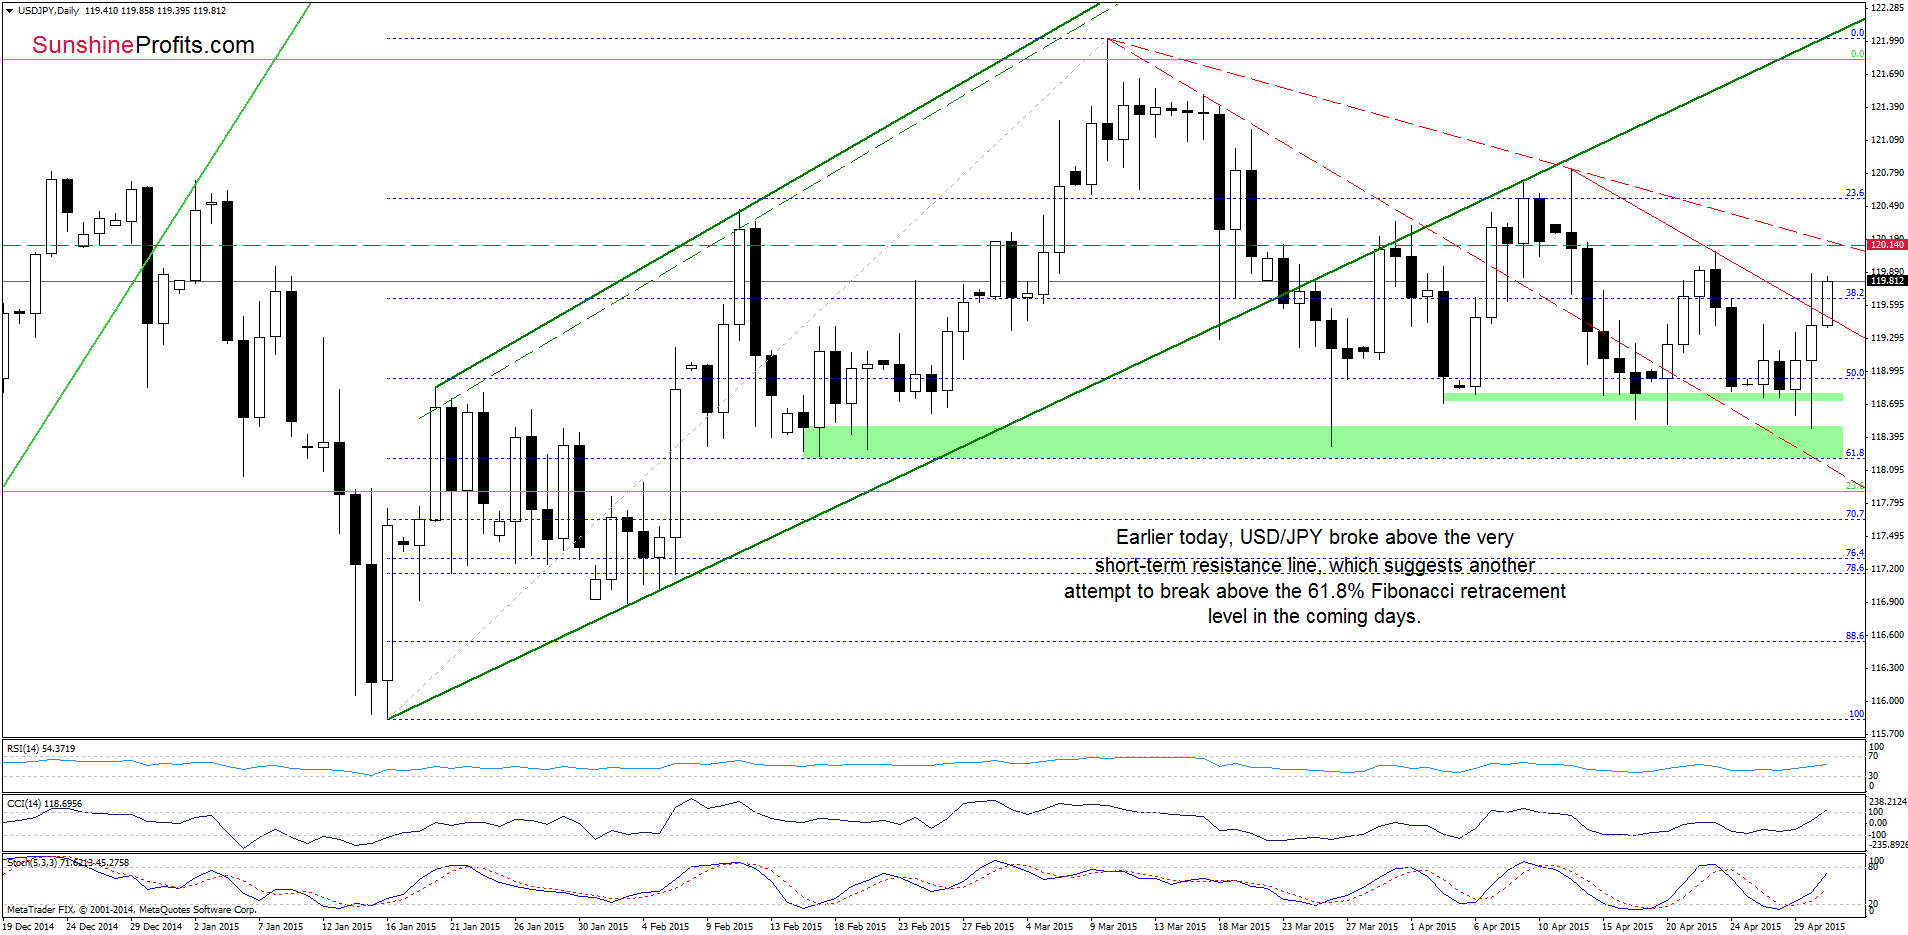
Yesterday, we wrote the following:
(…) USD/JPY bounced off the green support zone, which triggered a sharp rebound and an increase to the very short-term resistance line (based on the recent highs), which could pause further improvement. However, when we take a look at the position of the indicators, we see that they all generated buy signals, supporting the bullish case. Therefore, we think that currency bulls will try to push the exchange rate higher in the coming day(s).
On the above chart, we see that USD/JPY broke above the very short-term resistance line as we expected. This is a bullish sign, which in combination with buy signals suggests further improvement. If this is the case, the upside target would be around 120.14, where the 61.8% Fibonacci retracement (marked on the monthly chart) is (in this area is also the red declining resistance line based on the March and Apr highs, which serves as an additional resistance).
Very short-term outlook: bullish
Short-term outlook: mixed
MT outlook: mixed
LT outlook: bullish
Trading position (short-term; our opinion): No positions are justified from the risk/reward perspective at the moment. We will keep you informed should anything change, or should we see a confirmation/invalidation of the above.
USD/CAD
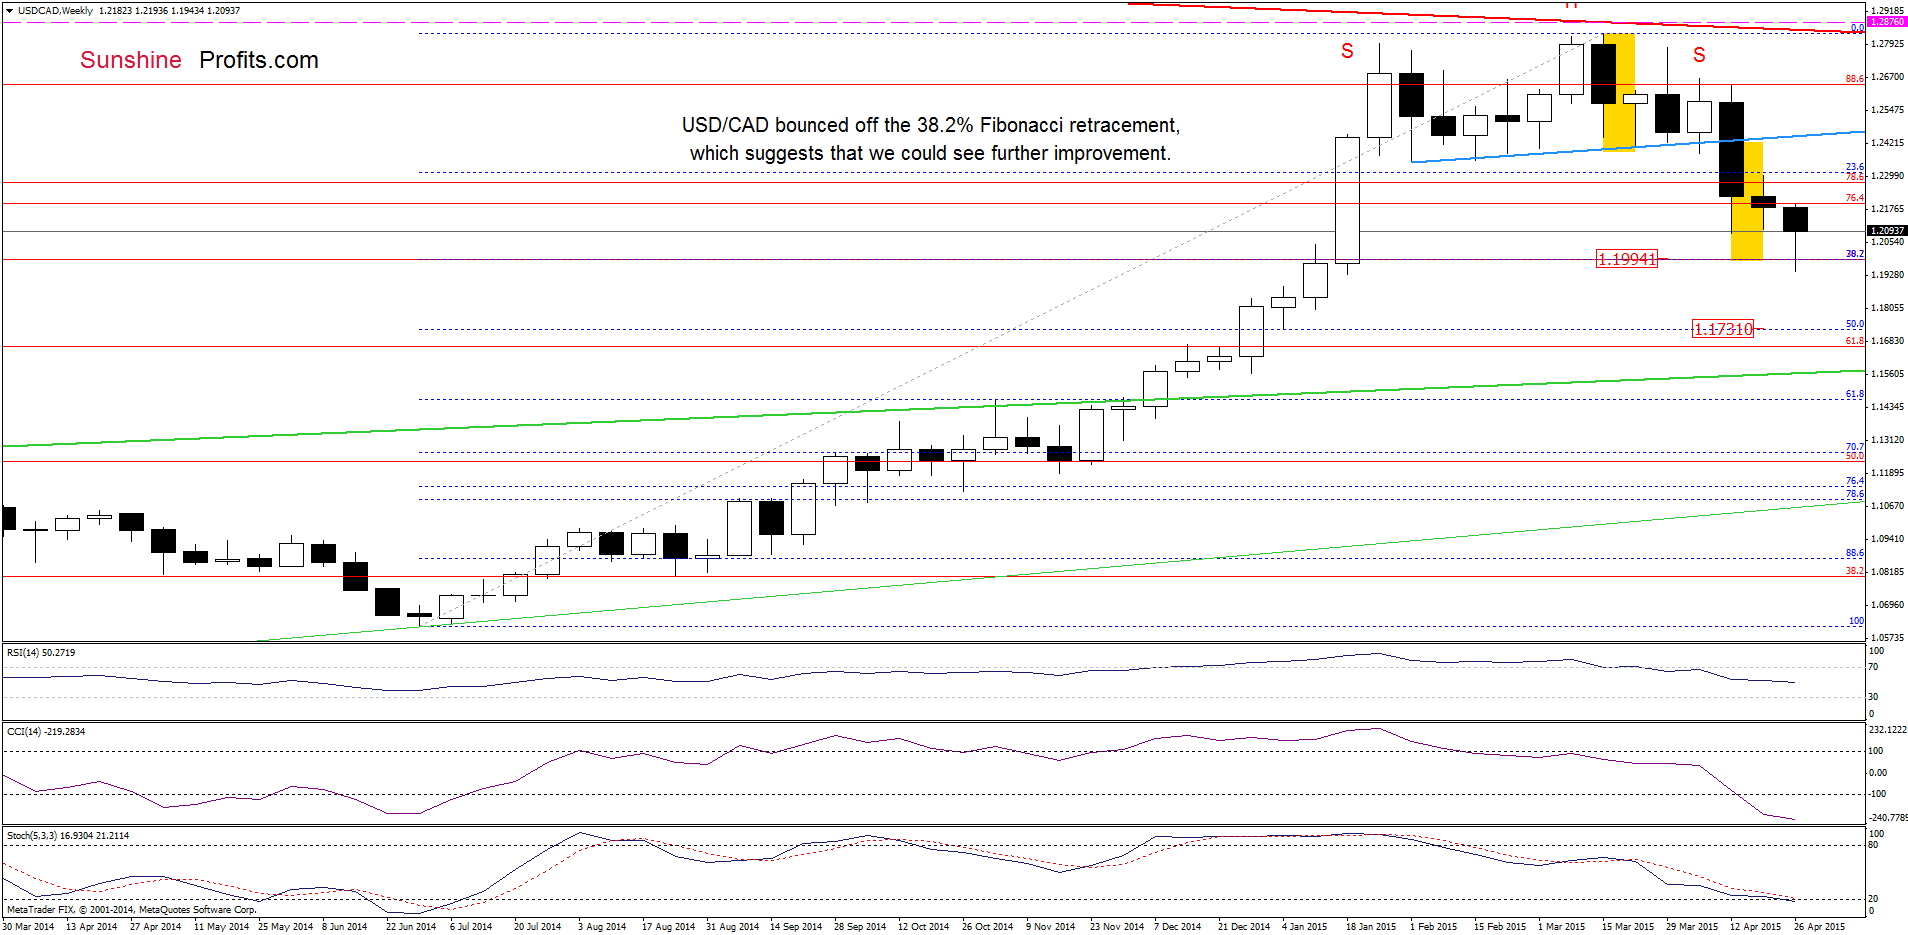
Quoting our last commentary on this currency pair:
(…) USD/CAD dropped to our downside target. Taking this fact into account, and combining with the 38.2% Fibonacci retracement, it seems that we could see a reduction of the selling pressure and rebound from here in the coming days.
From today’s point of view we see that the situation developed in line with the above scenario and USD/CAD moved higher. Additionally, the Stochastic Oscillator is very close to generate buy signal, which suggests that further improvement is just around the corner.
How high could the exchange rate go in the coming week? Let’s take a closer look at the daily chart below and find out.
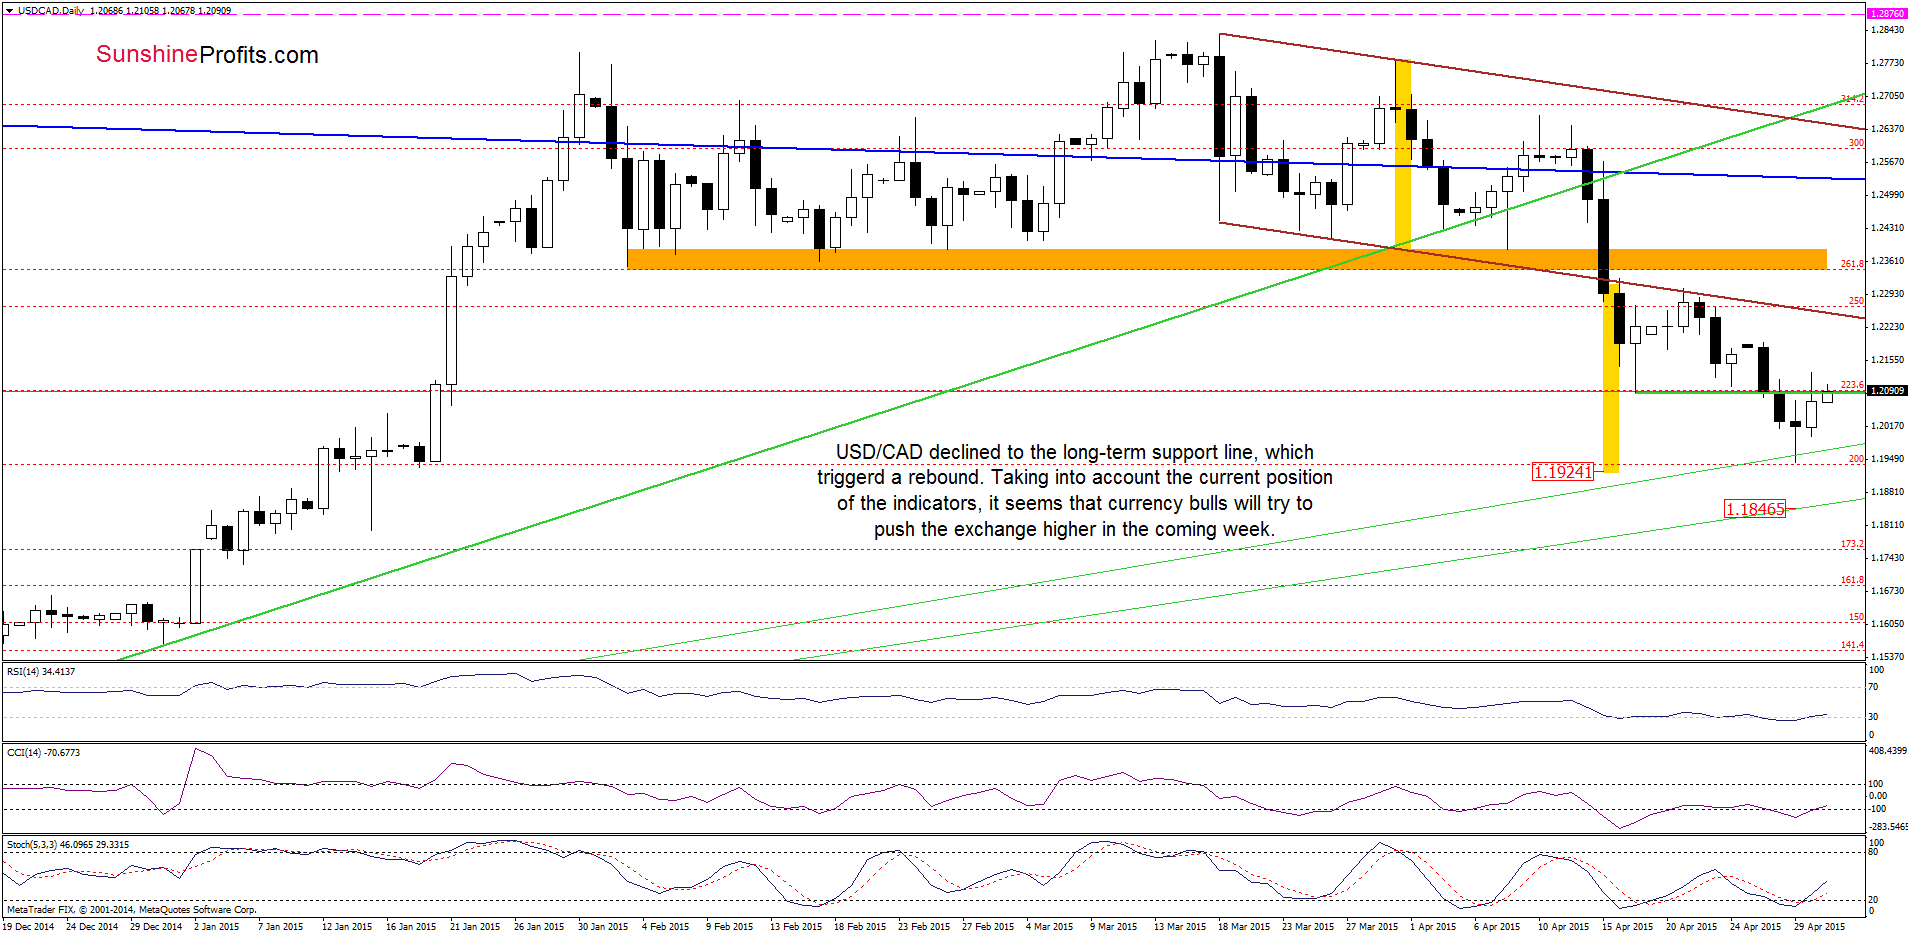
On Wednesday, we wrote:
(…) USD/CAD reached the area, where the size of the downward move corresponds to the height of the consolidation (marked with blue). Similarly to what we wrote earlier, this could reduce the selling pressure and trigger a rebound. However, as you see there are no buy signals that could support currency bulls, which suggest that we might see a test of the long-term support line based on the Sep 19 and Nov 21 lows. If it holds, we’ll see a rebound to the lower border of the declining trend channel
As you see on the daily chart, the long-term support line withstood the selling pressure and triggered a rebound. Taking this fact into account, and combining it with buy signals generated by all indicators, we think that currency bulls will push the exchange rate to the upside target from our last commentary in the coming week (the lower border of the declining trend channel is currently around 1.2247).
Very short-term outlook: bullish
Short-term outlook: bearish
MT outlook: bearish
LT outlook: mixed
Trading position (short-term; our opinion): No positions are justified from the risk/reward perspective at the moment. We will keep you informed should anything change, or should we see a confirmation/invalidation of the above.
USD/CHF
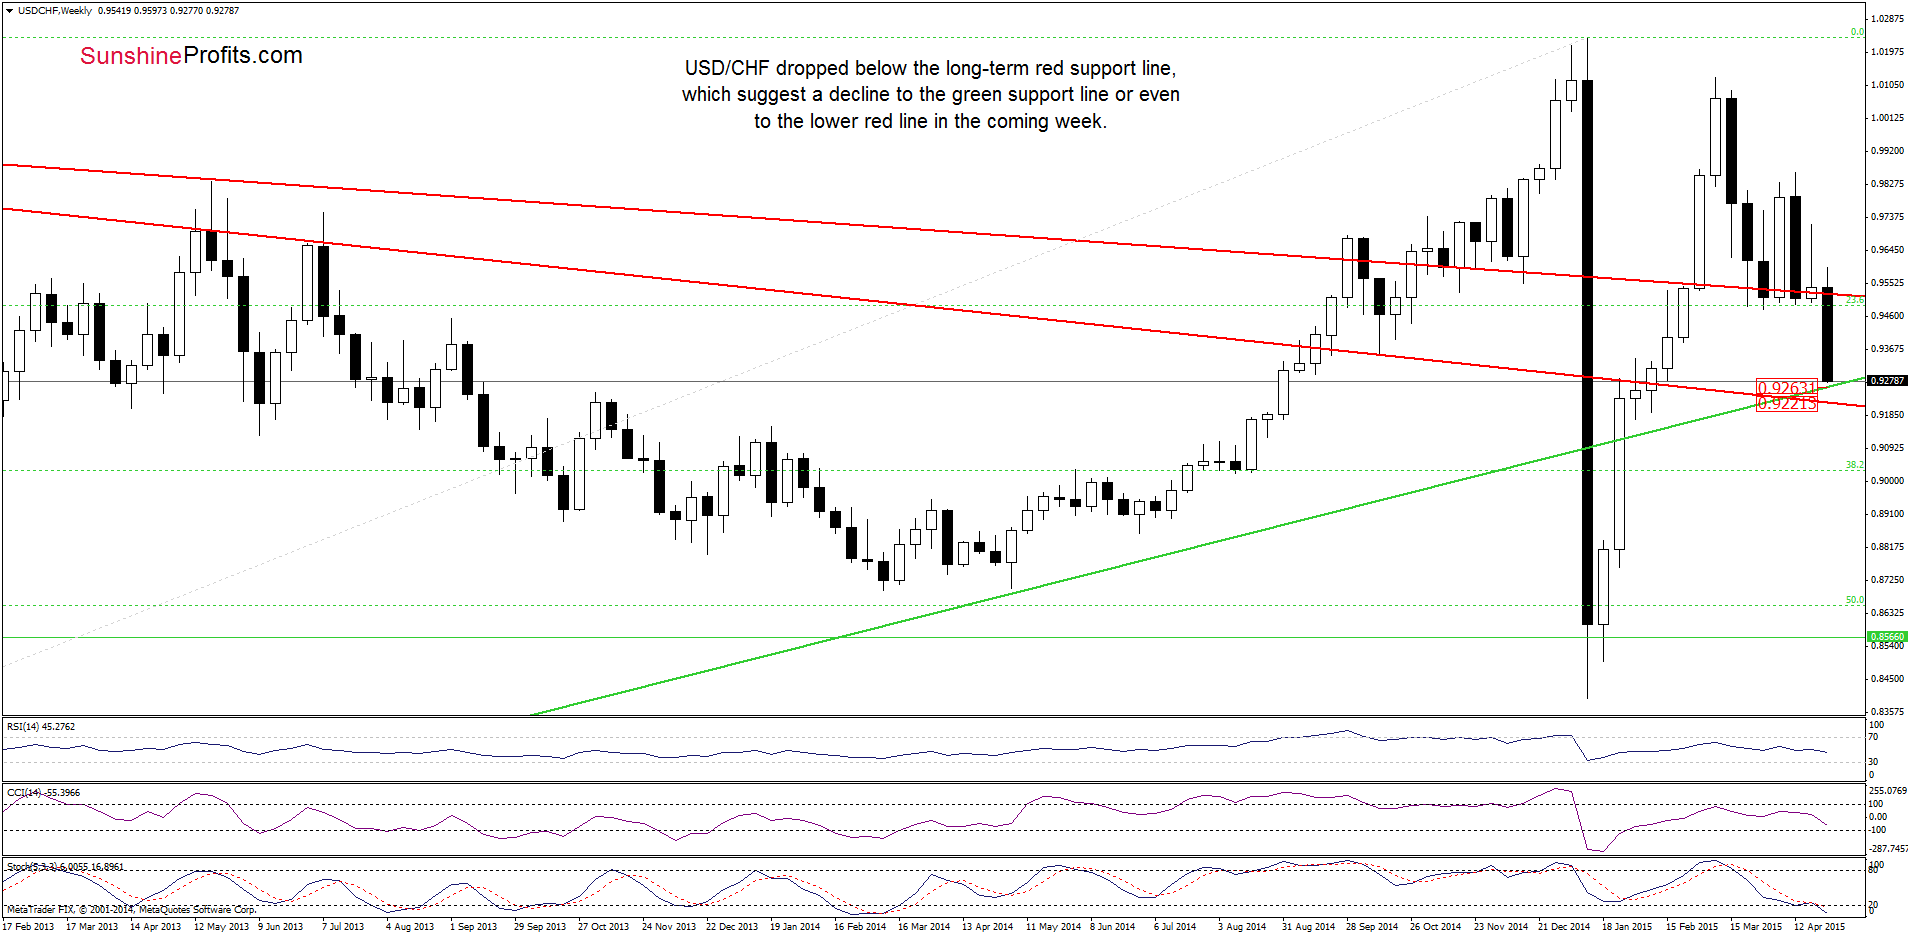
The first thing that catches the eye on the above chart is a breakout below the long-term red support line. This is a bearish signal, which suggests further deterioration and a drop to the green support line (around 0.9263) r even to the lower red line (around 0.9221) in the coming week.
Having said that, let’s check what impact did this decline have n the very short-term picture.
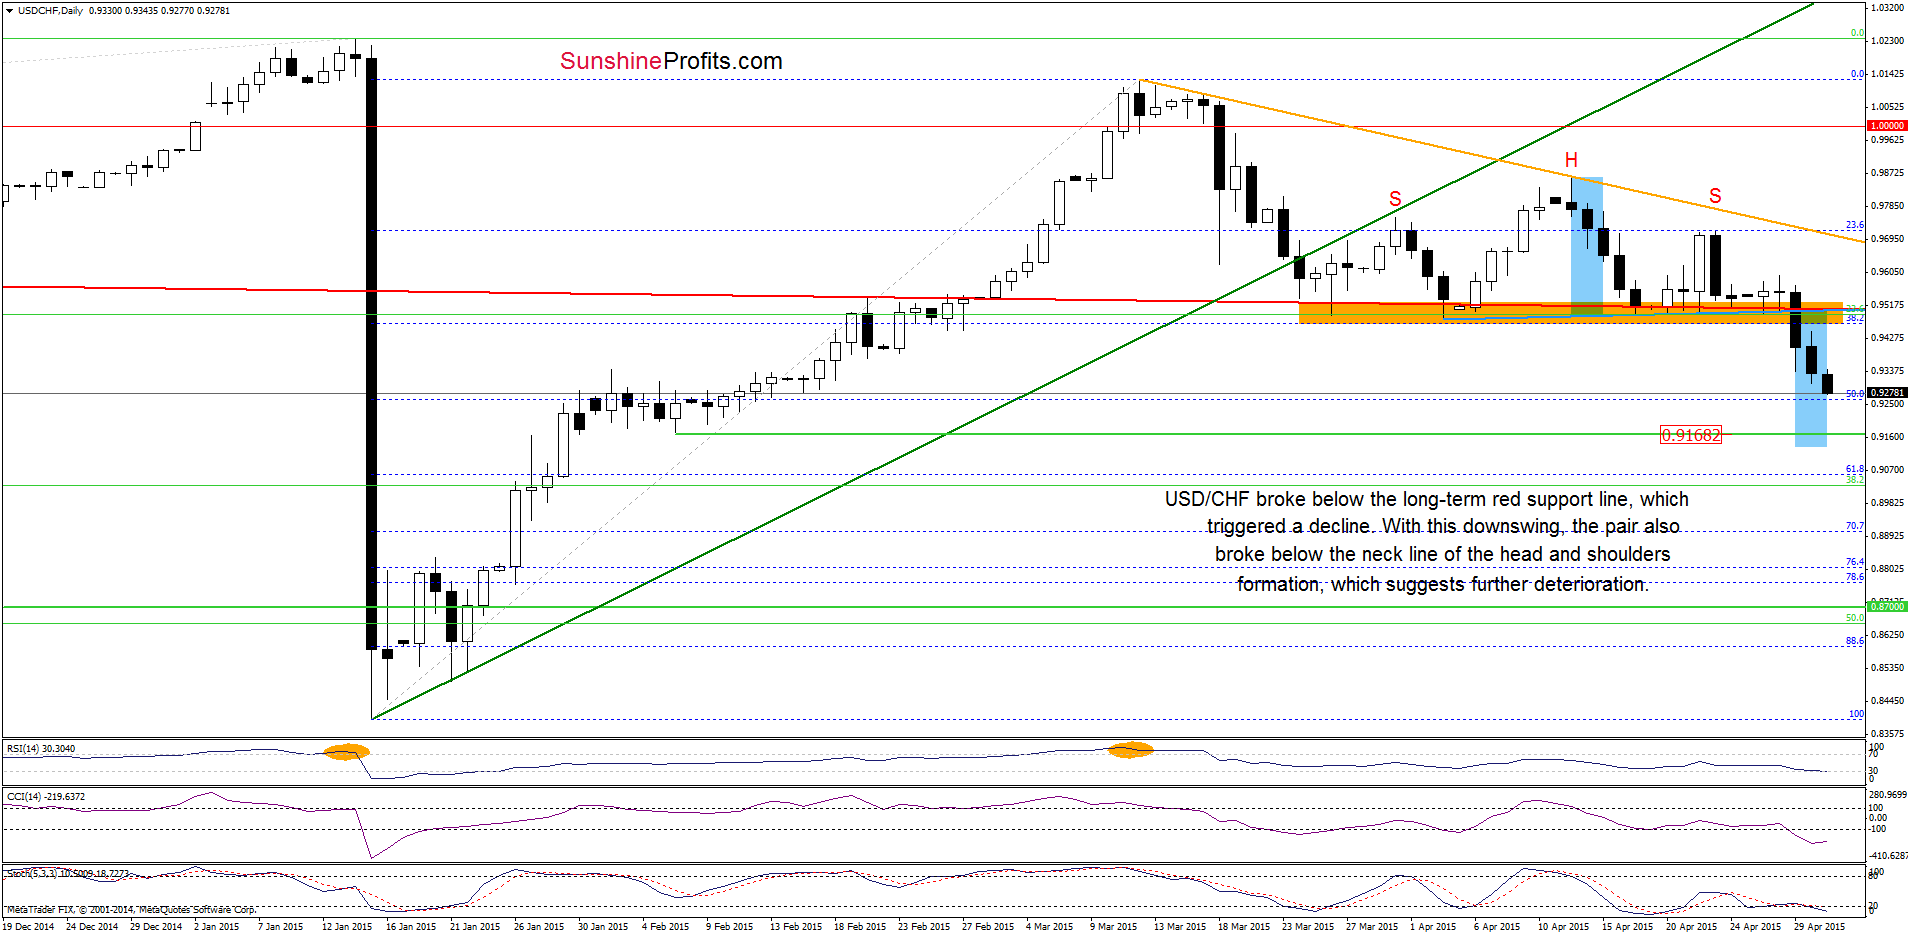
On the above charts we see that USD/CHF broke below the long-term red support line, which triggered a sharp decline. With this downswing, the pair also dropped under the neck line of the head and shoulders formation (marked with blue) which suggests further deterioration and a pullback to around 0.9168, where the Feb lows are (nevertheless, we could also see a decline to 0.9138, where the size of the downward move will correspond to the height of the formation).
Very short-term outlook: bearish
Short-term outlook: mixed
MT outlook: mixed
LT outlook: bearish
Trading position (short-term; our opinion): No positions are justified from the risk/reward perspective at the moment. We will keep you informed should anything change, or should we see a confirmation/invalidation of the above.
AUD/USD
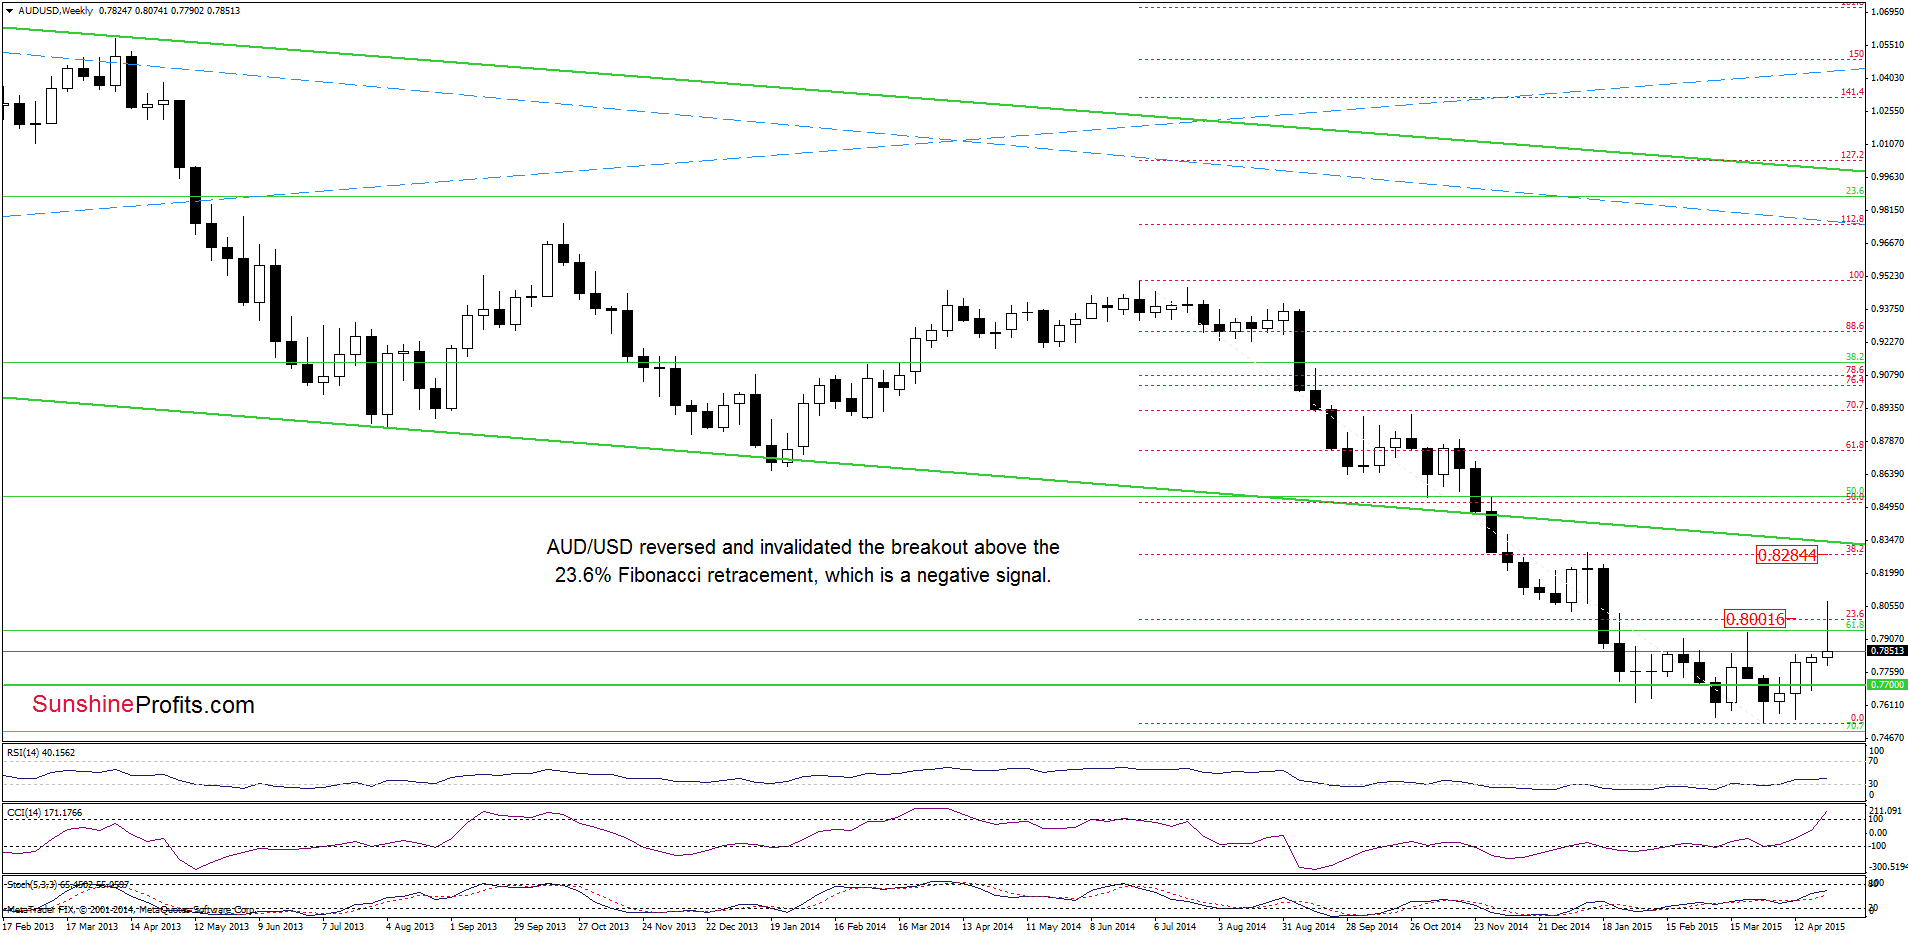
The invalidation of the breakout above the 23.6% Fibonacci retracement (based on the entire June-March declines) and its negative impact on future moves remains in effect, suggesting further deterioration.
Let’s check how low could the exchange rate go.
Quoting our yesterday’s alert:
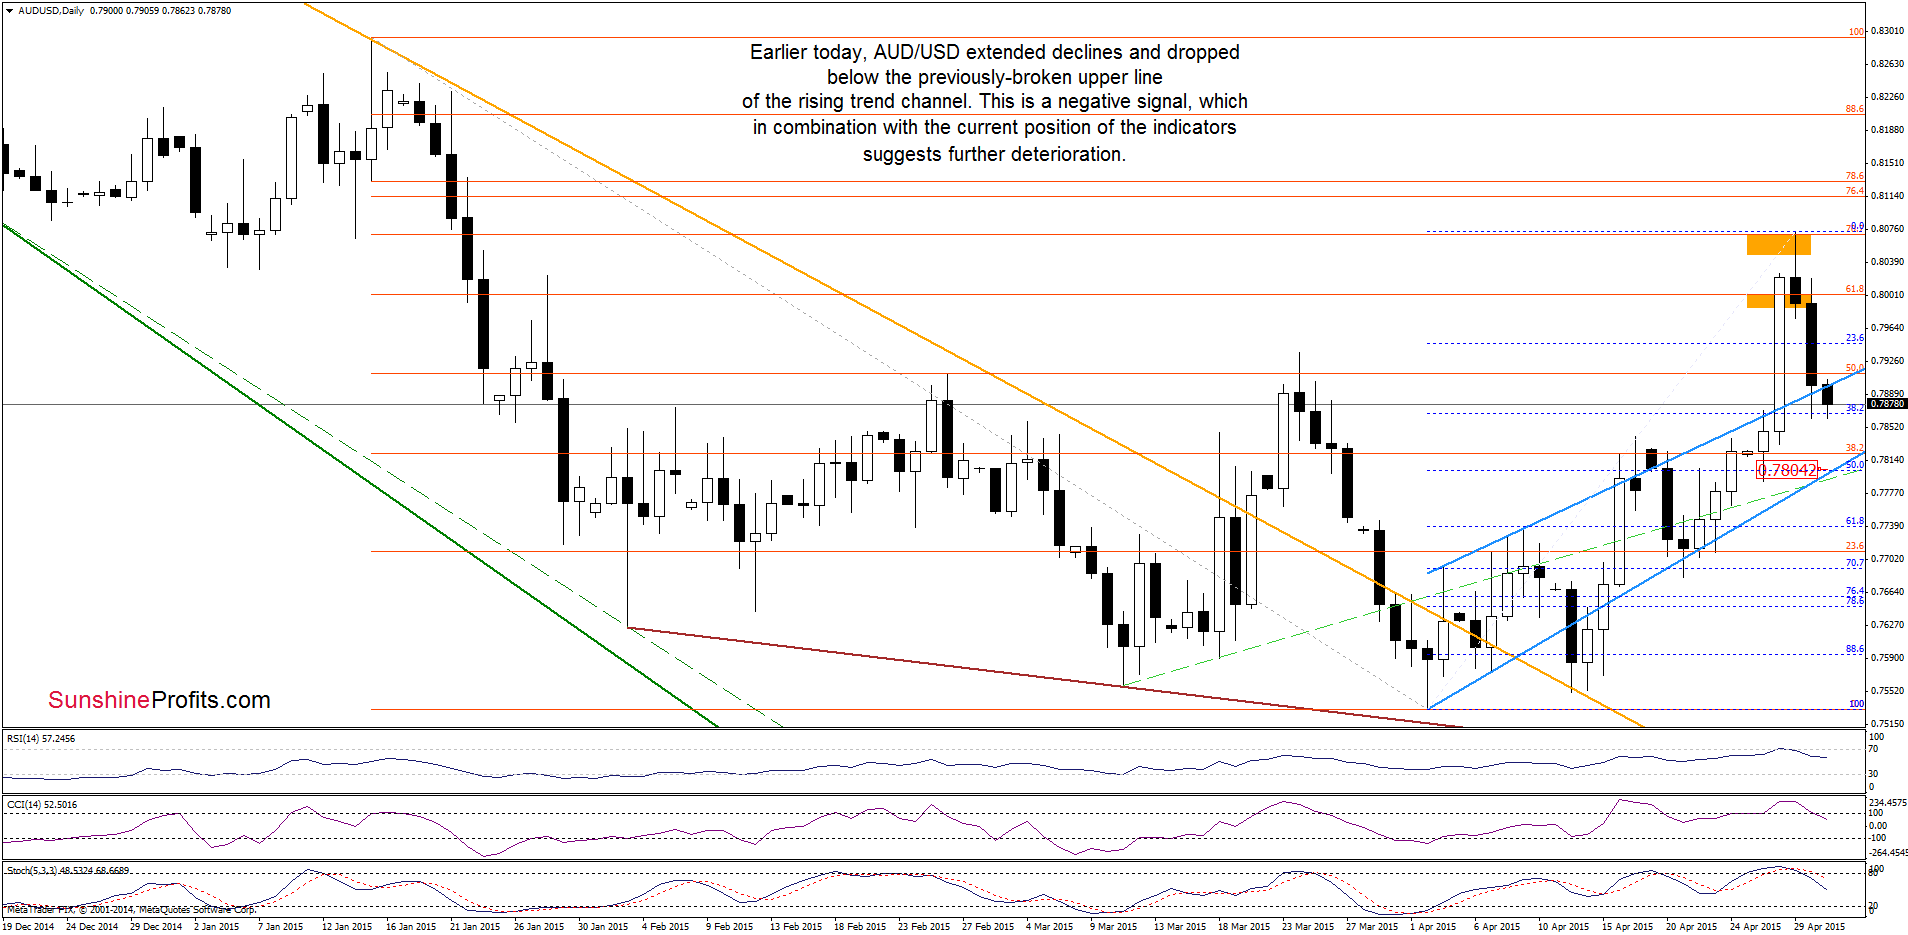
(…) a sharp decline (…) took the exchange rate to the previously-broken upper line of the rising trend channel. Although the pair could rebound from here, it seems to us that an invalidation of the breakout (seen on the weekly chart) and sell signals generated by all indicators, will trigger further deterioration in the coming day(s). If this is the case, and AUD/USD closes the day below this blue line, the initial downside target would be the lower line of the formation (…)
Earlier today, currency bears pushed AUD/USD lower as we expected. With this drop the pair declined below the upper line of the rising trend channel, which means that our downside target (currently around 0.7804) will be in play in the coming days.
Very short-term outlook: mixed with bearish bias
Short-term outlook: mixed
MT outlook: mixed
LT outlook: mixed
Trading position (short-term; our opinion): No positions are justified from the risk/reward perspective at the moment. We will keep you informed should anything change, or should we see a confirmation/invalidation of the above.
Thank you.
Nadia Simmons
Forex & Oil Trading Strategist
Przemyslaw Radomski, CFA
Founder, Editor-in-chief
Gold & Silver Trading Alerts
Forex Trading Alerts
Oil Investment Updates
Oil Trading Alerts

