

Yesterday, the U.S. Department of Labor said that the number of jobless claims in the week ending April 18 increased by 1,000 to 295,000, missing analysts’ expectations for a 4,000 drop. Additionally, yesterday’s data showed that U.S. new home sales dropped 11.4% in March, also missing forecasts for a 5.3% decline. Earlier today, official data showed that U.S. durable goods orders rose 4.0% in the previous month (beating expectations for a 0.6% gain), but core durable goods orders without transportation items fell 0.2% missing expectations for a 0.3% rise. These disappointing numbers pushed the USD Index below 97, extending yesterday's decline. How did this downward move affect the major currency pairs?
In our opinion the following forex trading positions are justified - summary:
EUR/USD
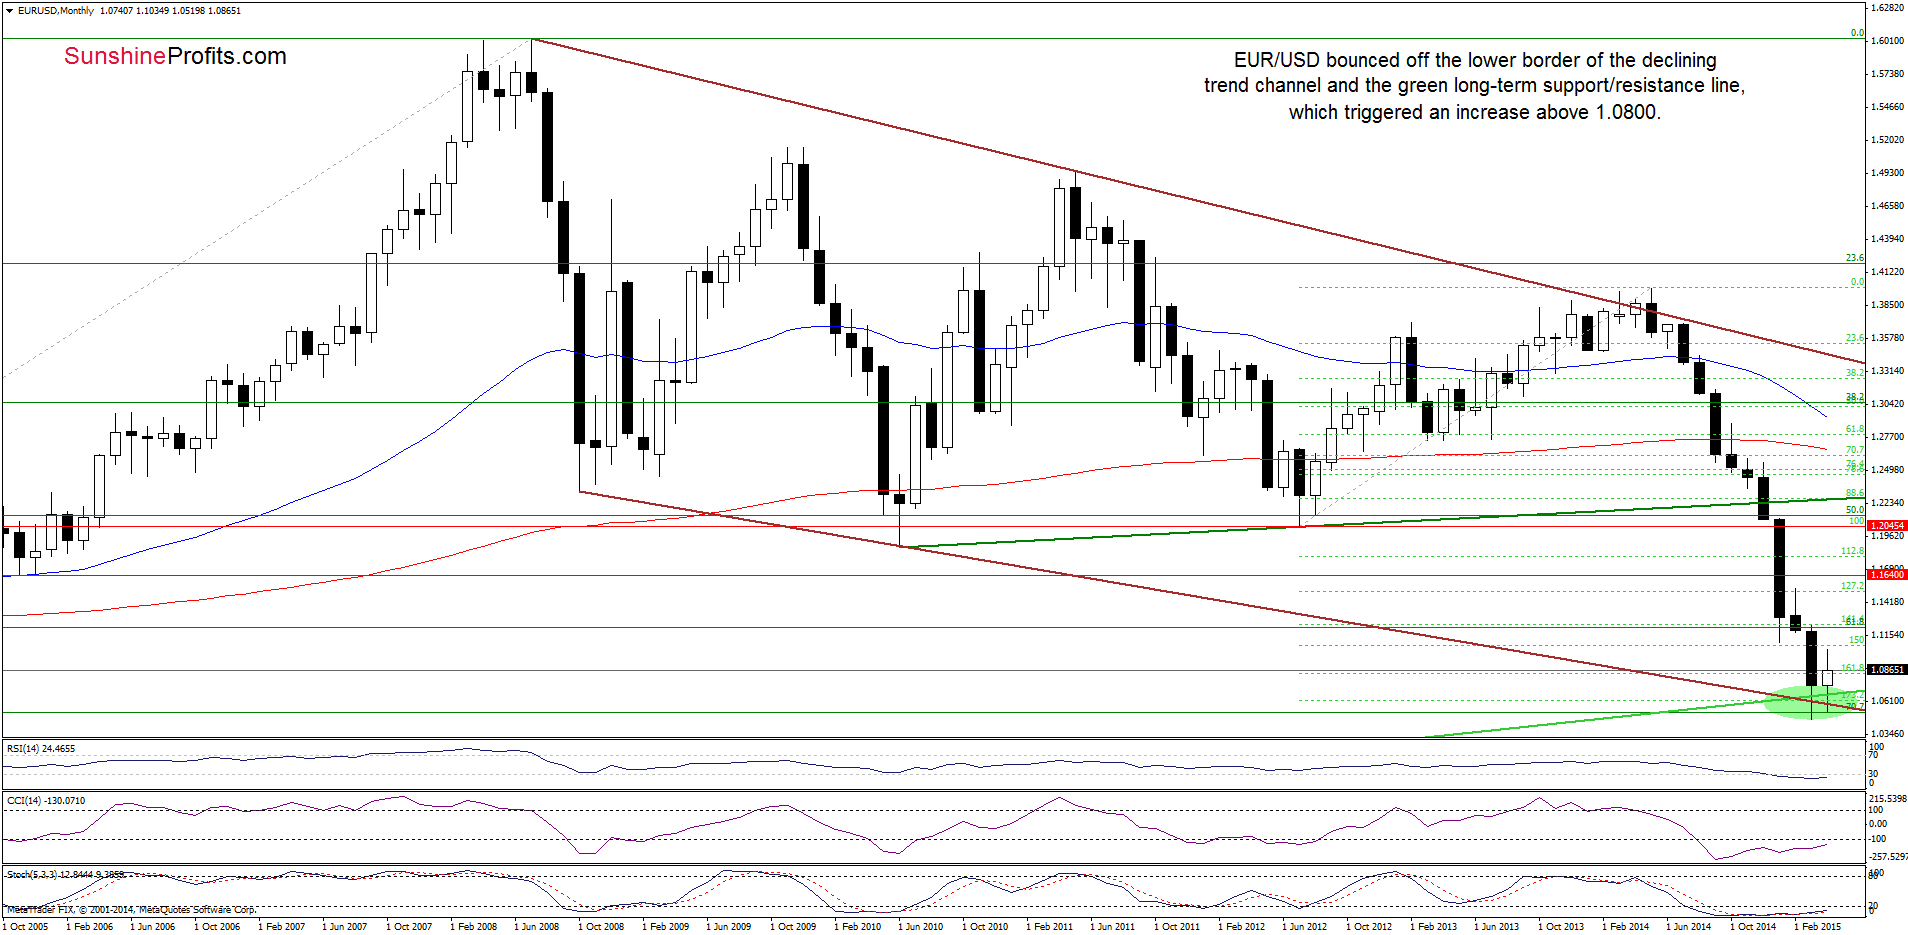
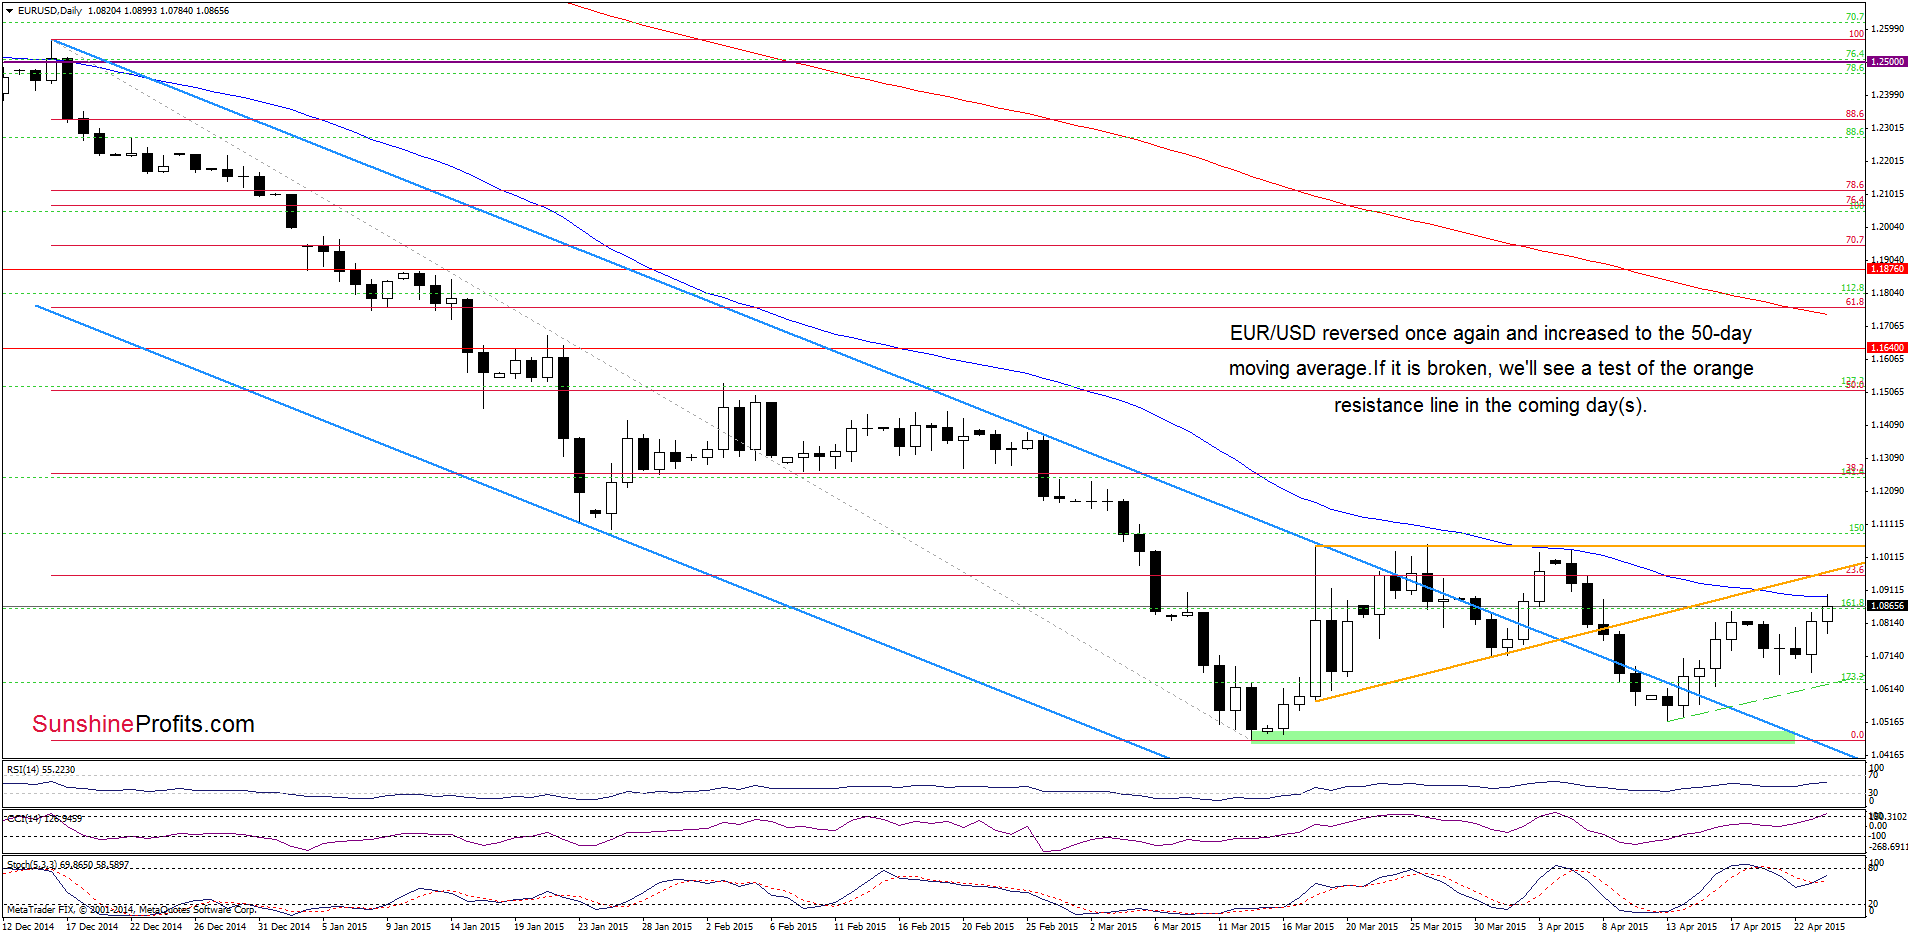
Looking at the charts we see that EUR/USD re-tested the strength of the long-term green line yesterday. As you see, this solid support withstood the selling pressure and encouraged currency bulls to act - similarly to what we saw on Tuesday. As a result, the exchange rate rebounded and climbed above 1.0800, reaching the 50-day moving average. At this point it is worth noting that at the beginning of the month, this resistance was strong enough to stop further improvement and trigger a deep pullback. Taking this fact into account, and combining it with the proximity to the orange resistance line, it seems that we could see similar price action in the coming days. If this is the case, the pair will reverse and test the long-term support line once again.
Finishing today’s commentary on this currency pair, please note that even if EUR/USD breaks above the above-mentioned lines, the exchange rate will be still trading under the resistance zone created by the Mar and Apr highs. Therefore, in our opinion, a sizable upward move will be more likely only if we see a breakout above this area.
Very short-term outlook: mixed with bearish bias
Short-term outlook: mixed
MT outlook: mixed
LT outlook: mixed
Trading position (short-term; our opinion): No positions are justified from the risk/reward perspective at the moment. We will keep you informed should anything change, or should we see a confirmation/invalidation of the above.
GBP/USD
On Wednesday, we wrote the following:
(…) the exchange rate reversed and approached the last week’s high, which is a positive signal that suggests further improvement (especially when we take into account the fact that an invalidation of small breakdown under the lower border of the formation and its positive impact on future moves is still in effect).
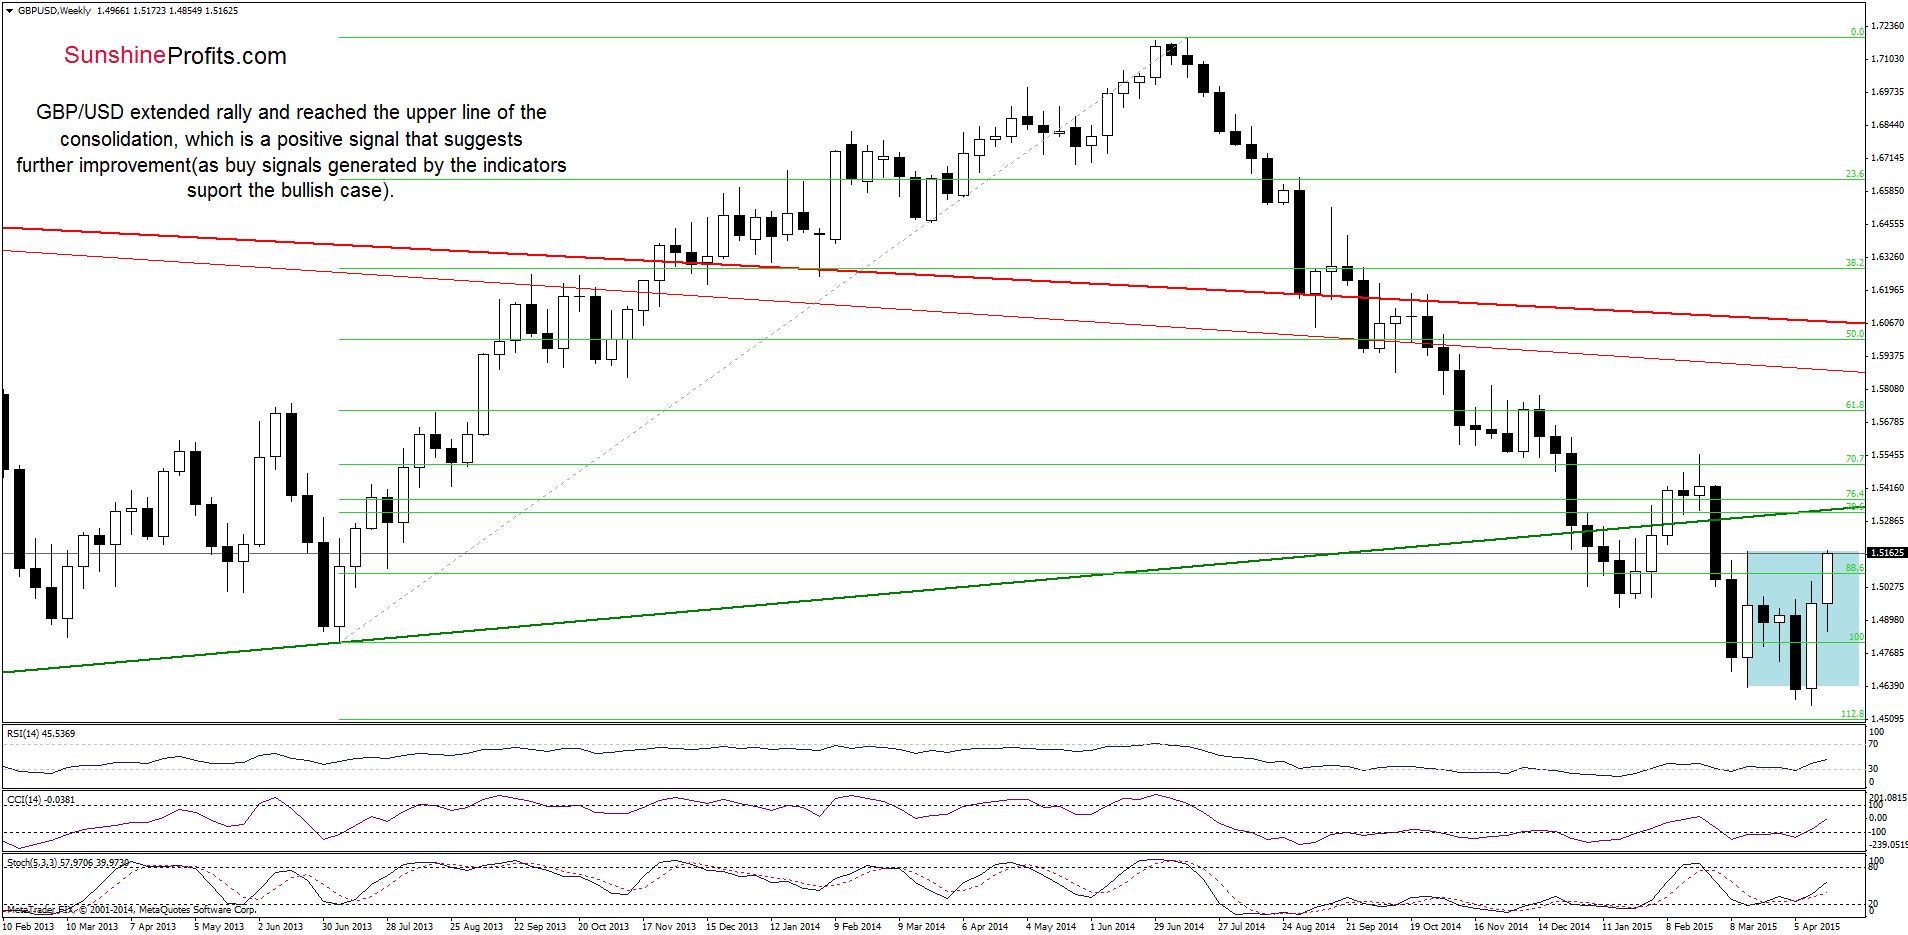
Looking at the weekly chart, we see that currency bulls pushed the pair higher as we expected. As a result, GBP/USD reached the last week’s high and the upper line of the consolidation, which is a bullish sign. Taking into account the current position f the indicators, it seems that we’ll see further improvement. On the other hand, if this resistance area encourages currency bears to act, we might see a pullback in the coming week.
Which scenario is more likely at the moment? Can we infer something more from the daily chart? Let’s check.
Quoting our last commentary:
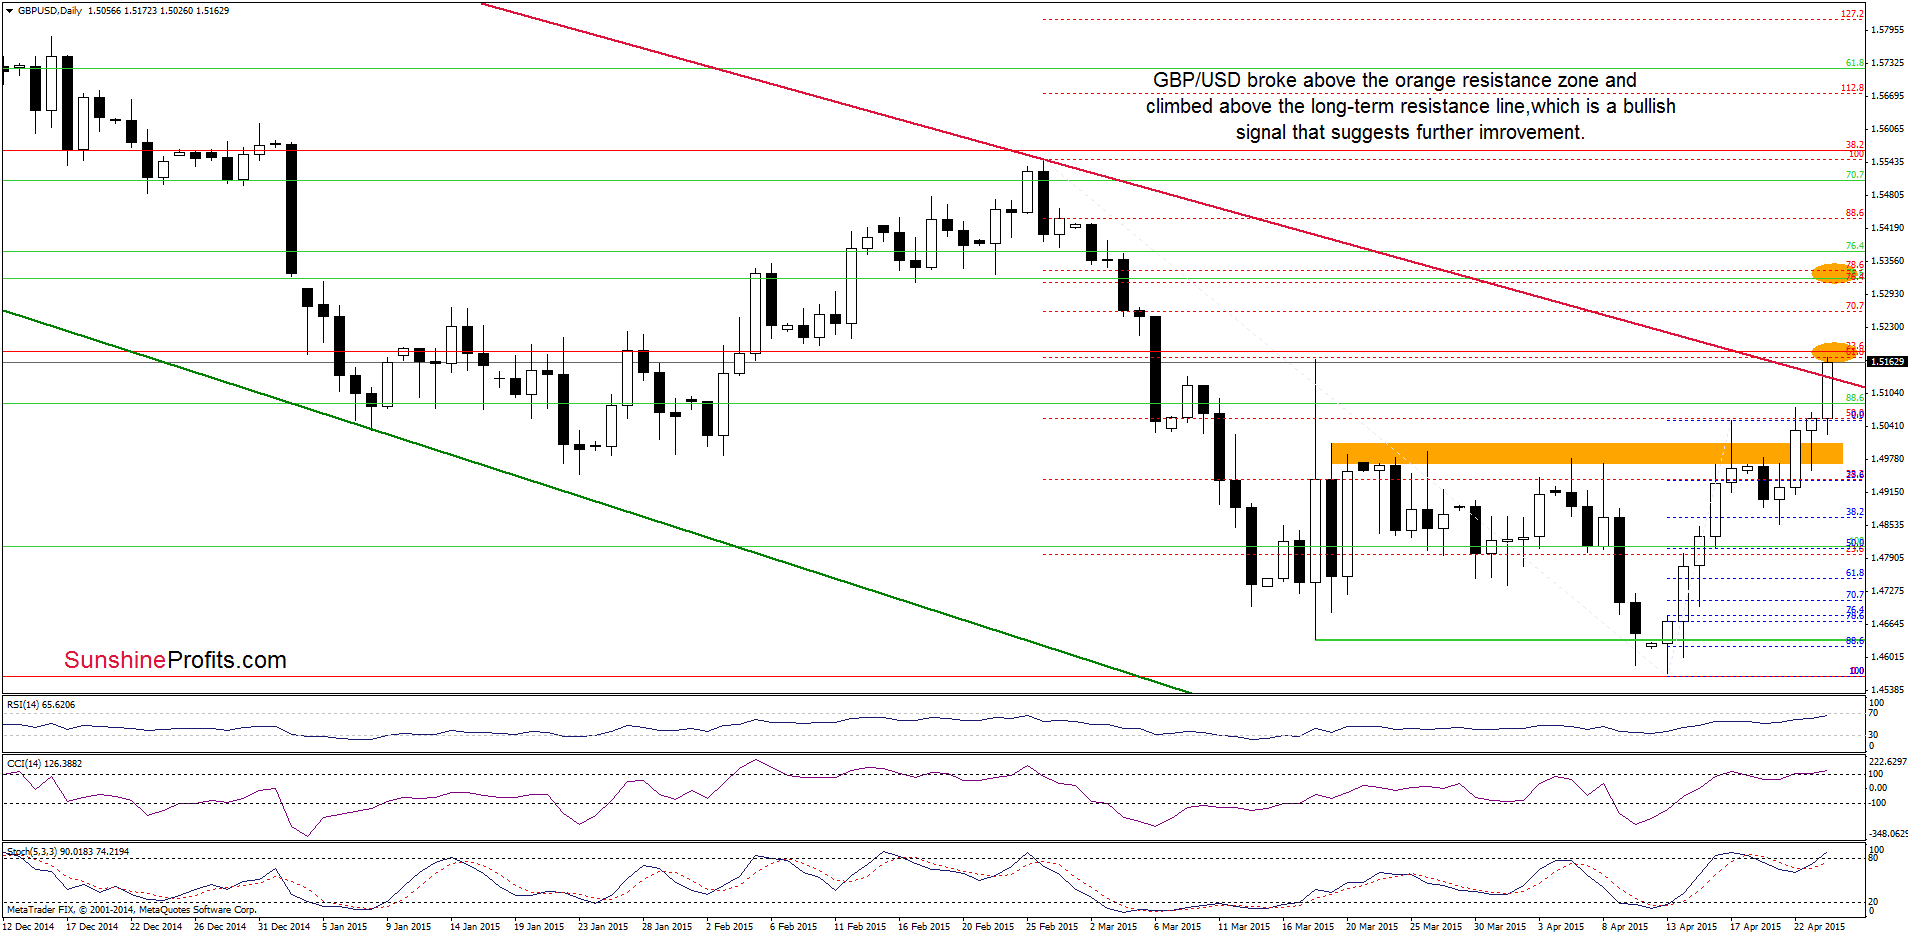
(…) if currency bulls push the pair higher (and if GBP/USD closes the day above this zone), the initial upside target would be around 1.5153, where the long-term crimson resistance line (based on the Jul and Feb highs) is.
As you see on the daily chart, the situaion developed in line with the above scenario and GBP/USD not only reached, but also broke above our upside target, which suggests further improvement. Nevertheless, we should keep in mind that today’s move took the exhange rate to the resistance zone created by the 23.6% Fibonacci retracement (based on the entire Jul-Apr orrection), 61.8% retracement (based on the Feb-Apr declines), the Mar 18 high and the upper line of the consolidation marked on the weekly chart, which could pause or even stop further rally. Therefore, we think that this improvement will be more reliable if we see a daily close above this line and a breakout above the resistance zone. Until this time, another pullback is quite likely.
Very short-term outlook: mixed
Short-term outlook: mixed
MT outlook: mixed
LT outlook: mixed
Trading position (short-term; our opinion): No positions are justified from the risk/reward perspective at the moment. We will keep you informed should anything change, or should we see a confirmation/invalidation of the above.
USD/JPY
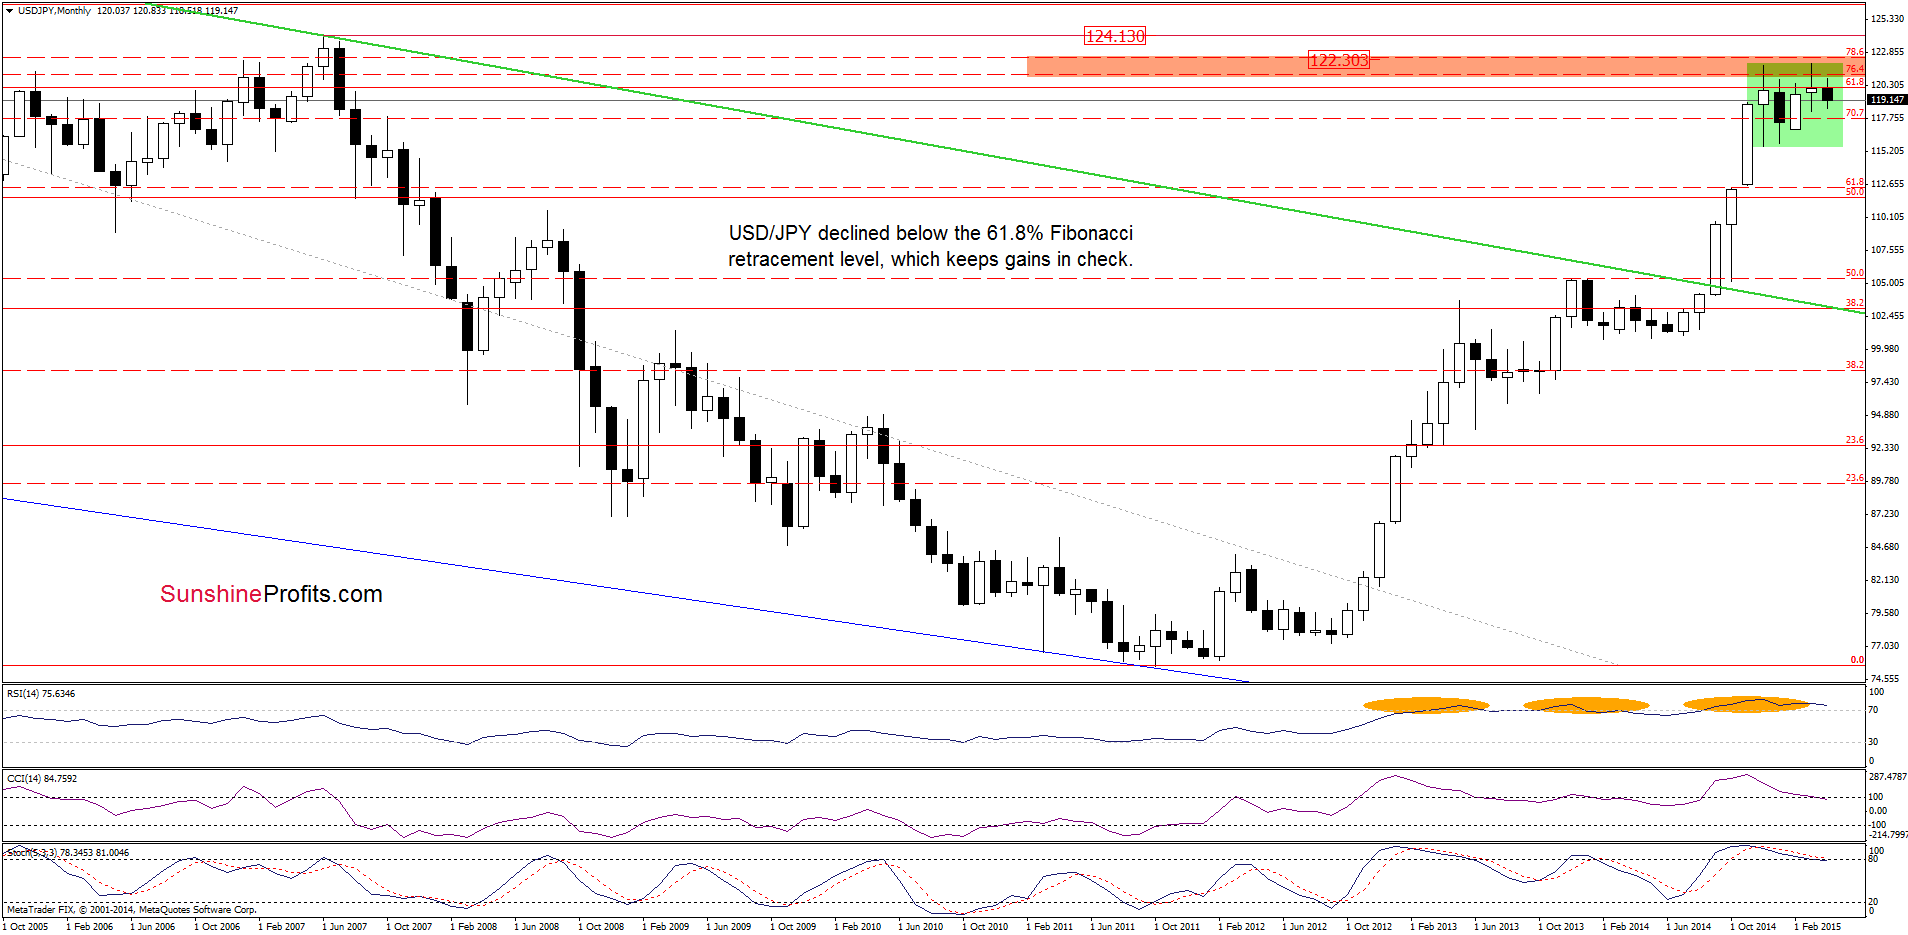
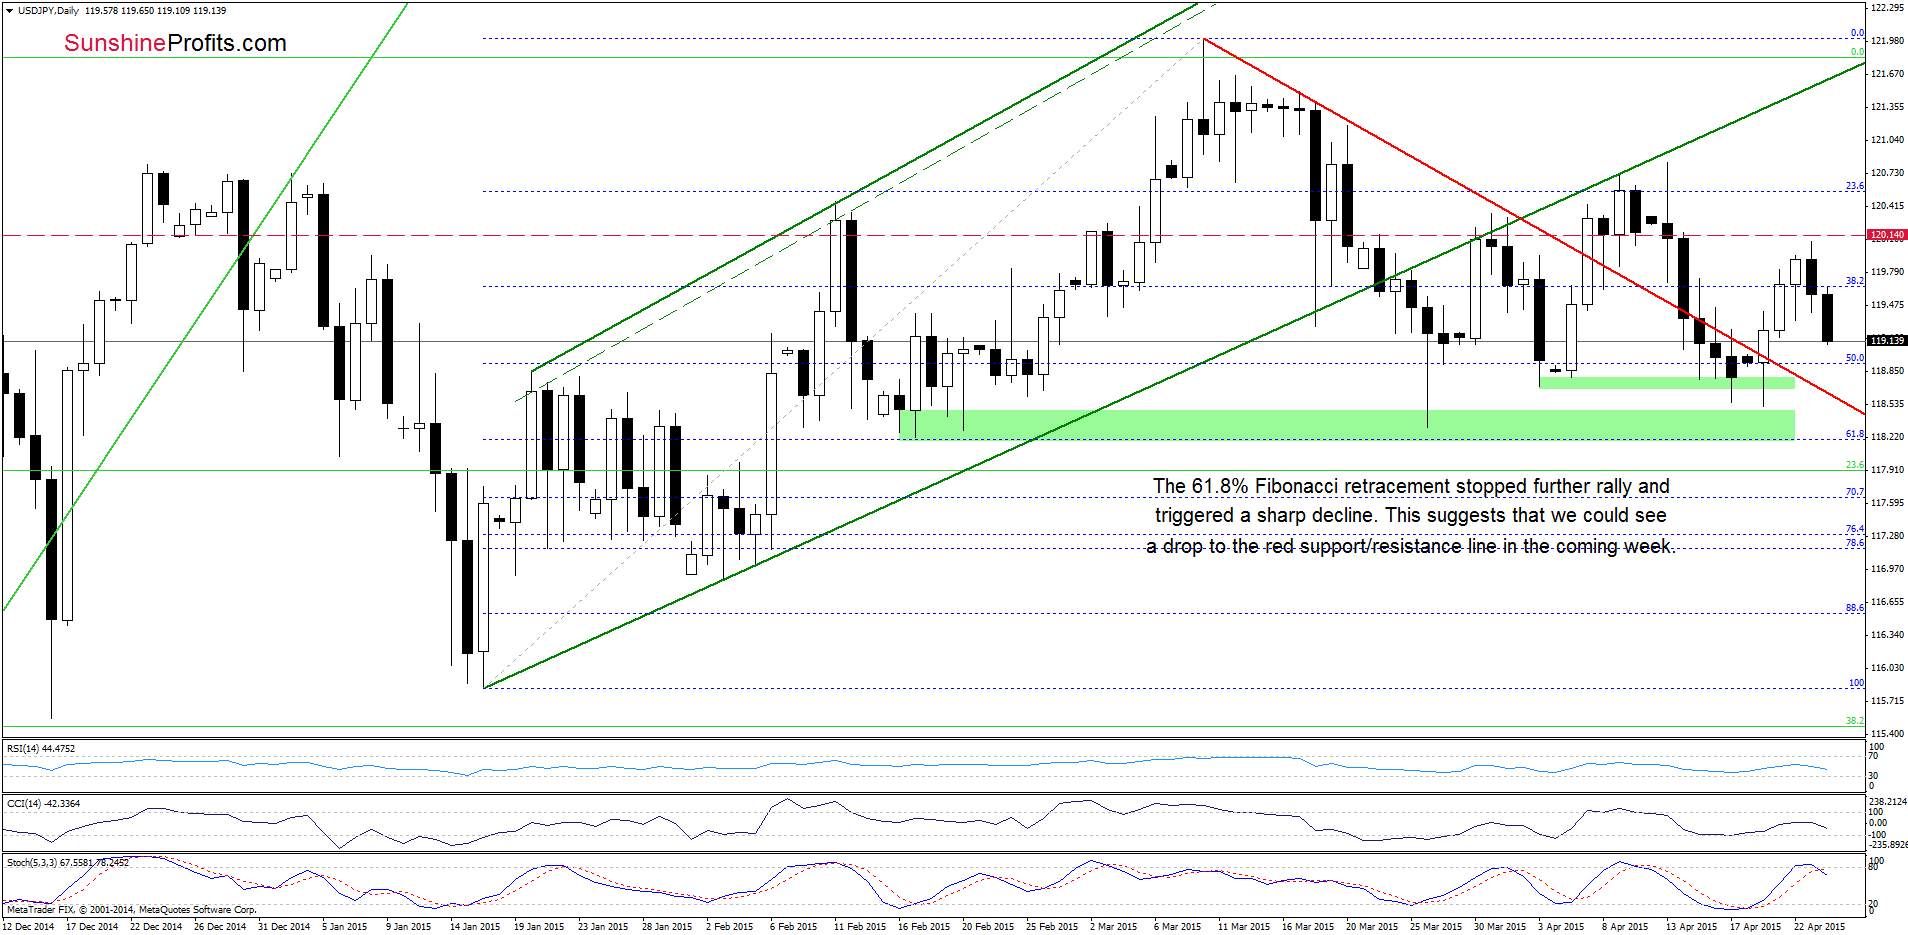
Looking at the charts, we see that the 61.8% Fibonacci retracement level (based on the entire 1998-2011 declines) stopped further improvement and triggered a sharp decline. Taking this fact into account, and combining it with a sell signal generated by the Stochastic Oscillator, it seems that we could see another drop to the green support zone or even to the red support line (currently around 118.65) in the coming week.
Very short-term outlook: mixed with bearish bias
Short-term outlook: mixed
MT outlook: mixed
LT outlook: bullish
Trading position (short-term; our opinion): No positions are justified from the risk/reward perspective at the moment. We will keep you informed should anything change, or should we see a confirmation/invalidation of the above.
USD/CAD
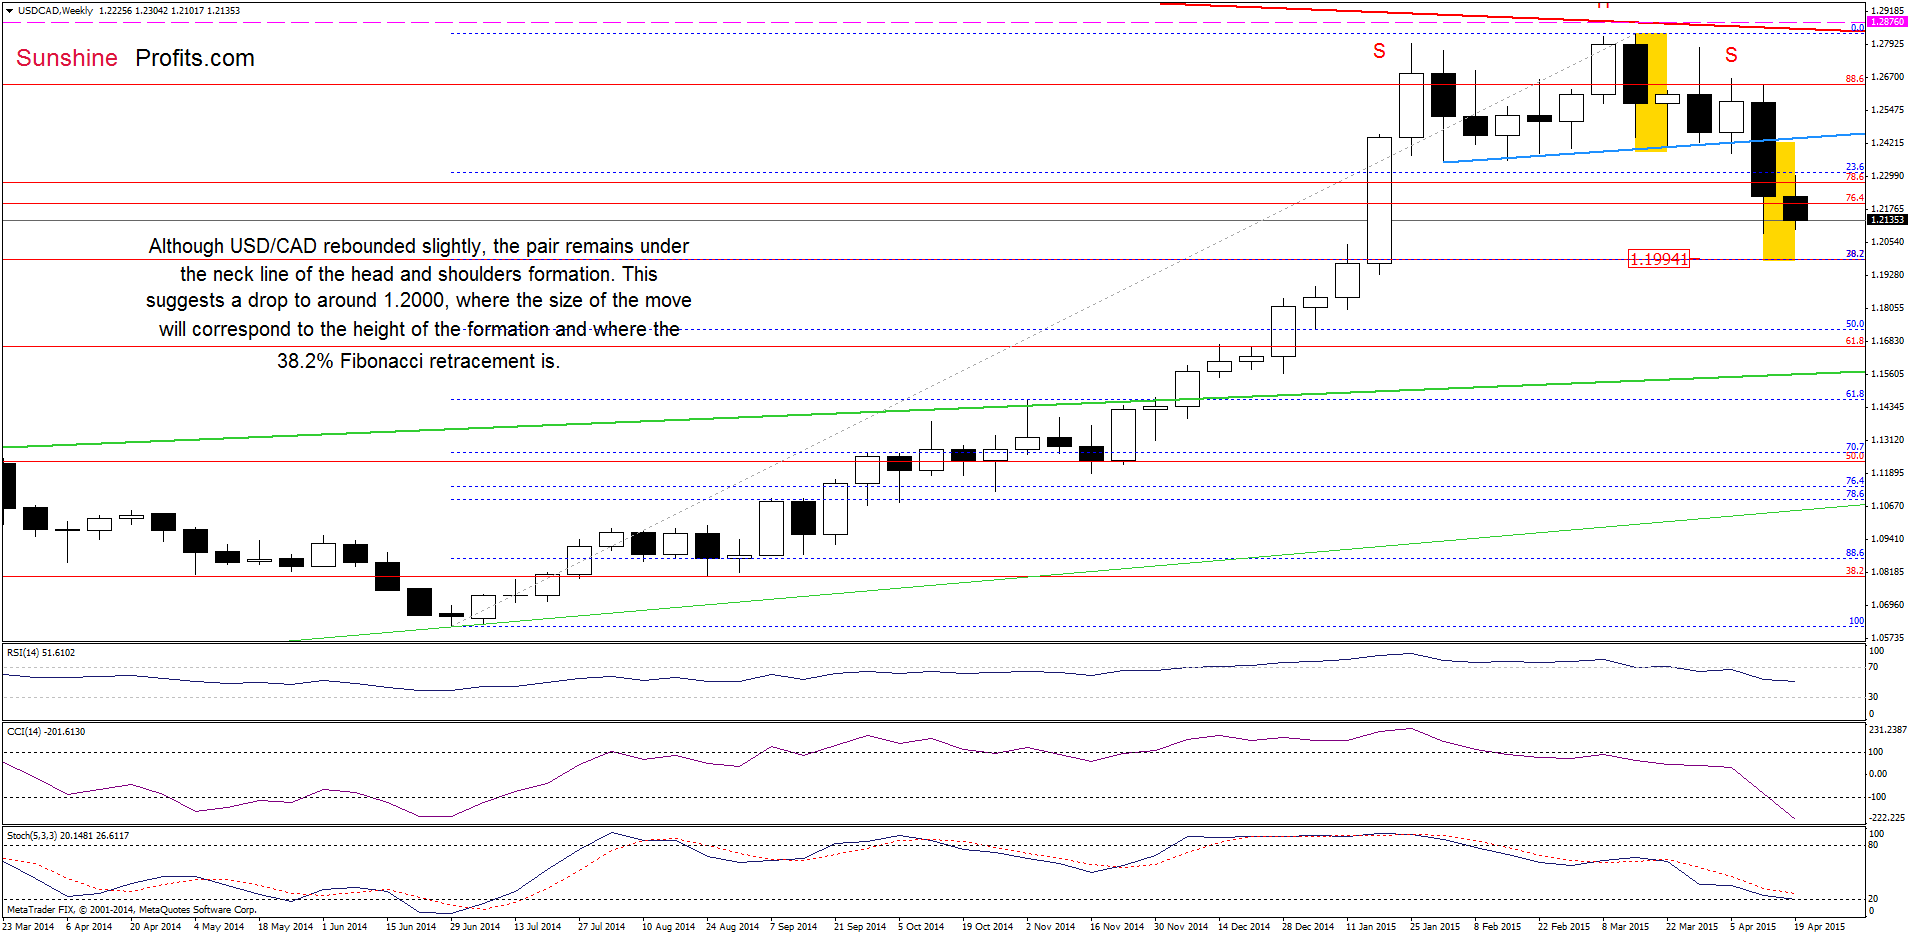
On the weekly chart we see that although USD/CAD rebounded slightly earlier his week, the pair still remains under the neck line (marked with blue) of the head and shoulders formation. This means that what we wrote last Friday is still valid:
(…) USD/CAD moved sharply lower and broke below the neck line, which suggests further correction and a drop to around 1.2000, where the size of the downward move will correspond to the height of the formation and where the 38.2% Fibonacci retracement level is.
Having said that, let’s take a closer look at the daily chart below.
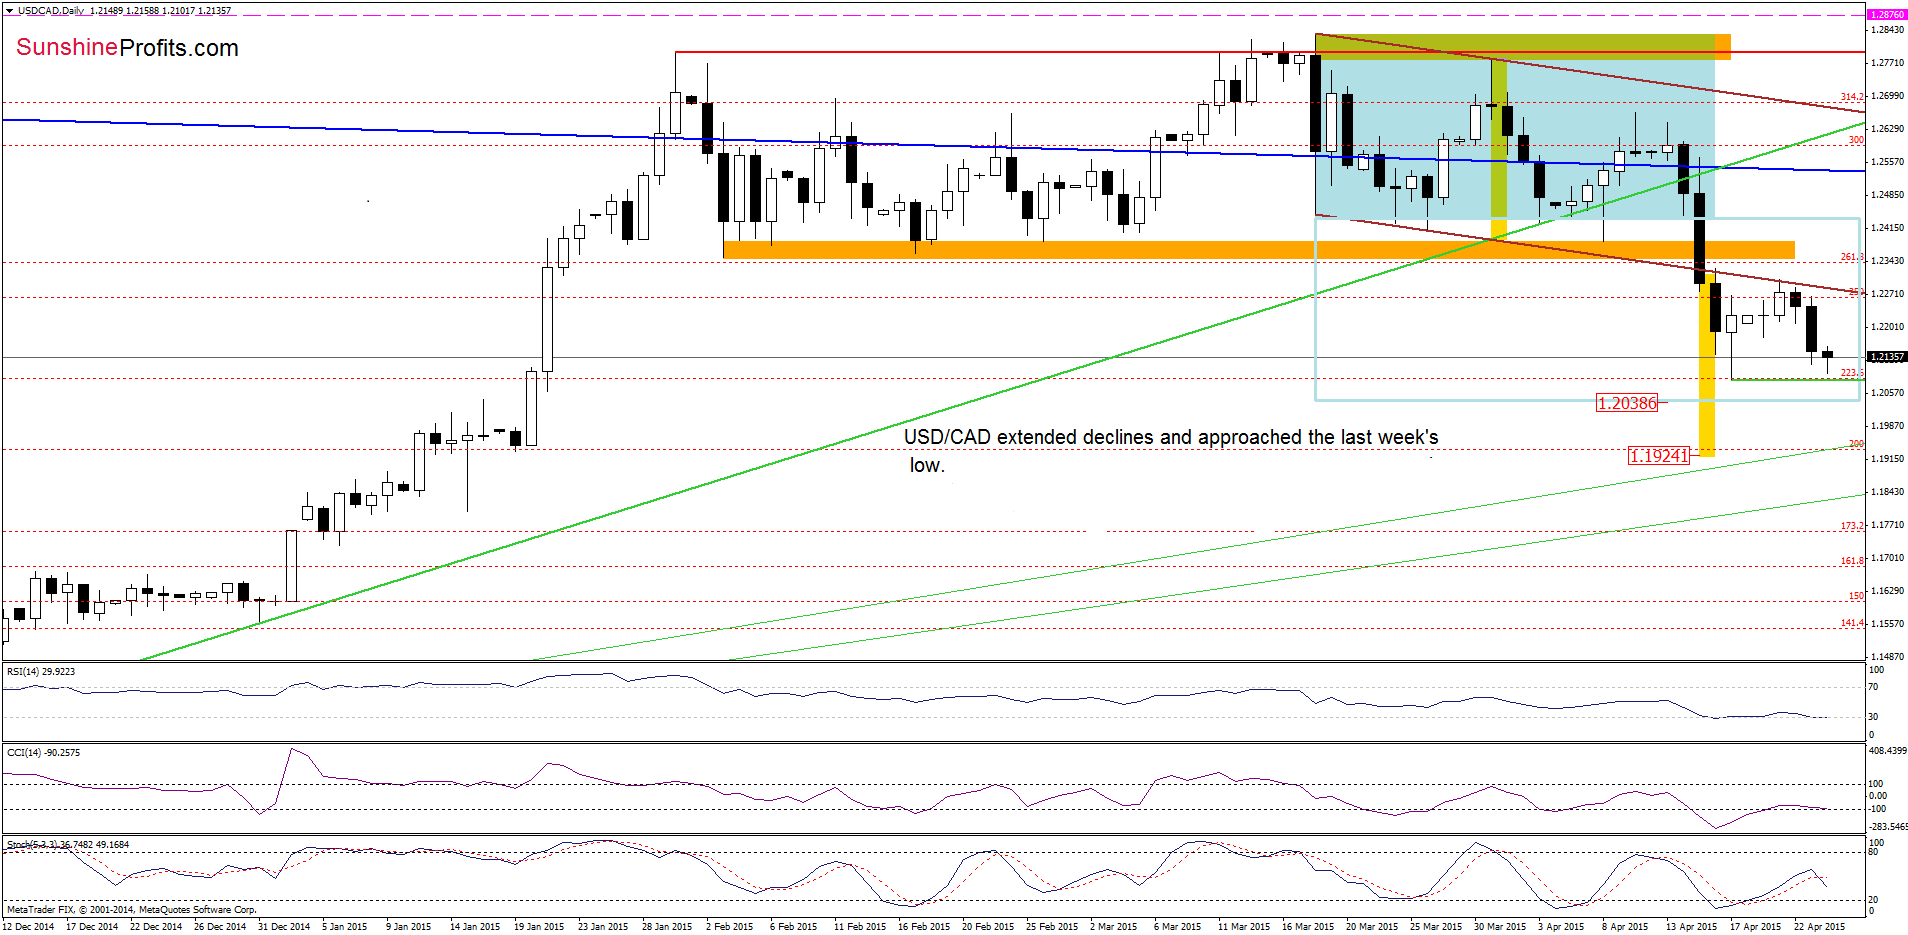
On Wednesday, we wrote:
(…) the recent upward move took USD/CAD to the lower border of the declining trend channel. As you see, this strong resistance stopped further improvement and triggered a decline earlier today. This suggests that the last upswing was nothing more than another verification of the breakdown below the lower line of the formation. If this is the case, we’ll see further deterioration and a test of the Apr low of 1.2086 in the coming days.
From today’s point of view we see that currency bears pushed the pair lower as we expected and almost touched our downside target. Taking this fact into account, we could see a rebound from here and another test of the lower border of the declining trend in the coming week. Therefore, we think that taking profits off the table (short position was opened around 1.2542) is a good idea at the moment.
Very short-term outlook: mixed
Short-term outlook: bearish
MT outlook: bearish
LT outlook: mixed
Trading position (short-term; our opinion): No positions are justified from the risk/reward perspective at the moment. We will keep you informed should anything change, or should we see a confirmation/invalidation of the above.
USD/CHF
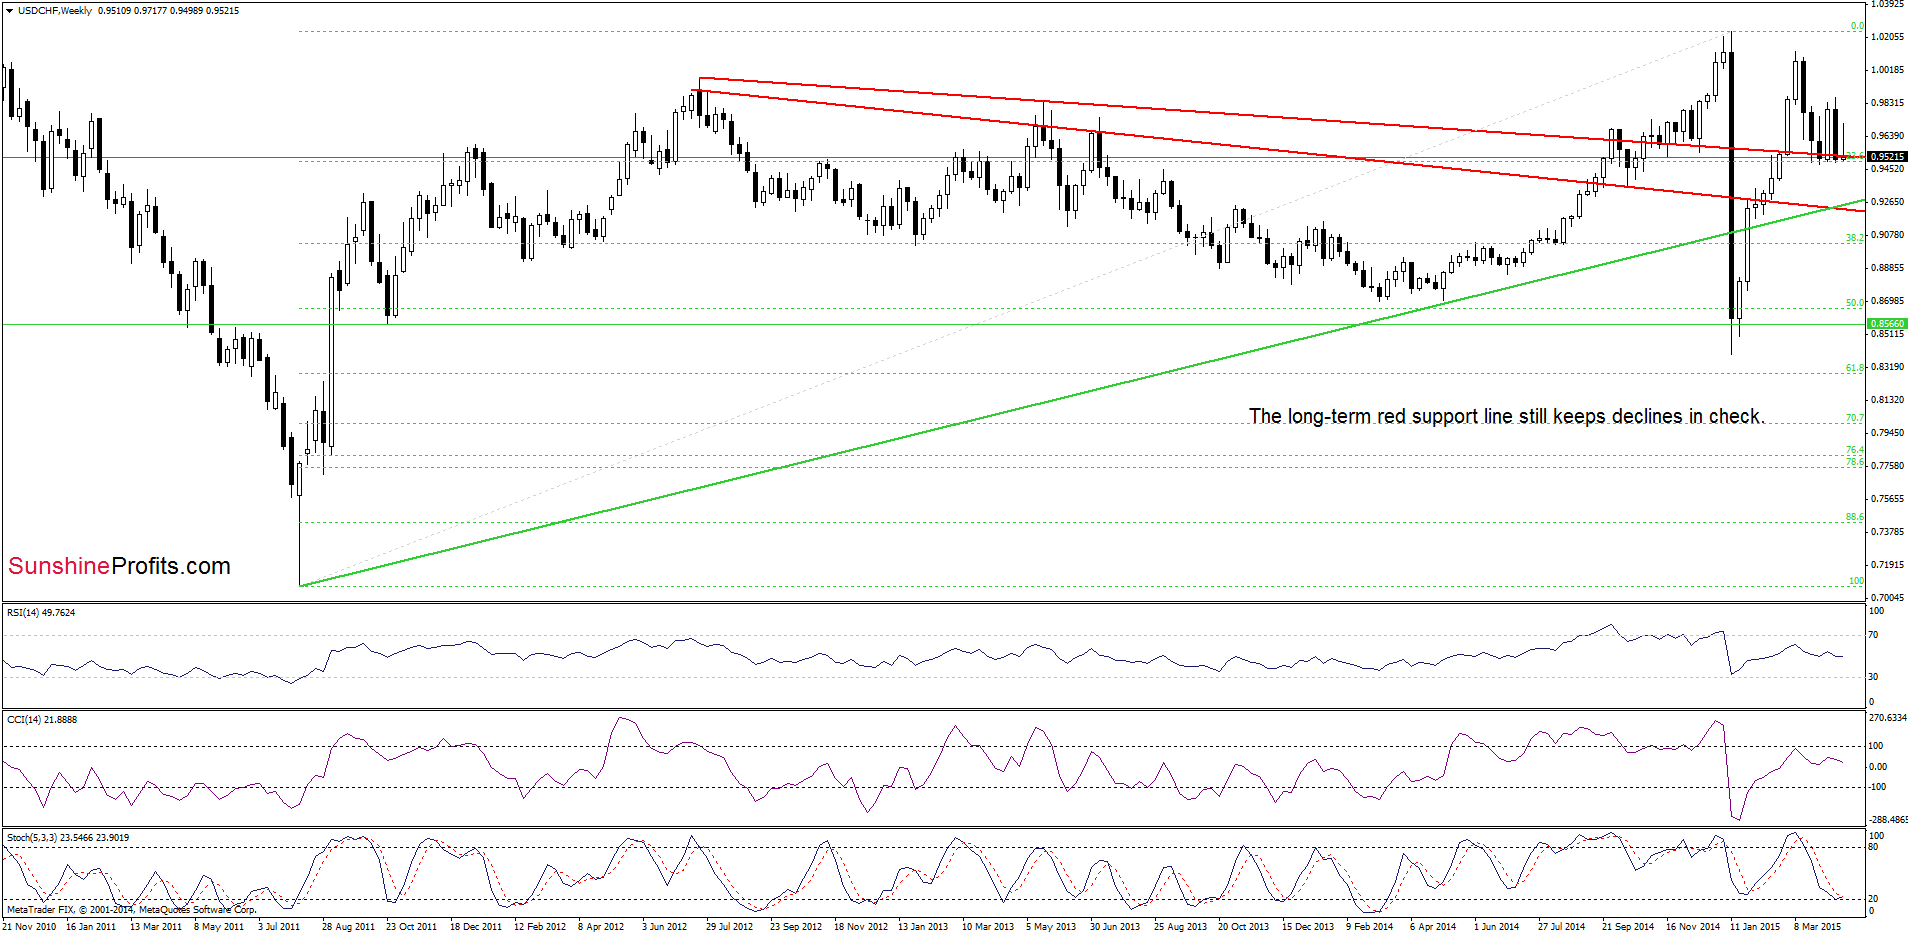
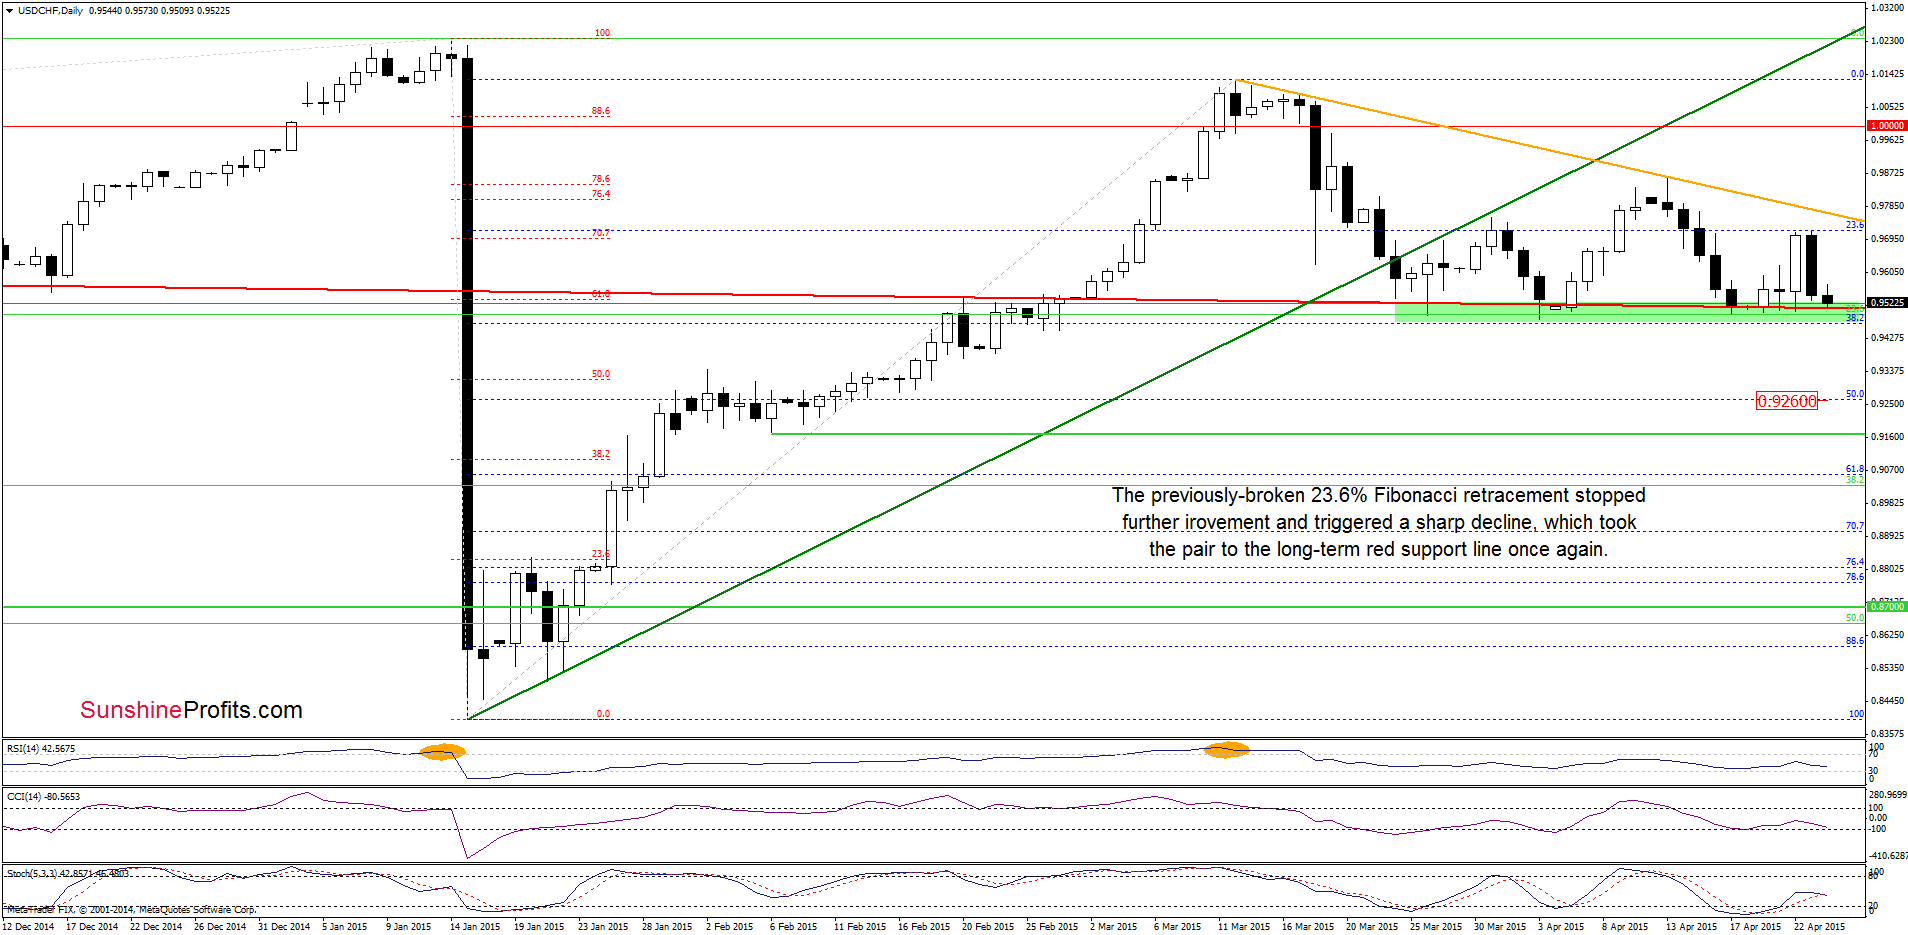
From today’s point of view, we see that the previously-broken 23.6% Fibonacci retracement stopped further improvement and triggered a sharp decline, which took the pair to the long-term red support line once again. As you see on the daily chart, this solid support has stopped declines in the previous weeks, which suggests that we’ll likely see similar price action in the coming days. If this is the case, the initial upside target would be around 0.9715, where this week’s highs are.
Very short-term outlook: mixed with bullish bias
Short-term outlook: mixed
MT outlook: mixed
LT outlook: bearish
Trading position (short-term; our opinion): No positions are justified from the risk/reward perspective at the moment. We will keep you informed should anything change, or should we see a confirmation/invalidation of the above.
AUD/USD
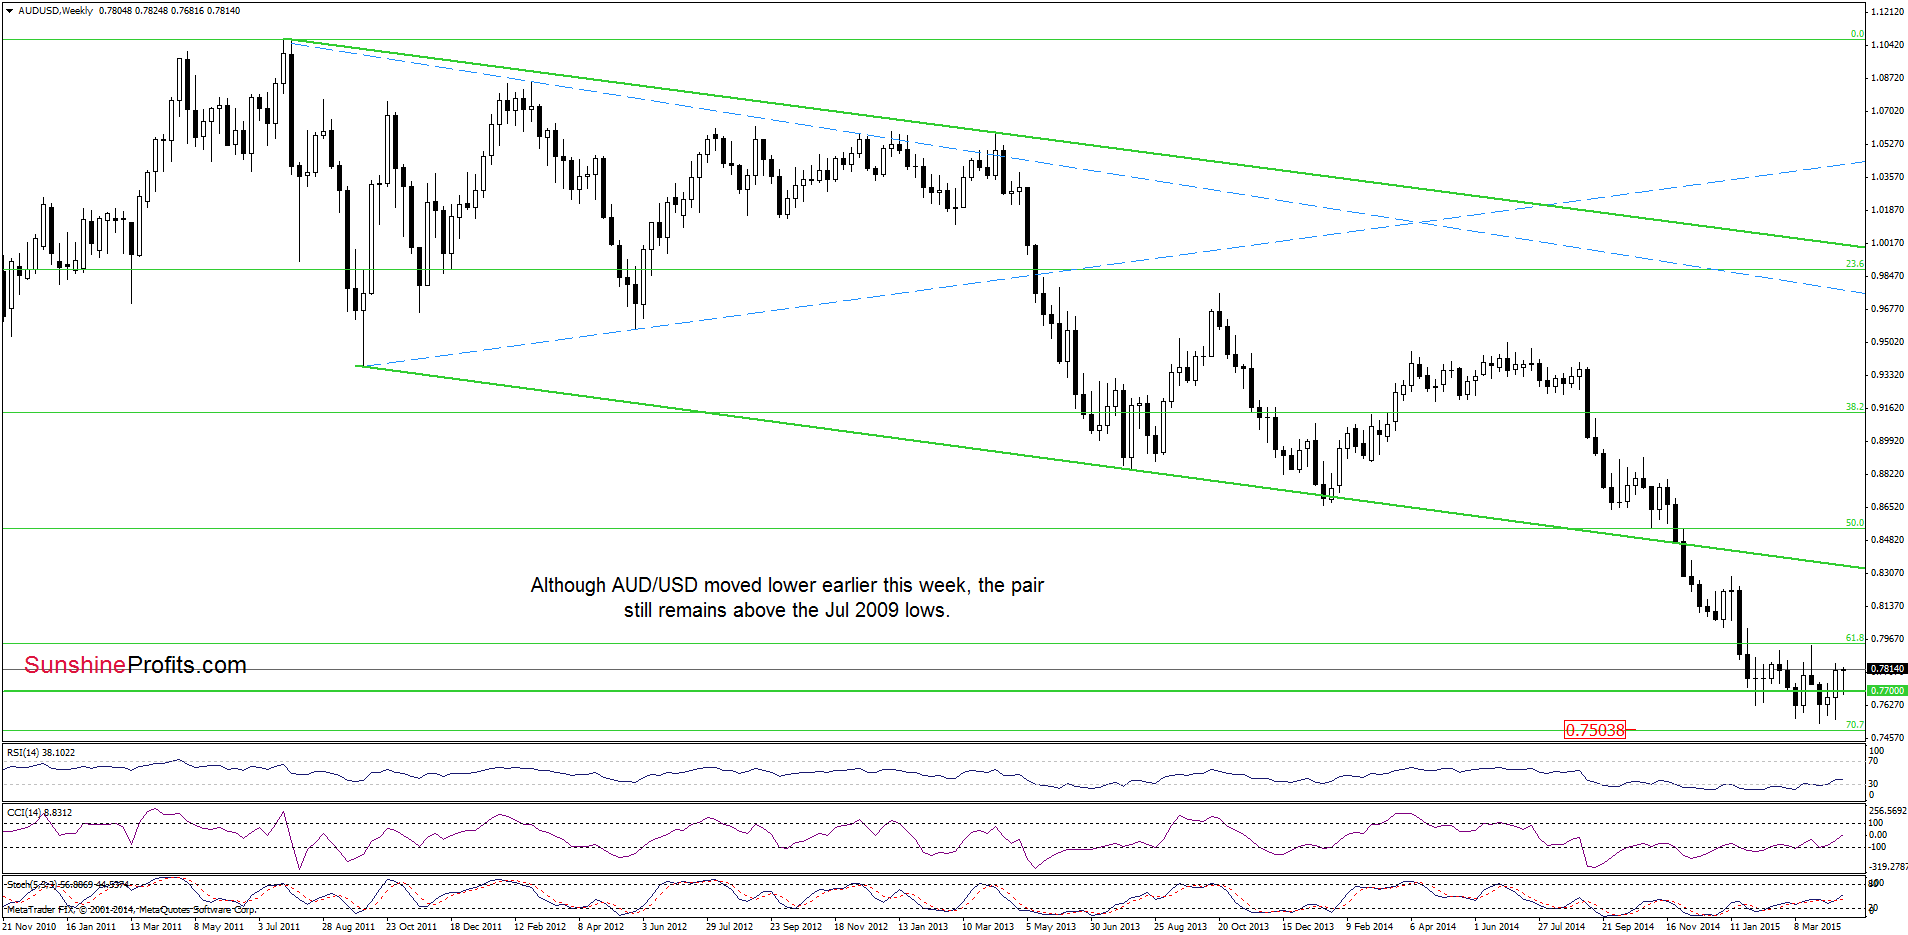
Looking at the above chart, we see that the medium-term picture has improved slightly as AUD/USD bounced off the Jul 2009 lows and approached the last week’s high.
How did this move affect the very short-term chart? Let’s take a look.
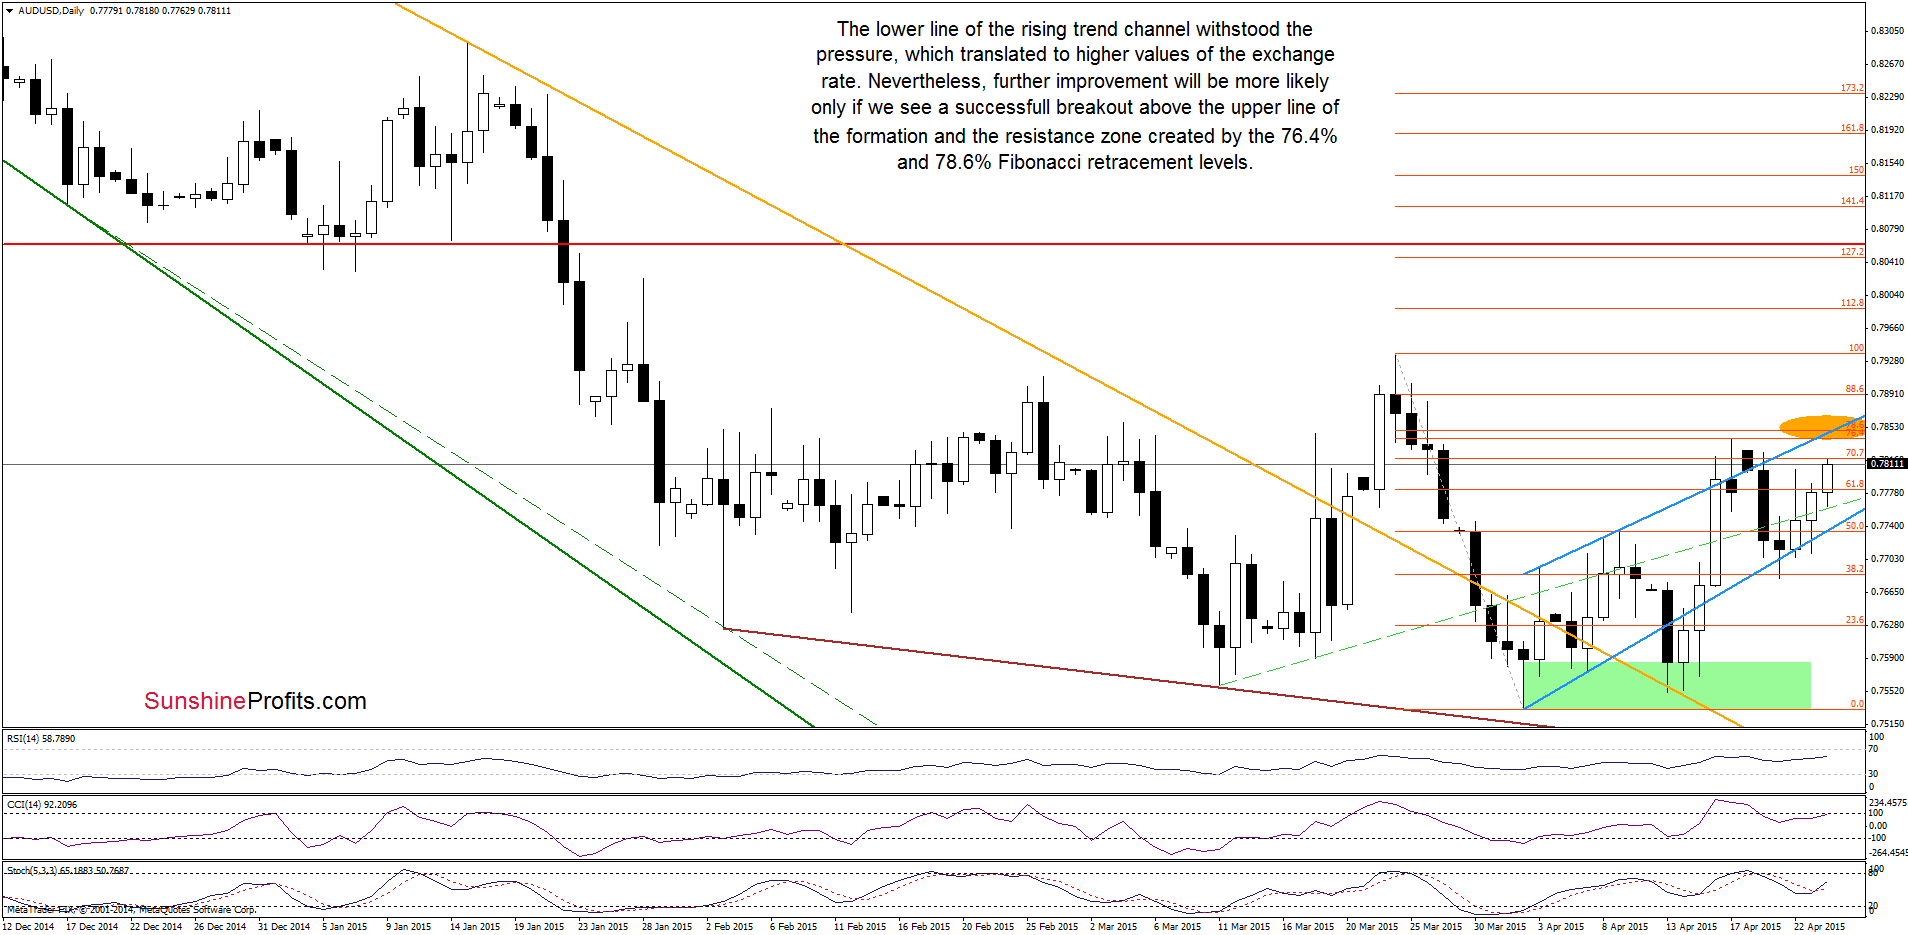
As you see on the above chart, the lower line of the rising trend channel withstood the selling pressure, which translated to higher values of the exchange rate. Although this is a positive signal, we think that further improvement will be more likely only if we see a successful breakout above the upper line of the formation, which currently intersects the resistance zone created by the 76.4% and 78.6% Fibonacci retracement levels (it stopped last week’s rally and triggered a pullback). Until this time, another test of the lower blue support line can’t be ruled out.
Very short-term outlook: mixed
Short-term outlook: mixed
MT outlook: mixed
LT outlook: mixed
Trading position (short-term; our opinion): No positions are justified from the risk/reward perspective at the moment. We will keep you informed should anything change, or should we see a confirmation/invalidation of the above.
Thank you.
Nadia Simmons
Forex & Oil Trading Strategist
Przemyslaw Radomski, CFA
Founder, Editor-in-chief
Gold & Silver Trading Alerts
Forex Trading Alerts
Oil Investment Updates
Oil Trading Alerts

