

Earlier today, the euro moved lower against the greenback as worries over the situation in Greece (there is still no agreement on economic reforms for bailout funds between Greece and its euro zone partners and the International Monetary Fund, which fuels concerns that the country could be forced out of the euro zone) weighed n investors’ sentiment. As a result, EUR/USD slipped to Friday’s low. Will we see another test of the strength of the long-term support lines in the coming week?
In our opinion the following forex trading positions are justified - summary:
- EUR/USD: none
- GBP/USD: none
- USD/JPY: none
- USD/CAD: short (stop loss order at 1.2876)
- USD/CHF: none
- AUD/USD: none
EUR/USD
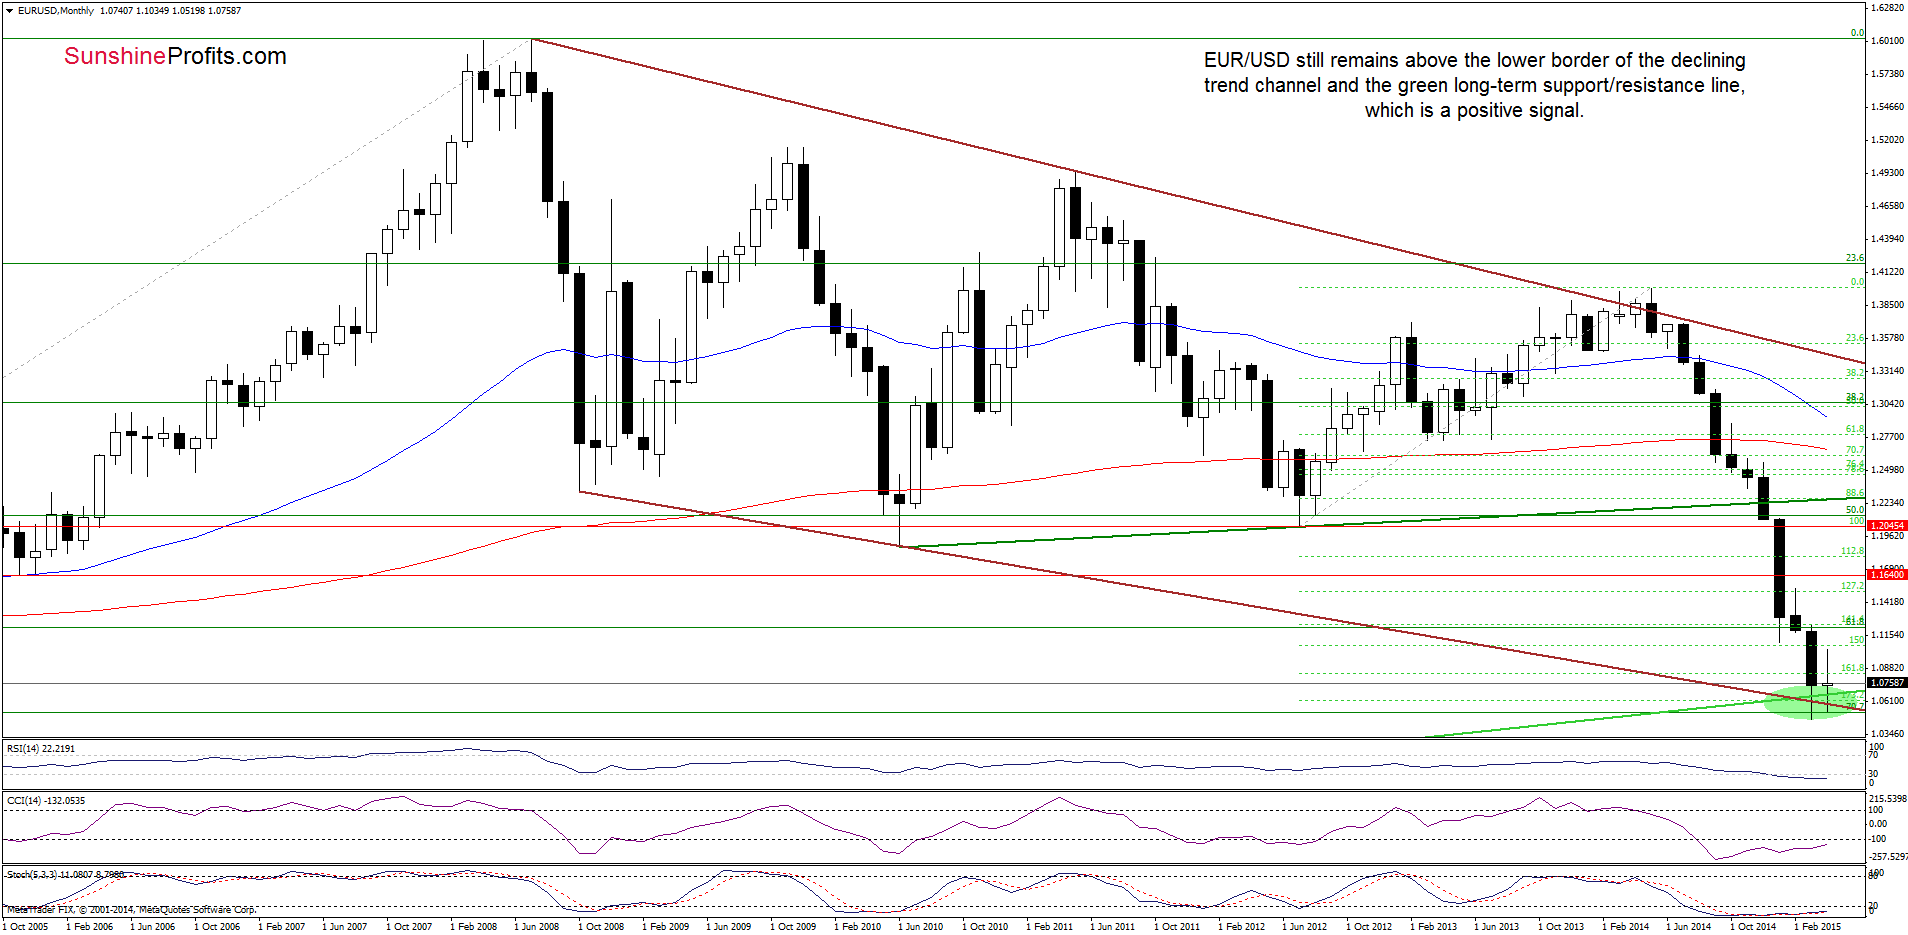
The medium-term picture hasn’t changed much as EUR/USD still remains above the lower border of the declining trend channel and the long-term green support/resistance line, which is a positive signal. Nevertheless, as long as there are no buy signals, another test of the green line (currently around 1.0650) can’t be ruled out.
Having said that, let’s examine the very short-term picture.
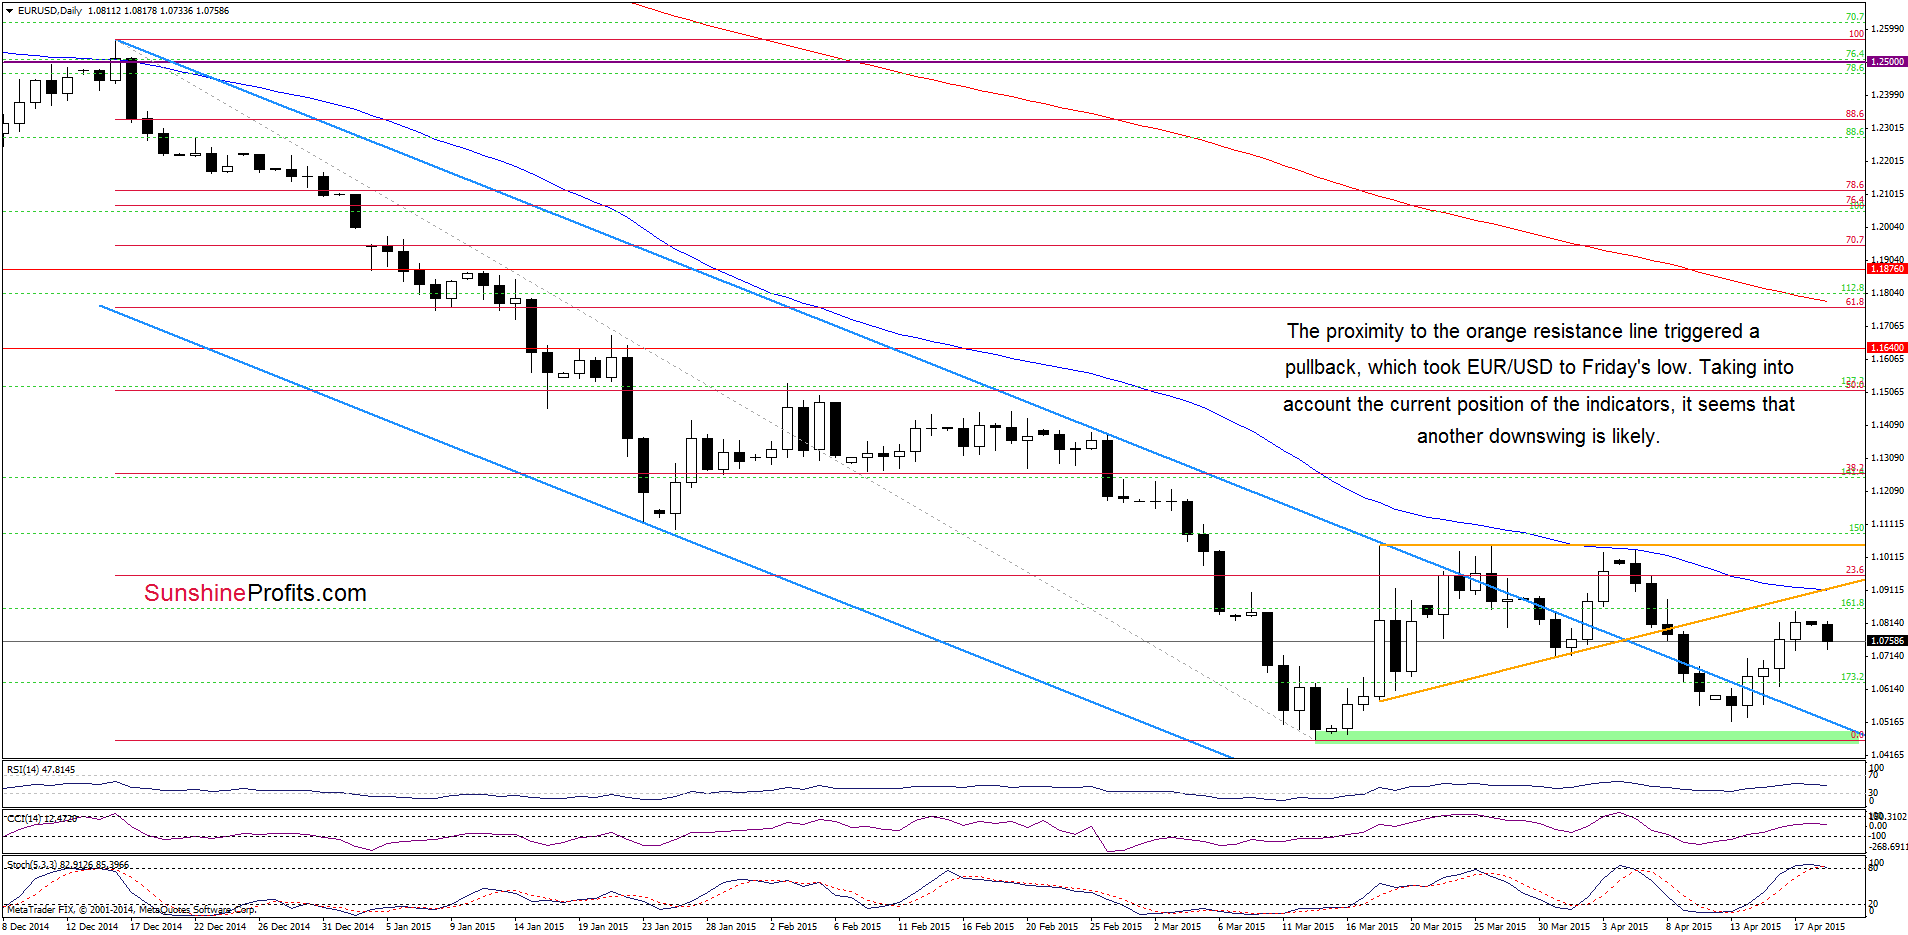
Looking at the above chart, we see that the proximity to the orange resistance line triggered a pullback, which took EUR/USD to Friday’s low. Taking this fact into account, and combining it with the current position of the Stochastic Oscillator (the indicator is very close to generate a sell signal), it seems that another downswing is likely. If this is the case, the downside target would be the above-mentioned long-term green support line.
Very short-term outlook: mixed with bearish bias
Short-term outlook: mixed
MT outlook: mixed
LT outlook: mixed
Trading position (short-term; our opinion): No positions are justified from the risk/reward perspective at the moment. We will keep you informed should anything change, or should we see a confirmation/invalidation of the above.
GBP/USD
The situation in the medium term hasn’t changed much as GBP/USD is still trading in the consolidation. Nevertheless, an invalidation of small breakdown under the lower border of the formation and its positive impact on future moves is still in effect.
Can we infer something more from the daily chart? Let’s check.
On Friday, we wrote the following:
(…) GBP/USD rebounded sharply (…) and climbed to the orange resistance zone. In the previus months this area stopped further improvement and triggered pullbacks. Taking this fact into account, we might see similar price action in the coming days. However, the current position of the indicators (in combination with the medium-term picture) suggests that currency bulls will try to push the pair higher.
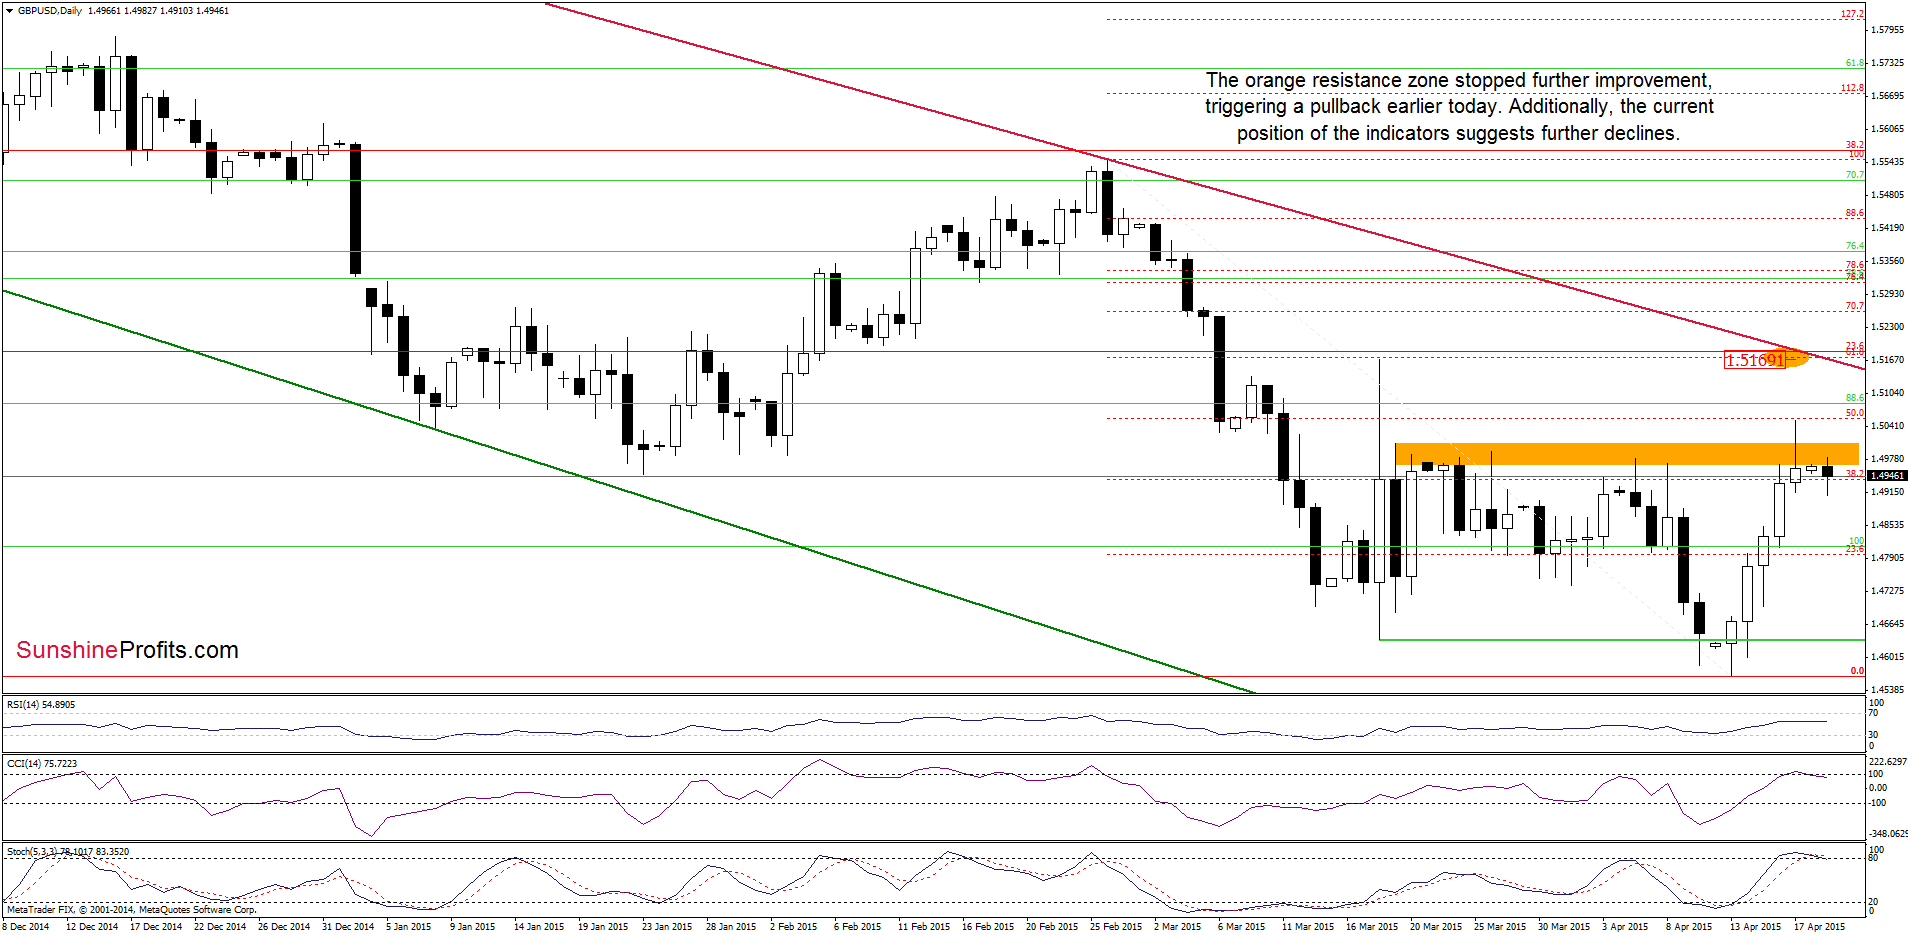
Looking at the daily chart, we see that the situation developed in line with the above scenario and currency bulls tried to push the pair above the orange zone. Despite their efforts they failed, which resulted in an invalidation of early small breakout. This negative signal triggered a pullback earlier today, which in combination with the current position of the inicators (the CCI and Stochstic Oscillator generated sell signals) suggests further deterioration in the coming day(s). If ths is the case, and GBP/USD moves lower from here, the initial dowside target would be around 1.4870, where the 38.2% Fibonacci retracement (based on the entire recent rally) is. If this support levvel is broken, we might see a drop to 1.4812 (the 50% retracement), 1.4754 (the 61.8% retracement) or even to 1.4710, where the 70.7% retracement is.
Very short-term outlook: bearish
Short-term outlook: mixed
MT outlook: mixed
LT outlook: mixed
Trading position (short-term; our opinion): No positions are justified from the risk/reward perspective at the moment. We will keep you informed should anything change, or should we see a confirmation/invalidation of the above.
USD/JPY
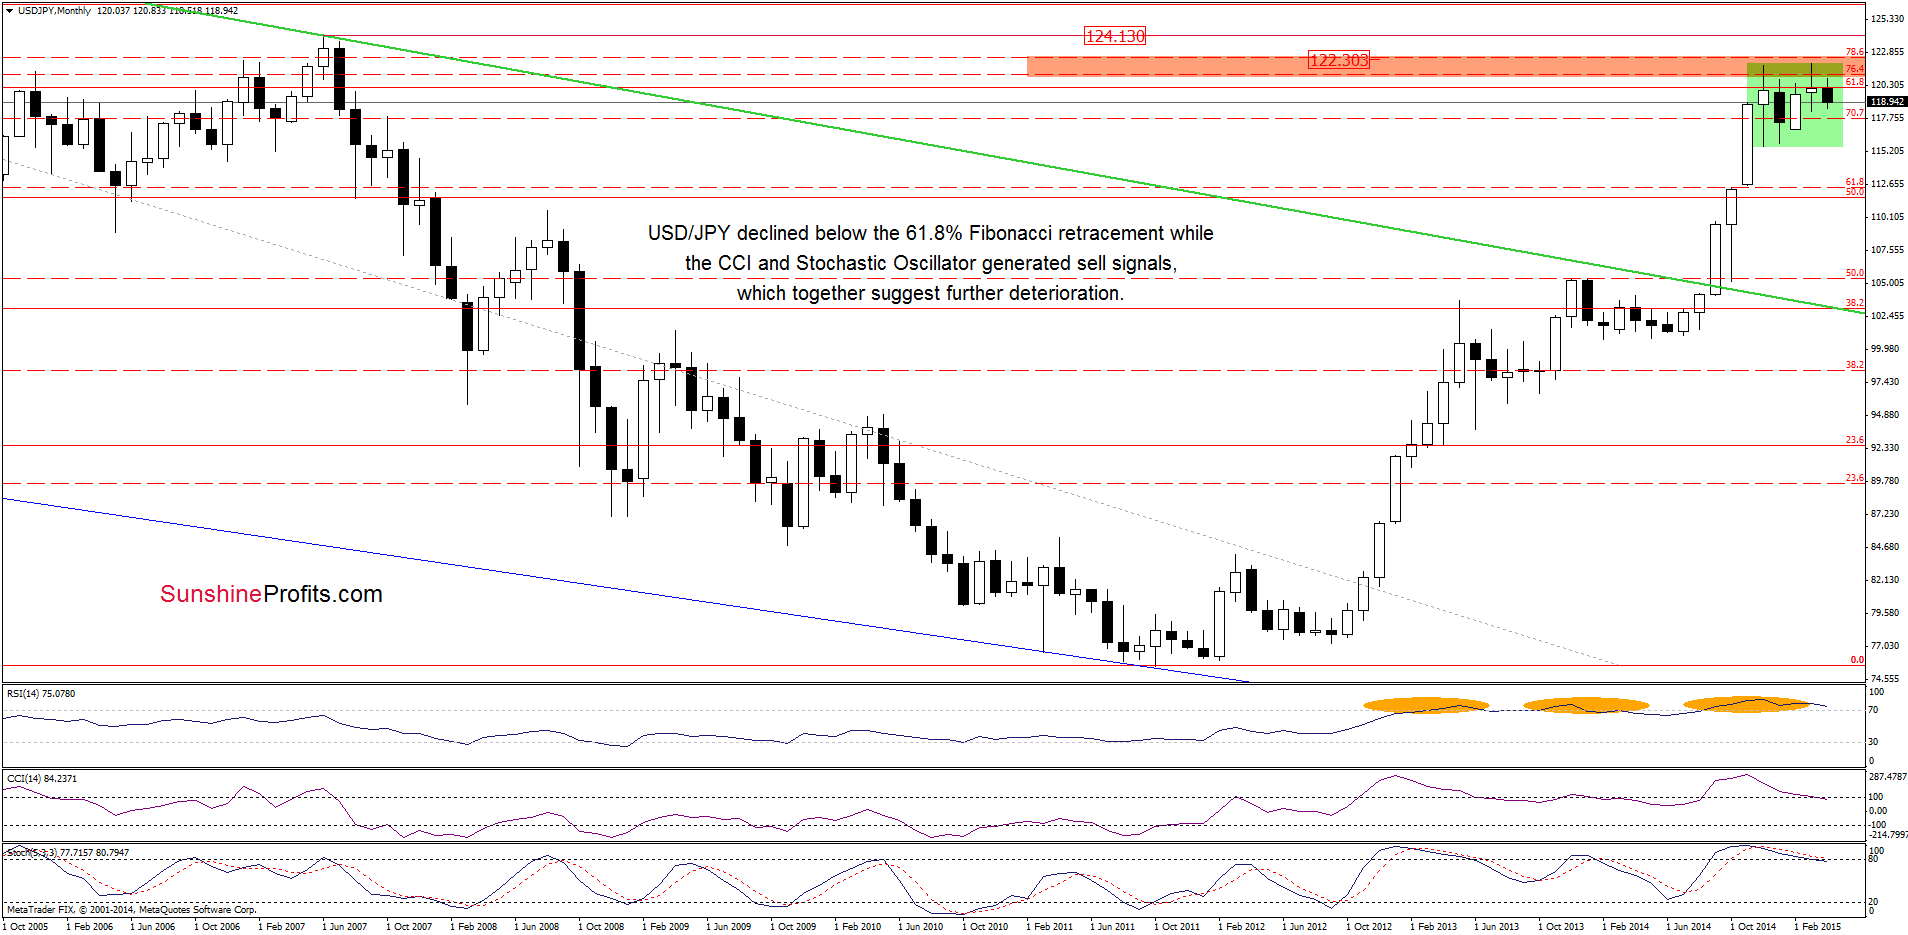
The situation in the medium term remains almost unchanged as USD/JPY is still trading in a consolidation (between the Dec high and low) under the 61.8% Fibonacci retracement level (based on the entire 1998-2011 declines). Nevertheless, we should keep in mind that sell signals generated by the indicators remain in place, supporting the bearish case at the moment.
Will we see further deterioration in the coming week? Let’s take a closer look at the daily chart and find out.
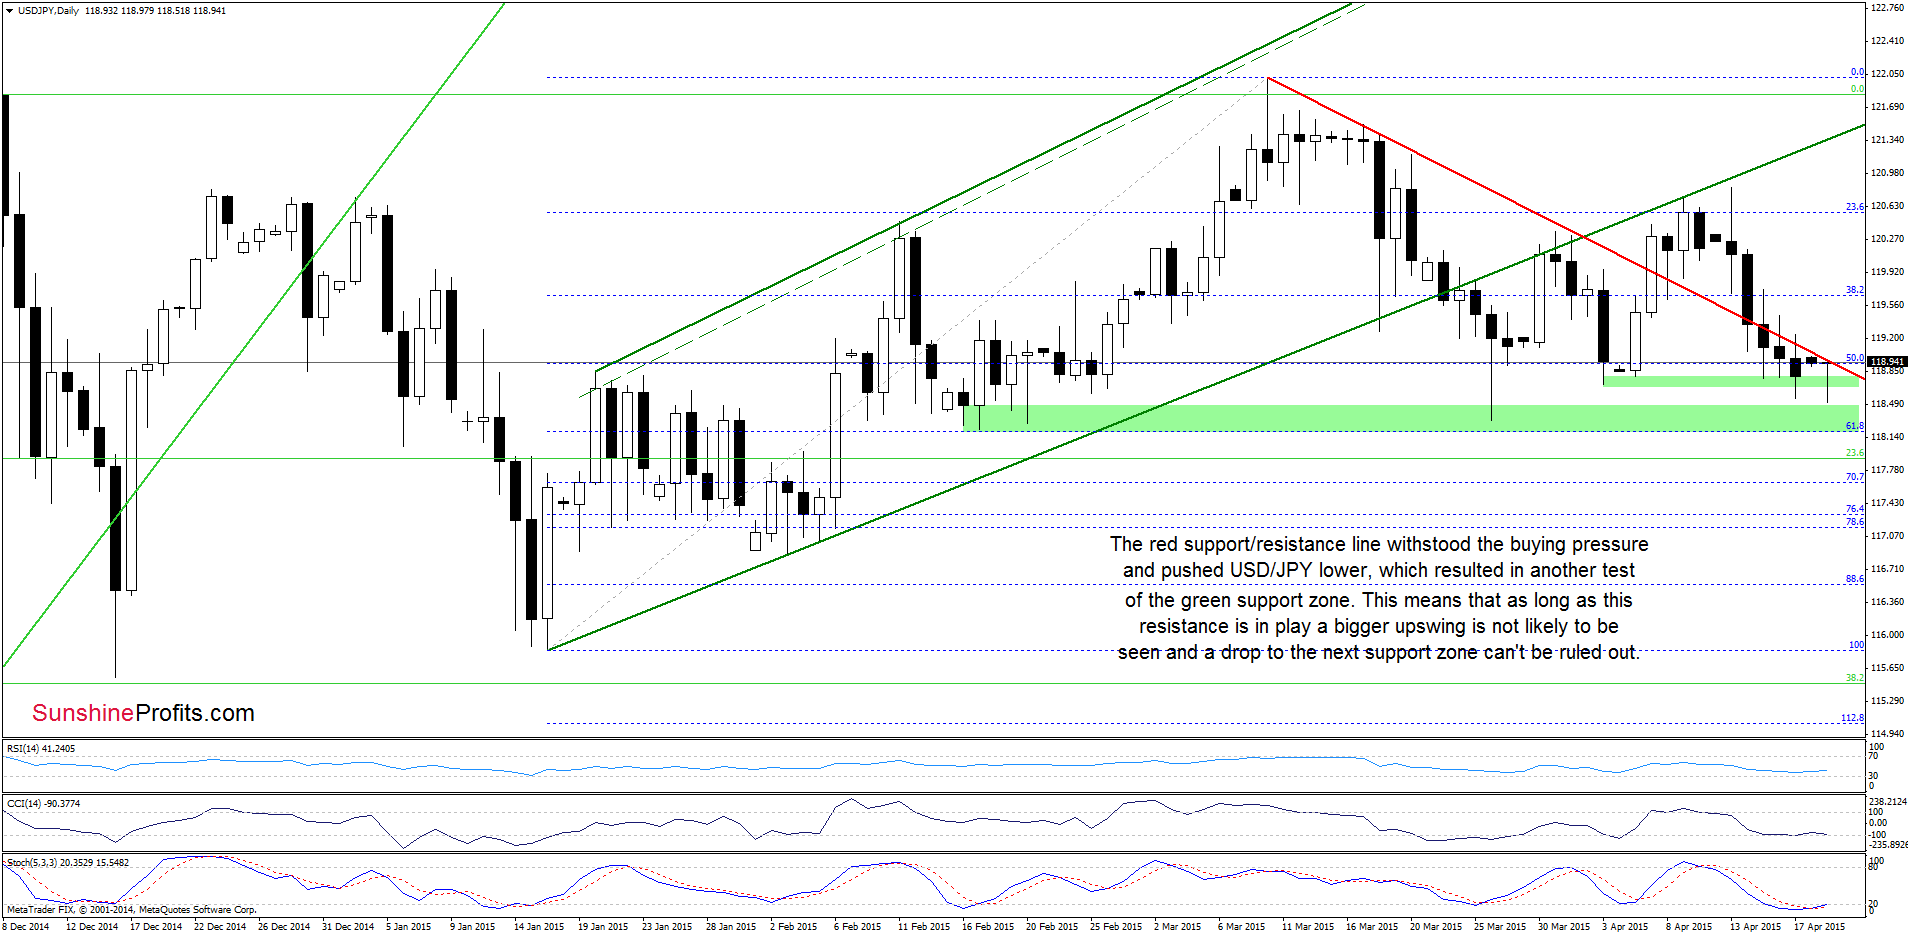
As you see on the above chart, the red support/resistance line withstood the buying pressure once again and pushed USD/JPY lower earlier today. With this downswing the pair re-tested the green support zone, which triggered another rebound. Taking into account the current position of the inicators (the CCI and Stochstic Oscillator generated buy signals) it seems that currency bulls will try to break above the red line in the coming day(s). Nevertheless, even if we see a comeback above it, we believe that as long as there is no daily close above the red line a bigger upswing is not likely to be seen and a drop to the next support zone (based on the Feb, March lows and the 61.8% Fibonacci retracement) can’t be ruled out.
Very short-term outlook: mixed with bullish bias
Short-term outlook: mixed
MT outlook: mixed
LT outlook: bullish
Trading position (short-term; our opinion): No positions are justified from the risk/reward perspective at the moment. We will keep you informed should anything change, or should we see a confirmation/invalidation of the above.
Thank you.
Nadia Simmons
Forex & Oil Trading Strategist
Przemyslaw Radomski, CFA
Founder, Editor-in-chief
Gold & Silver Trading Alerts
Forex Trading Alerts
Oil Investment Updates
Oil Trading Alerts

