

On Friday, official data showed that U.K. industrial production increased only by 0.1% in February, missing analysts’ forecast for a 0.4% gain. As a result, GBP/USD hit a fresh 2015 low. Earlier today, the exchange rate extended losses and slipped below 1.4600. Will we see further deterioration and a drop to 1.4510 in the coming week?
In our opinion the following forex trading positions are justified - summary:
- EUR/USD: none
- GBP/USD: none
- USD/JPY: none
- USD/CAD: short (stop loss order at 1.2876)
- USD/CHF: none
- AUD/USD: none
EUR/USD
On Friday, we wrote the following:
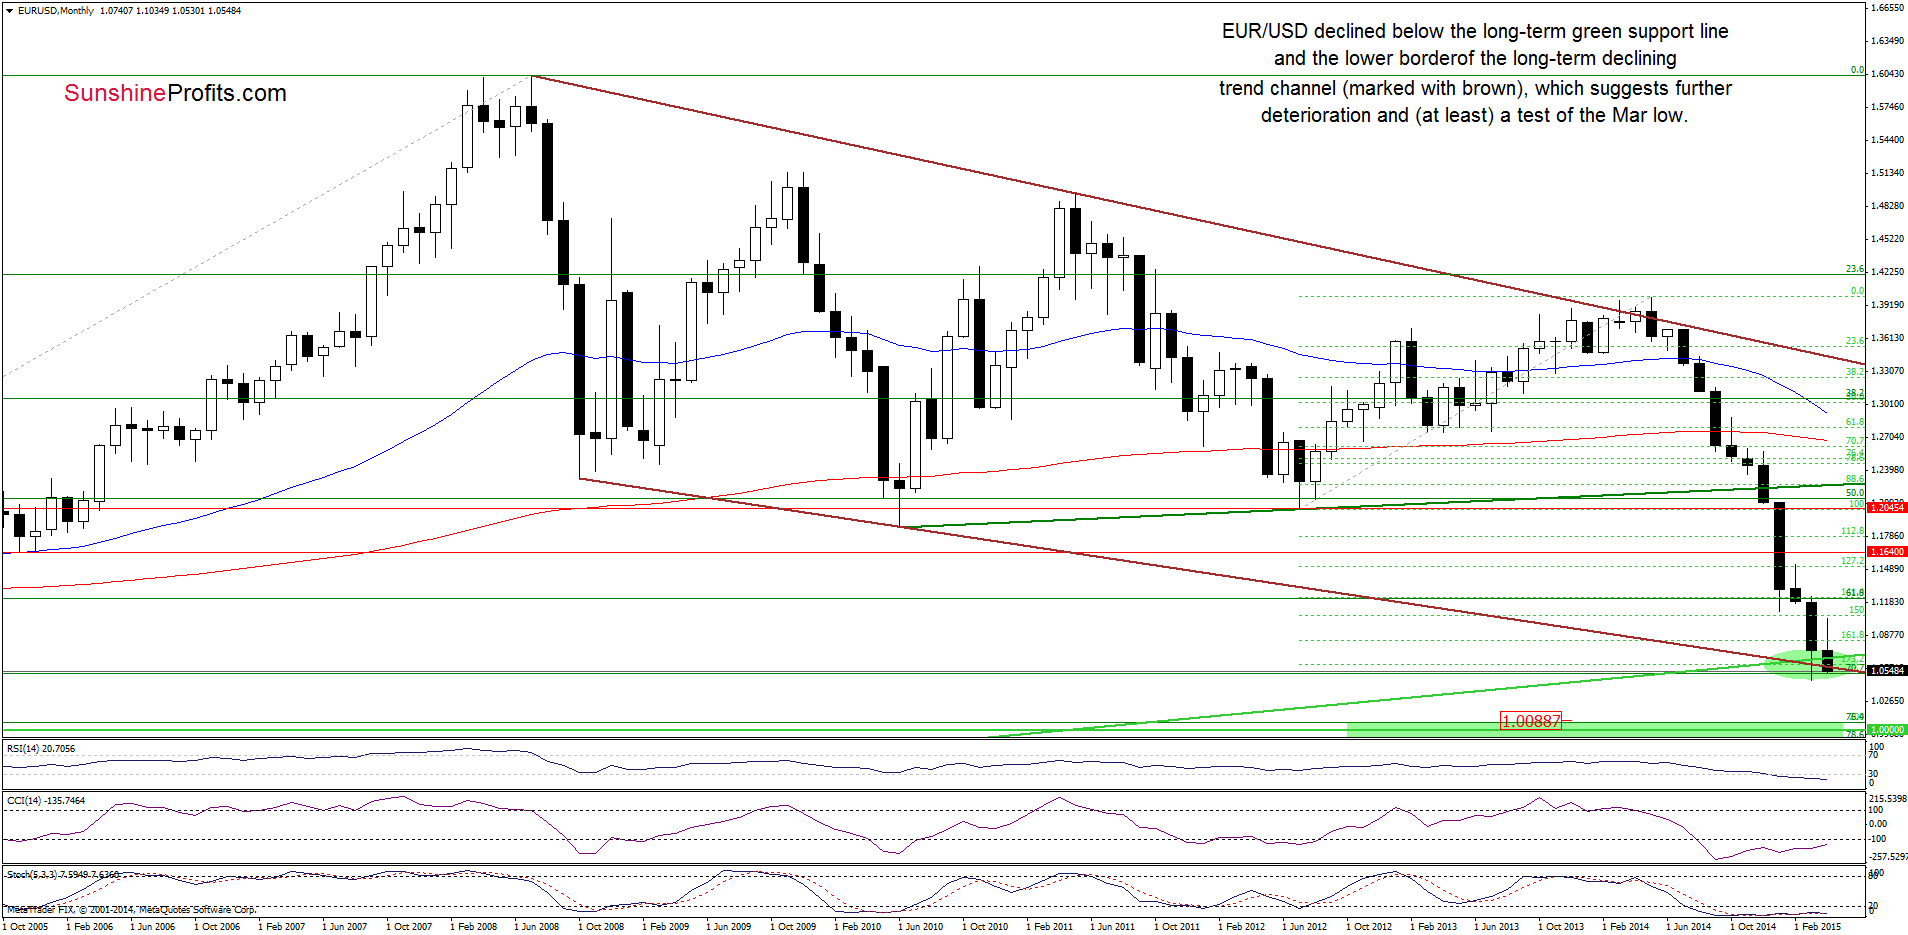
(…) EUR/USD extended declines and dropped below the long-term green support/resistance line and reached the lower border of the long-term declining trend channel (marked with brown)(…) if it is broken, we’ll see a drop to the 70.7% Fibonacci retracement (…)
Looking at the above chart, we see that the siuation developed in line with the above-mentioned scenario and EUR/USD reached our downside target earlier today. Although the pair coud rebound from here, it seems that a test of the last mont’s low is more likely. Why? Let’s take a look at the daily chart and find out.
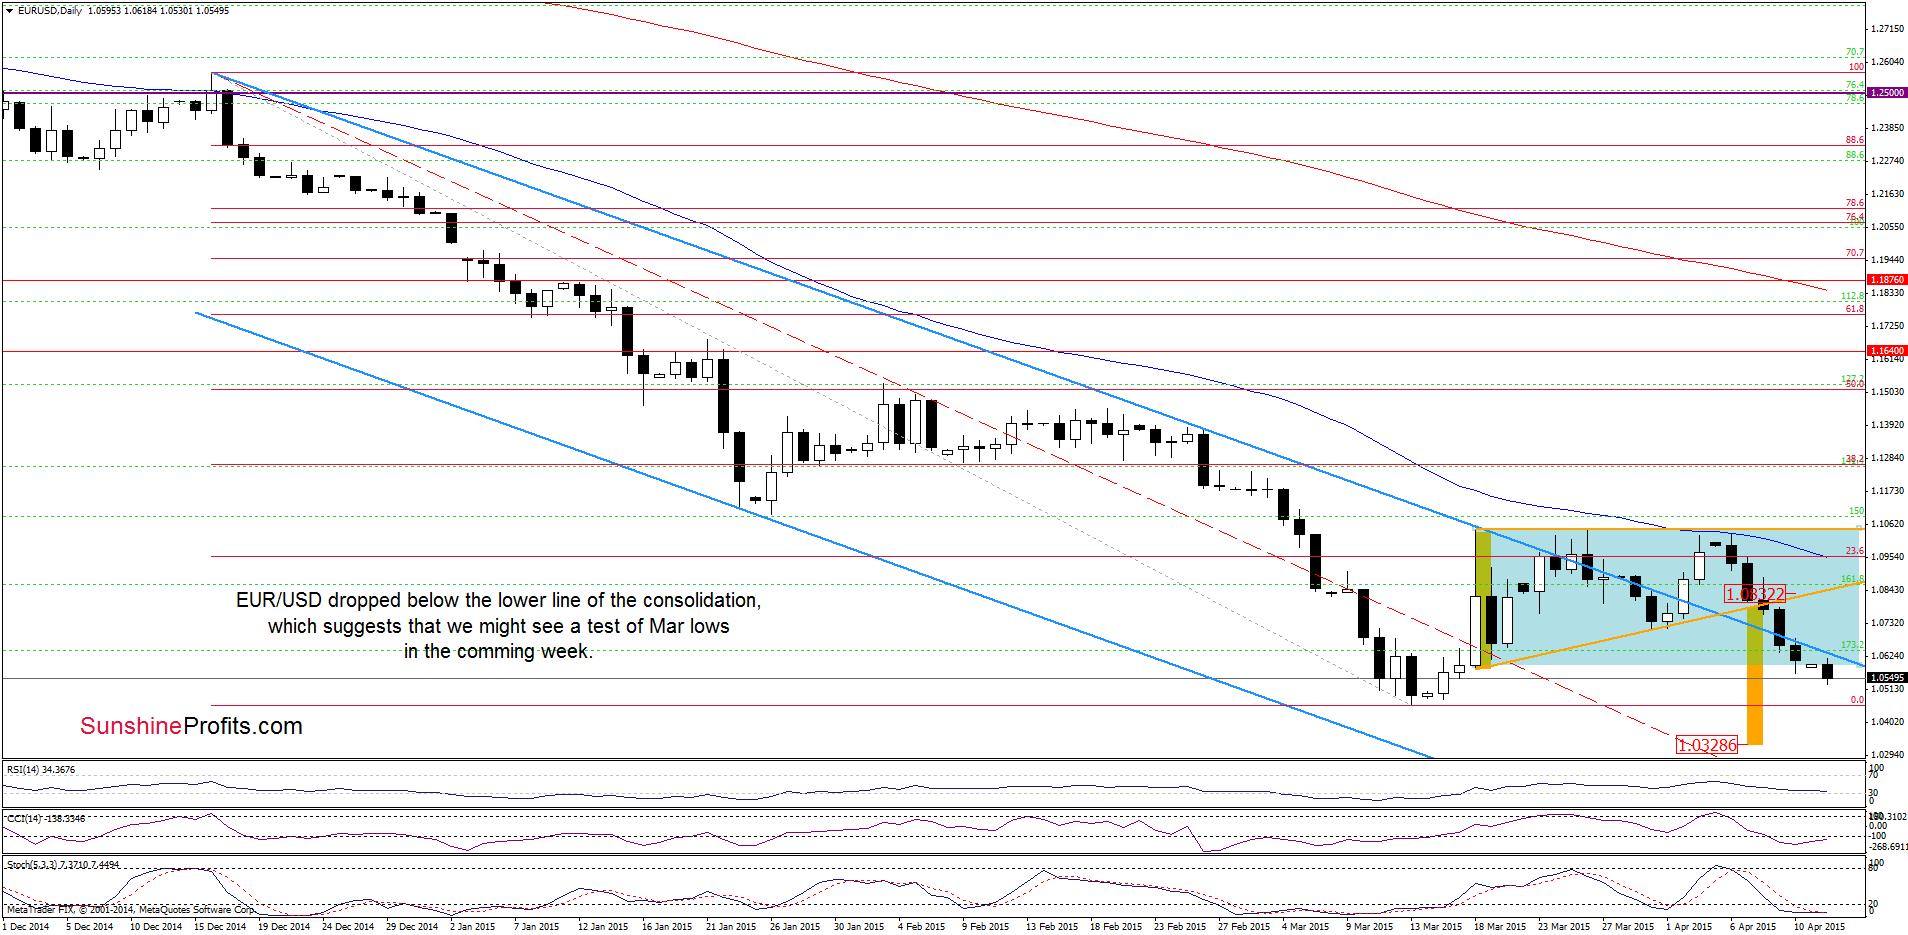
As you see on the above chart, the situation in the very short term has deteriorated as EUR/USD declined below the lower border of the consolidation. Taking his event into account, we believe that our last commentary on this currency pair is up-to-date:
(…) EUR/USD reached the lower line of the consolidation. (…) if the pair moves lower from here, we’ll see a breakdown below the border of the formation, which will trigger a test the March lows in the coming days. (…) Which scenario is more likely? Taking into account the current position of the indicators (sell signals remain in place) it seems that currency bears will push the pair lower.
Very short-term outlook: bearish
Short-term outlook: mixed
MT outlook: mixed
LT outlook: mixed
Trading position (short-term; our opinion): No positions are justified from the risk/reward perspective at the moment. We will keep you informed should anything change, or should we see a confirmation/invalidation of the above.
GBP/USD
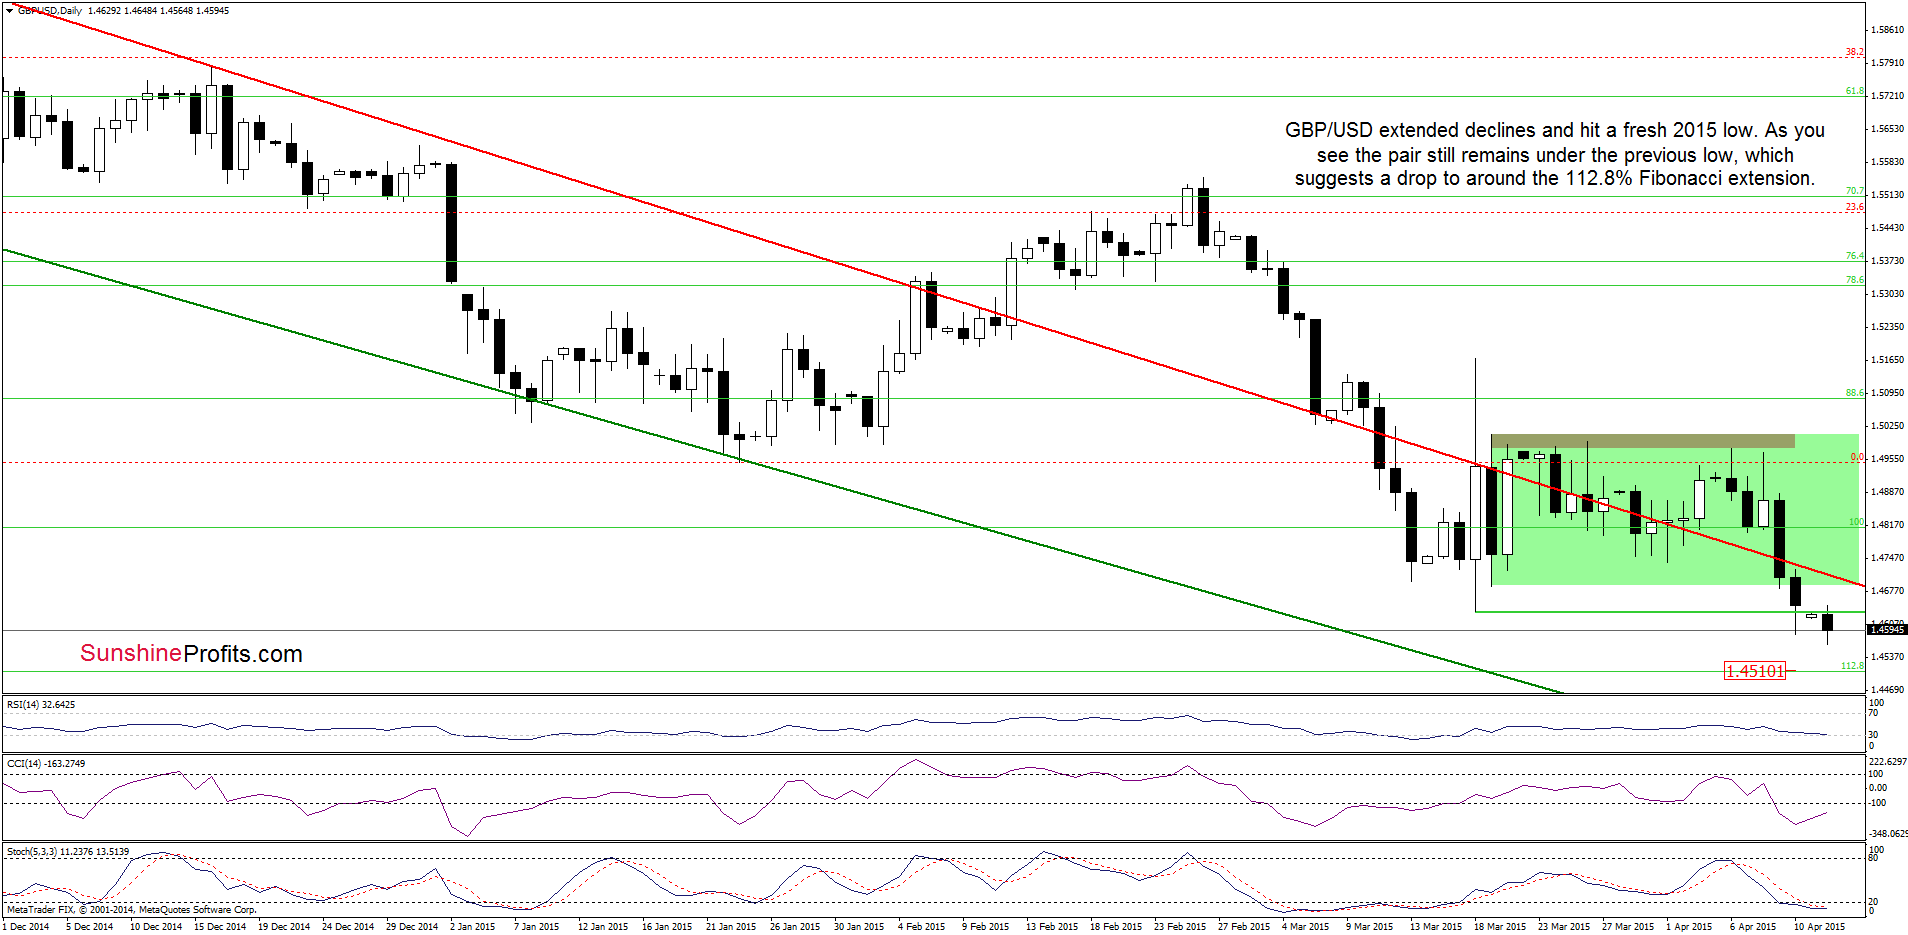
From todays point of view, we see that GBP/USD extended losses and hit a frsh 2015 low earlier today. Although the pair rebounded slightly, it is still trading under the previous lows, which suggests further deterioration and a drop to the nearest support level (the 112.8% Fibonacci extension at 1.450).
What could happen if this support level is broken? Let’s take a look at the weekly chart and find out.
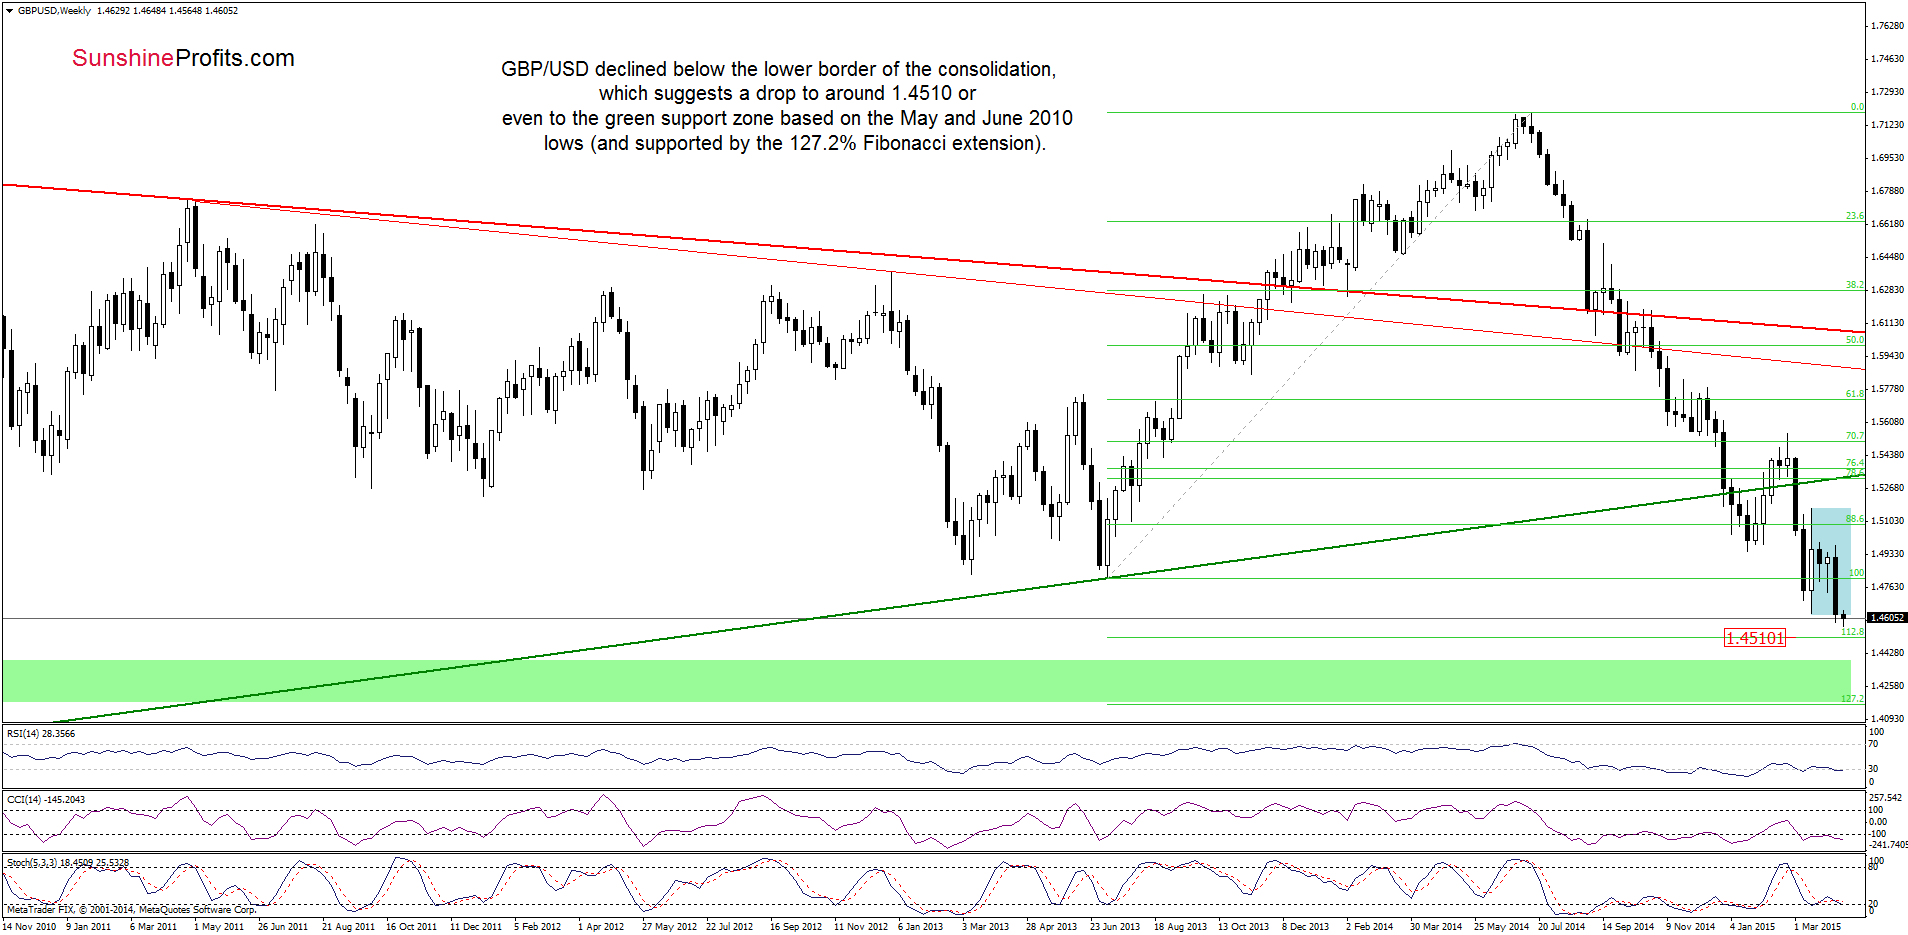
On the above chart we see that currecy bears pushed the exchange declined under the lower line of the consolidation, which means that we could see a decline even to the green support zone created by the Nay and June 2010 lows and reinforced by the 127.2% Fibonacci extension.
Very short-term outlook: bearish
Short-term outlook: mixed
MT outlook: mixed
LT outlook: mixed
Trading position (short-term; our opinion): No positions are justified from the risk/reward perspective at the moment. We will keep you informed should anything change, or should we see a confirmation/invalidation of the above.
AUD/USD
In our previous Forex Trading Alert, we wrote:
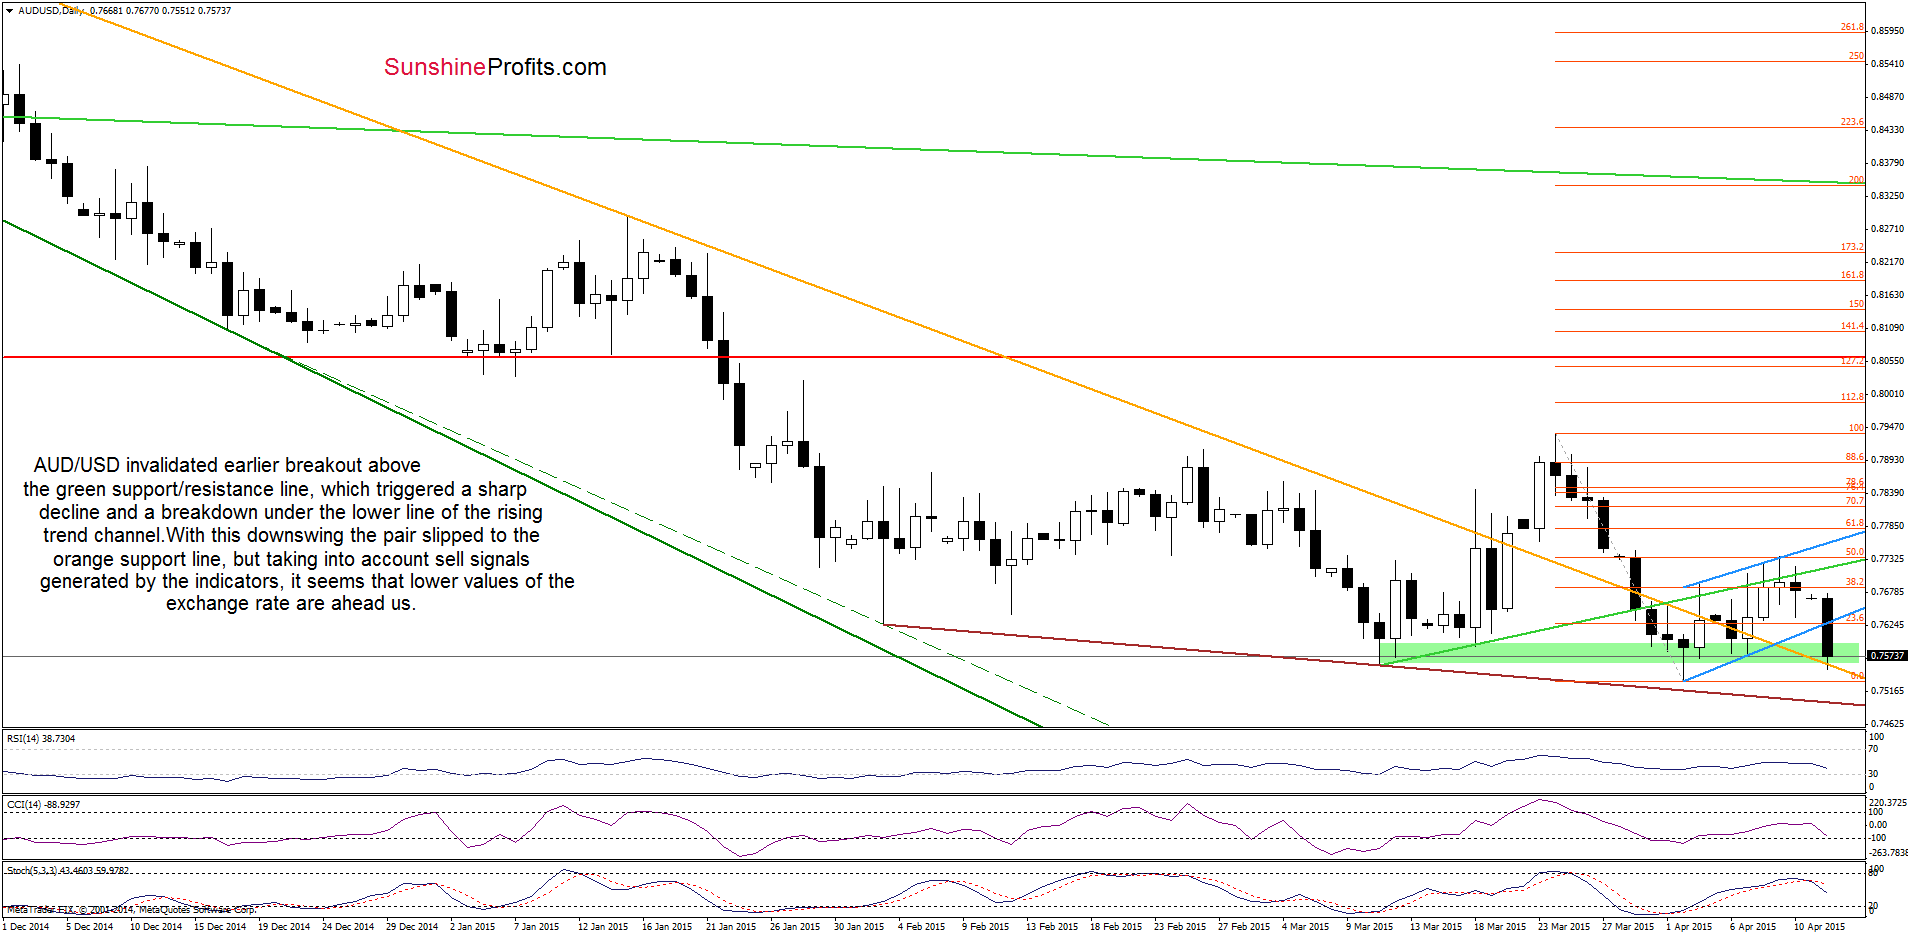
(…) the 50% Fibonacci retracement in combination with the upper line of the rising trend channel (marked with blue) stopped further improvement, triggering a pullback, which invalidated earlier breakout above the green support/resistance line. This suggests that we could see a test of the lower line of the formation in the coming days
As you see on the above chart, currency bears not only pushed the exchange rate to our initial downside target, but also managed to push AUD/USD below it. With this downswing, the exchange rate declined to the previously-broken orange support/resistance line. Although the pair could rebound from here, a sell signal generated by the Stochastic Oscillator suggests that lower values of the exchange rate are still ahead us. If this is the case and AUD/USD drop under the orange line, we’ll see a test of the recent low or even a drop to the 70.7% Fibonacci retracement around 0.7504 (marked on the weekly chart below).
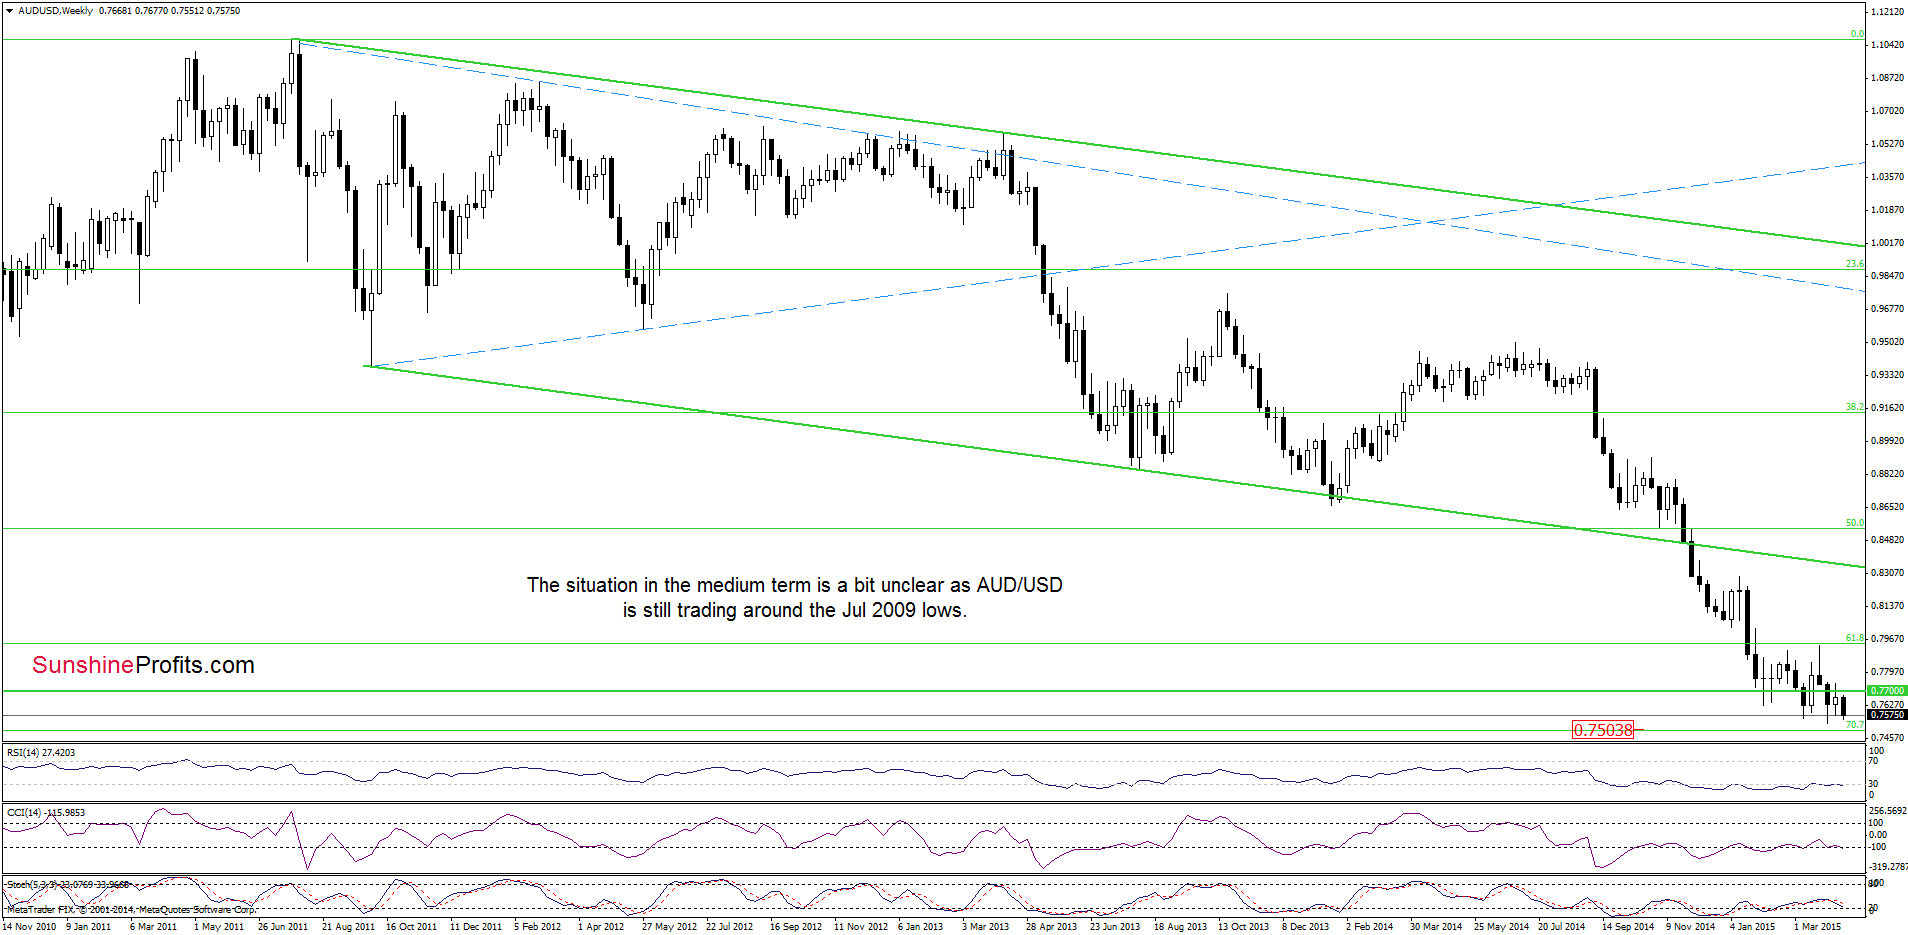
Please note that the medium-term outlook has deteriorated as AUD/USD declined below the Jul 2009 lows once again, which is a bearish signal, which suggests further deterioration in the coming week.
Very short-term outlook: mixed with bearish bias
Short-term outlook: mixed
MT outlook: mixed
LT outlook: mixed
Trading position (short-term; our opinion): No positions are justified from the risk/reward perspective at the moment. We will keep you informed should anything change, or should we see a confirmation/invalidation of the above.
Thank you.
Nadia Simmons
Forex & Oil Trading Strategist
Przemyslaw Radomski, CFA
Founder, Editor-in-chief
Gold & Silver Trading Alerts
Forex Trading Alerts
Oil Investment Updates
Oil Trading Alerts

