

Yesterday, the Reserve Bank of Australia held its benchmark interest rate at 2.25%, while the Australian Bureau of Statistics showed that retail sales rose 0.7% in February (beating expectations for a 0.4% gain), which gave the Aussie a strong support. Earlier today, these solid numbers in combination with a weaker greenback pushed AUD/USD sharply higher, which resulted in an invalidation of earlier breakdowns. How high could the exchange rate go in the coming days?
In our opinion the following forex trading positions are justified - summary:
- EUR/USD: none
- GBP/USD: none
- USD/JPY: none
- USD/CAD: short (stop loss order at 1.2876)
- USD/CHF: none
- AUD/USD: none
EUR/USD
The sitution in the medium term remains almost unchanged as EUR/USD is still trading above the previously-broken long-term green support/resistance line and the lower border of the long-term declining trend channel.
Can we infer something more about future moves from the daily chart? Let’s check.
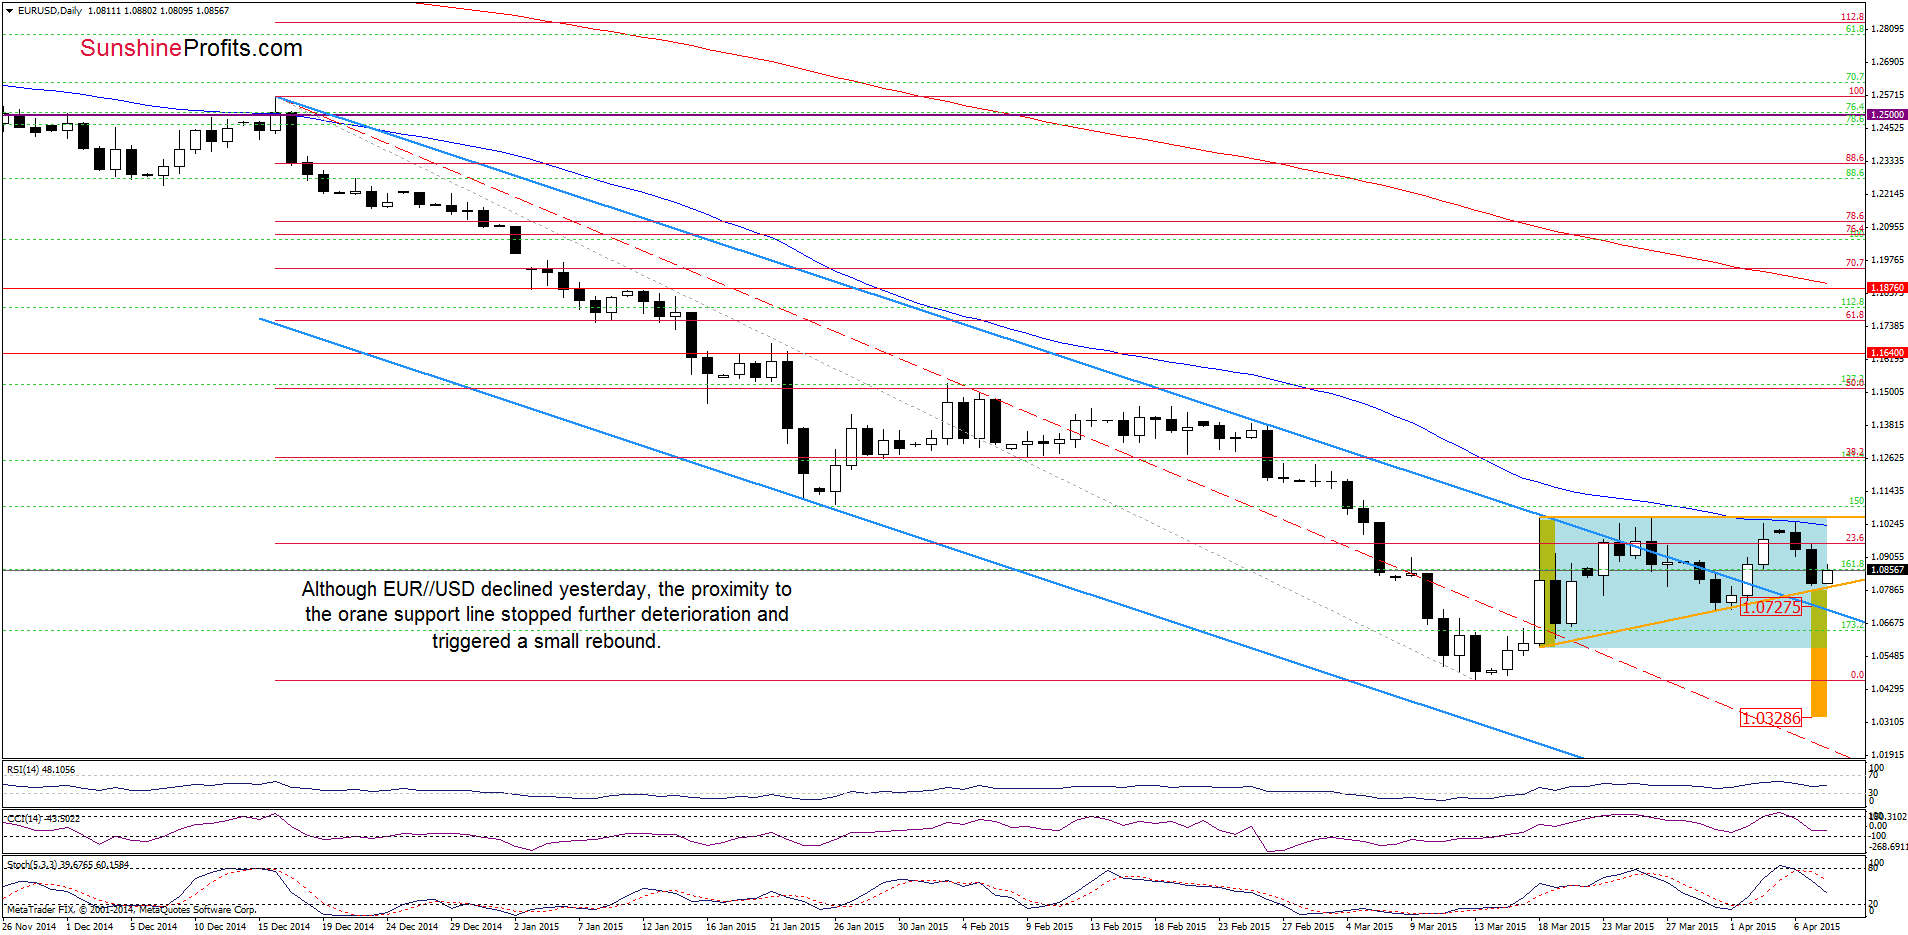
Looking at the above chart, we see that the orange support line stopped further deterioration and triggered a rebound earlier today. Therefore, we think that our last commentary is up-to-date:
(…) if EUR/USD rebounds from here, we’ll see a comeback to the upper line of the formation. However, taking into account sell signals generated by the indicators, it seems that lower values of the exchange rate are ahead us. If this is the case, and the pair breaks below this key support line, we’ll see at least a test of the previously-broken upper border of the declining trend channel (currently at 1.0727. If it is broken, the next target for currency bears would be the lower line of the consolidation at 1.0579 or even March lows.
Very short-term outlook: mixed with bearish bias
Short-term outlook: mixed
MT outlook: mixed
LT outlook: mixed
Trading position (short-term; our opinion): No positions are justified from the risk/reward perspective at the moment. We will keep you informed should anything change, or should we see a confirmation/invalidation of the above.
USD/CAD
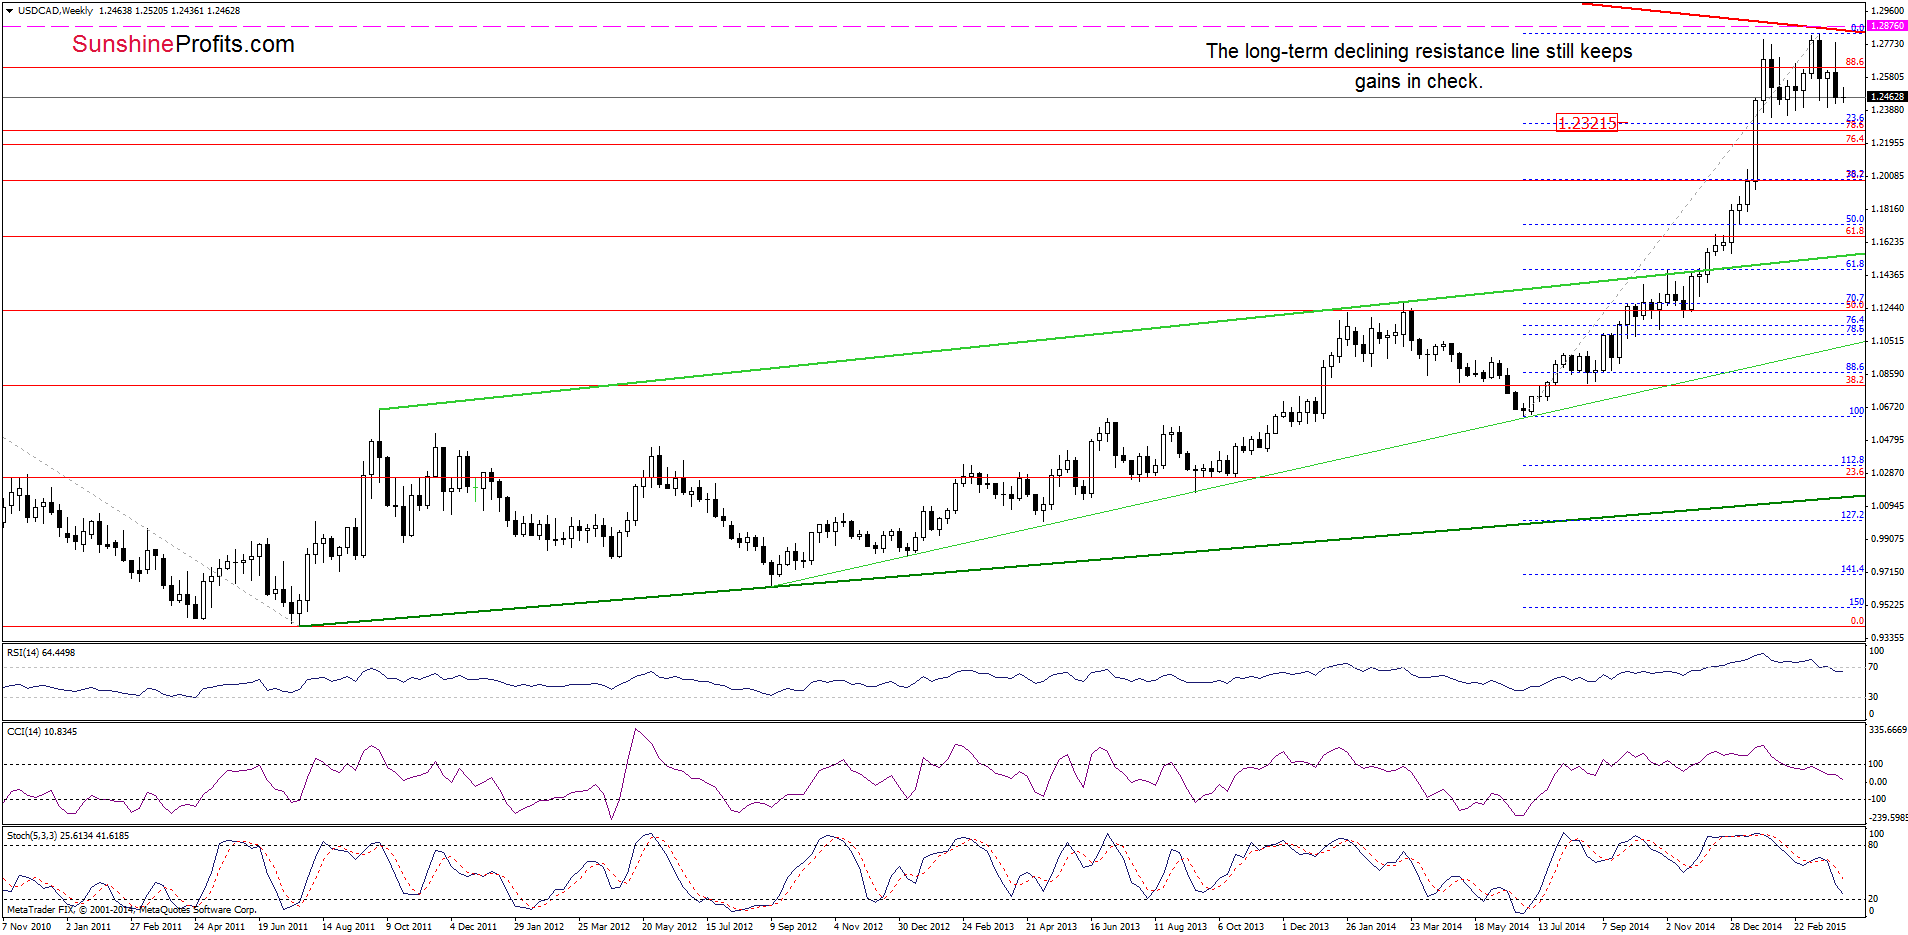
On the weekly chart, we see that USD/CAD is still trading under the long-term red declining resistance line, which keeps gains in check. Taking this fact into account, and combining it with sell signals generated by all indicators, we think that further deterioration is just around the corner.
Are there any short-term factors that could support or hinder the realization of the above scenario? Let’s check.
Quoting our Forex Trading Alert posted on Thursday:
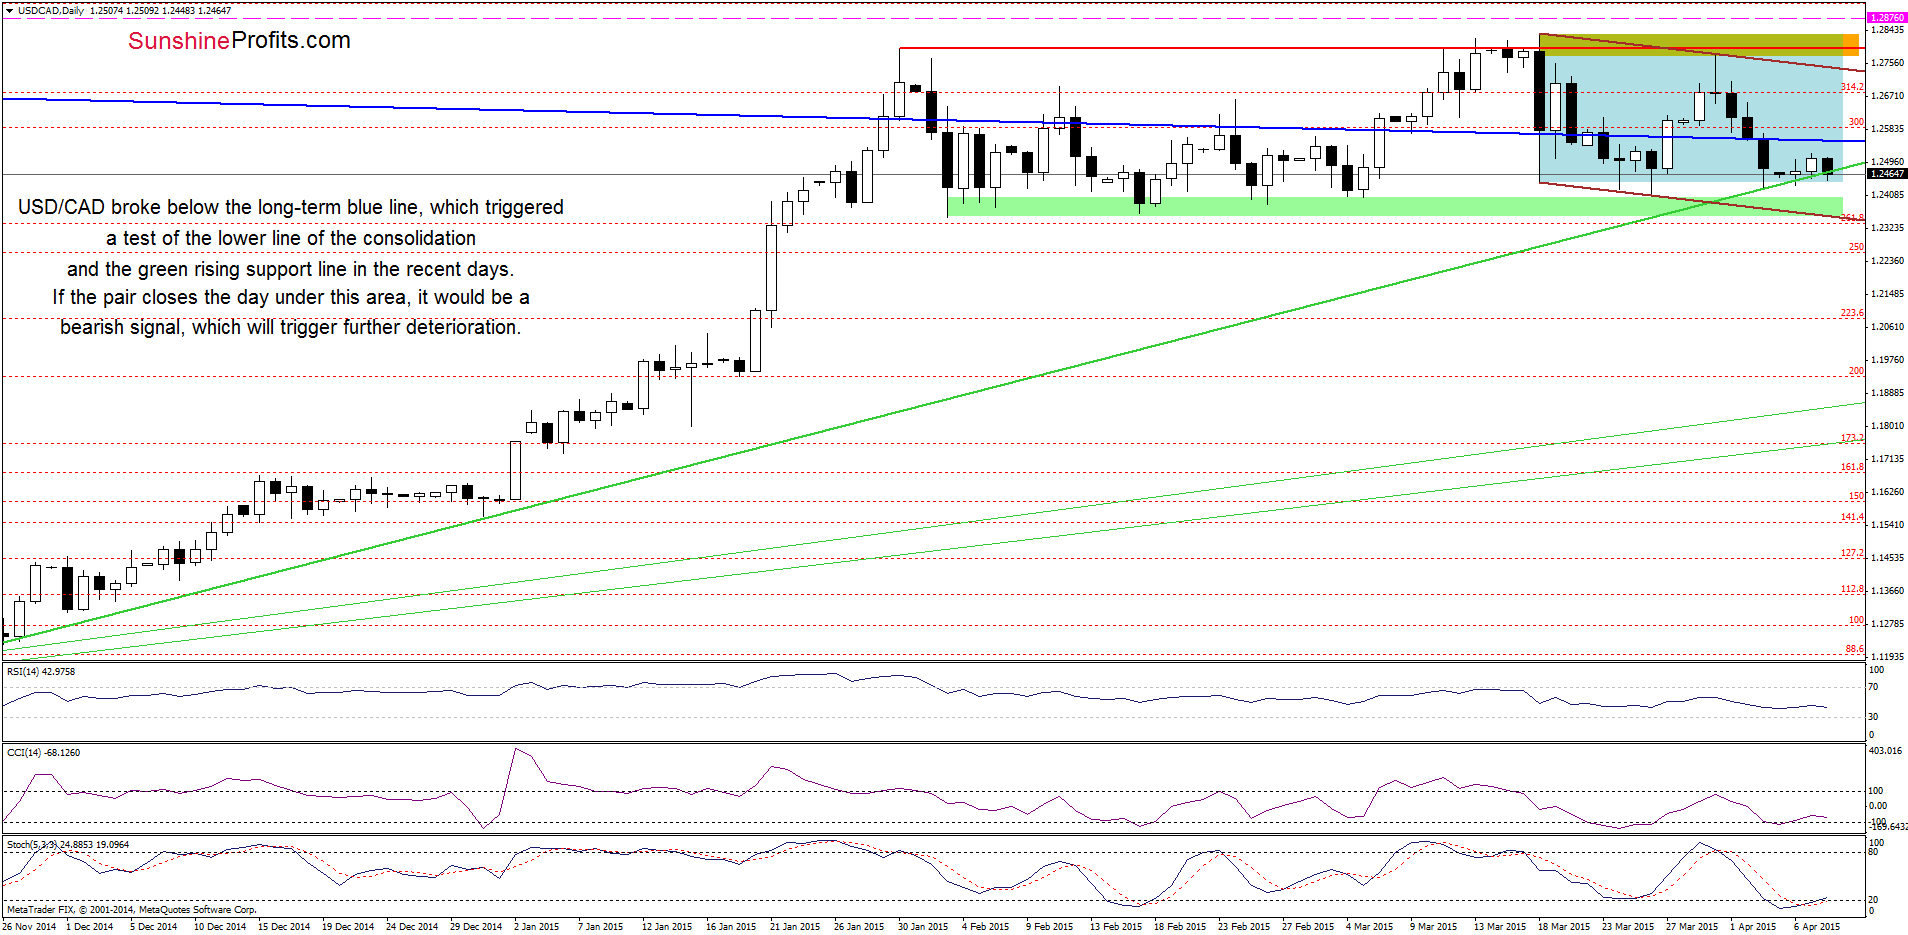
(…) a pullback (…) approached the pair to the long-term blue line. Although USD/CAD could rebound from here, it seems to us that a sell signal generated by the Stochastic Oscillator in combination with the medium-term picture will encourage currency bears to act. If this s the case, we’ll see a breakdown under this support line and a test of the lower border of the consolidation and the green rising support line in the coming days.
From today’s point of view we see that the situation developed in line with the above-mentioned scenario and USD/CAD reached our initial downside target. What’s next? If the exchange rate declines under this area (and closes the day below it), it would be a bearish signal, which will trigger further deterioration and a drop to at least the green support zone, which is currently reinforced by the lower border of the declining trend channel (marked with brown) around 1.2356.
Very short-term outlook: bearish
Short-term outlook: mixed with bearish bias
MT outlook: mixed
LT outlook: mixed
Trading position (short-term; our opinion): Short positions with a stop loss order at 1.2876 are justified from the risk/reward perspective. We will keep you informed should anything change, or should we see a confirmation/invalidation of the above.
AUD/USD
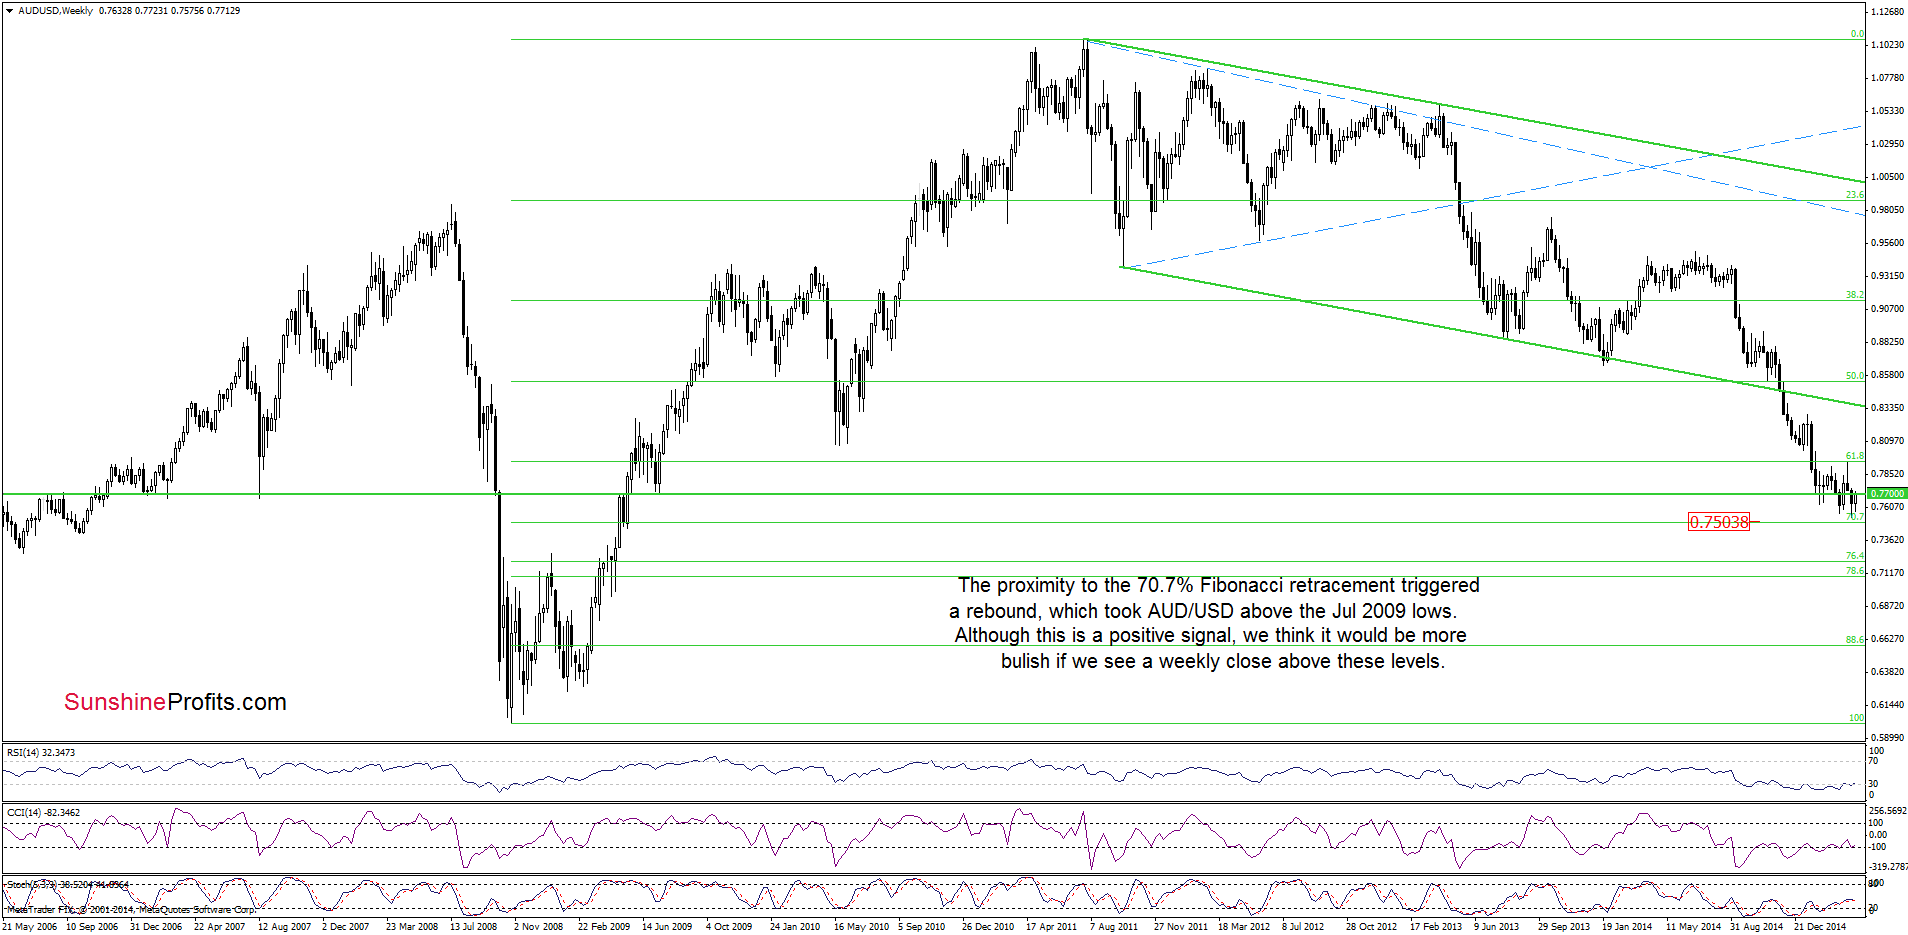
The medium-term outlook has improved as AUD/USD bounced off the recent lows and climbed above the Jul 2009 lows, invalidating earlier breakdown. Although this is a positive signal, we think that it would be more bullish if we see a weekly close above these levels.
Having said that, let’s focus on the very short-term changes and examine the daily chart.
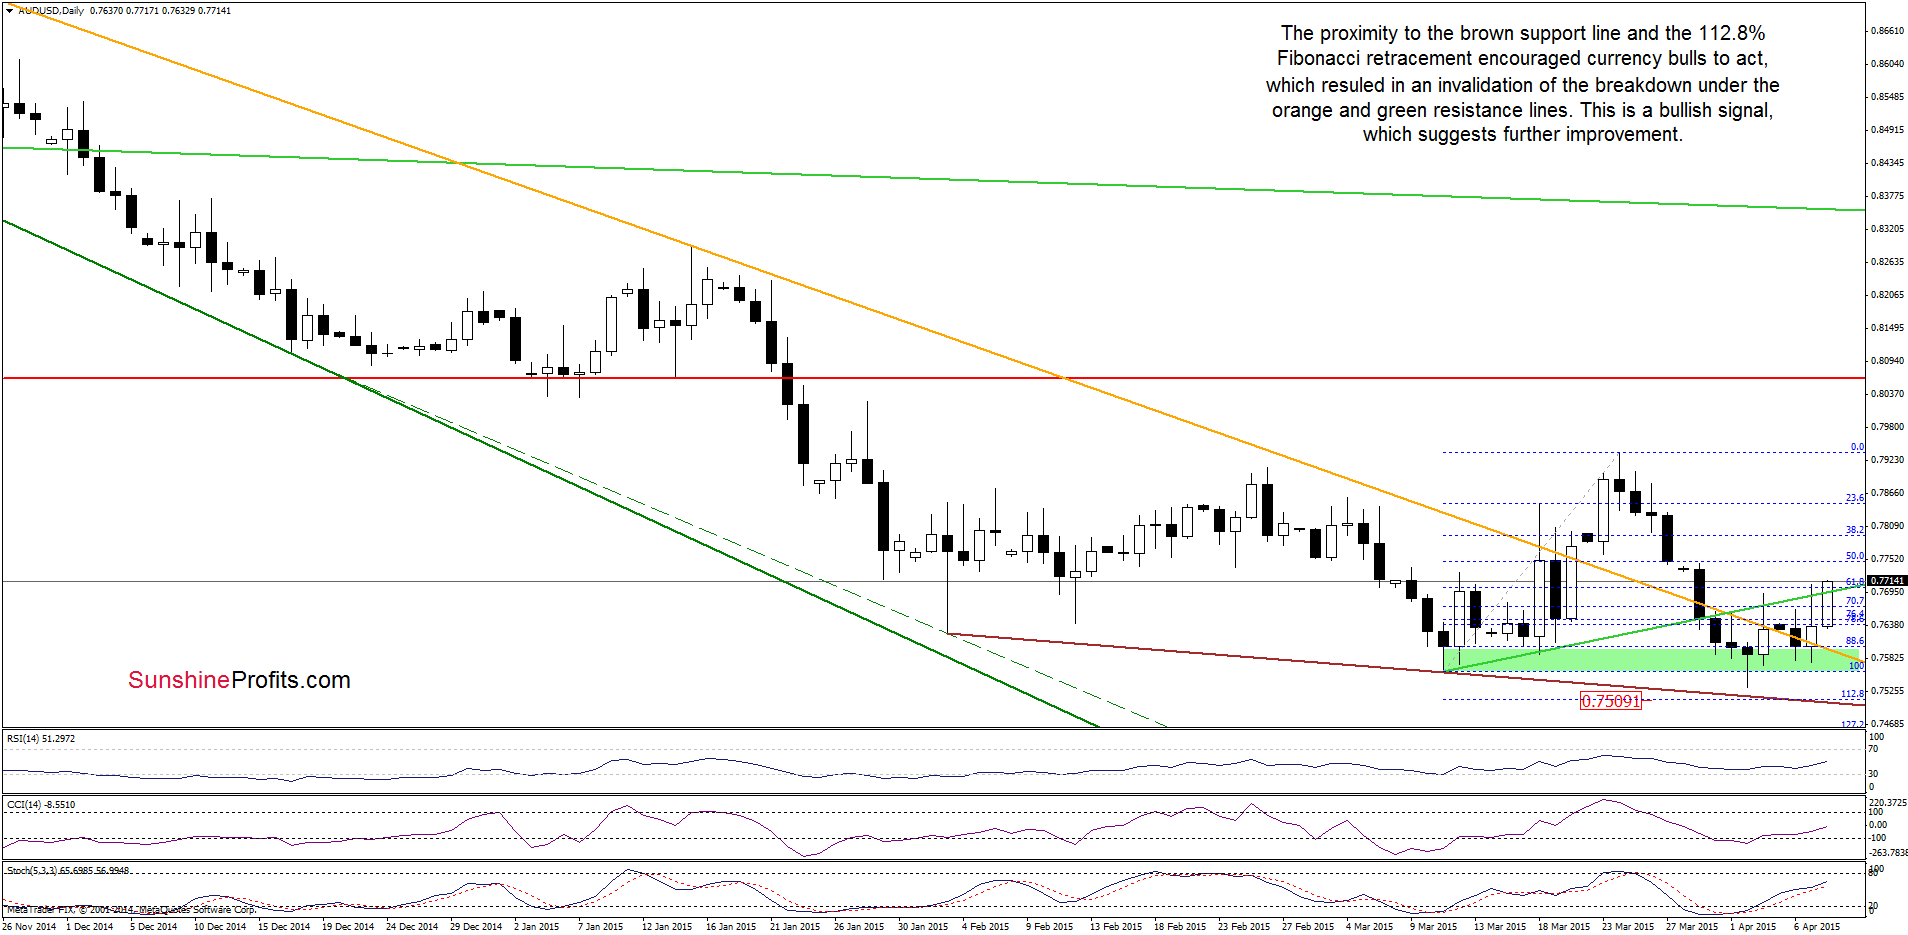
In our last commentary on this currency pair, we wrote the following:
(…) it seems to us that the proximity to this support area [the 112.8% Fibonacci extension and the brown support line based on the recent lows] in combination with the current position of the indictors (the CCI and Stochastic Oscillator are oversold, while the latter is very close to generate a buy signal) will encourage currency bulls to act in the coming days. If this is the case, we’ll see an invalidation of the breakdown below the Mar low and an increase to at least the orange resistance line (currently around 0.7642).
As you see on the daily chart, currency bulls not only realized the above-mentioned scenario (as we expected), but also managed to push AUD/USD above the previously-broken green line, which is an additional positive signal. On top of that, buy signals generated by the indicators remain in place supporting further improvement. If this is the case, the initial upside target would be around 0.7734, where the 50% Fibonacci retracement based on the Mar-Apr decline is. If it is broken, we might see an increase to 0.7782 (the 61.8% retracement) in the coming days.
Very short-term outlook: bullish
Short-term outlook: mixed with bullish bias
MT outlook: mixed
LT outlook: mixed
Trading position (short-term; our opinion): No positions are justified from the risk/reward perspective at the moment. We will keep you informed should anything change, or should we see a confirmation/invalidation of the above.
Thank you.
Nadia Simmons
Forex & Oil Trading Strategist
Przemyslaw Radomski, CFA
Founder, Editor-in-chief
Gold & Silver Trading Alerts
Forex Trading Alerts
Oil Investment Updates
Oil Trading Alerts

