
Yesterday’s data showed that U.S. industrial production increased by 0.1% in the previous month, disappointing expectations for a 0.2% gain. Additionally, manufacturing activity growth in New York State slowed in March for a second straight month, which together pushed the greenback lower. Earlier today, the USD Index dropped below the psychologically important barrier of 100, invalidating earlier breakout. What impact did this decline have on the USD/CAD pair?
In our opinion the following forex trading positions are justified - summary:
- EUR/USD: none
- GBP/USD: none
- USD/JPY: none
- USD/CAD: short (stop loss order at 1.2876)
- USD/CHF: none
- AUD/USD: none
EUR/USD
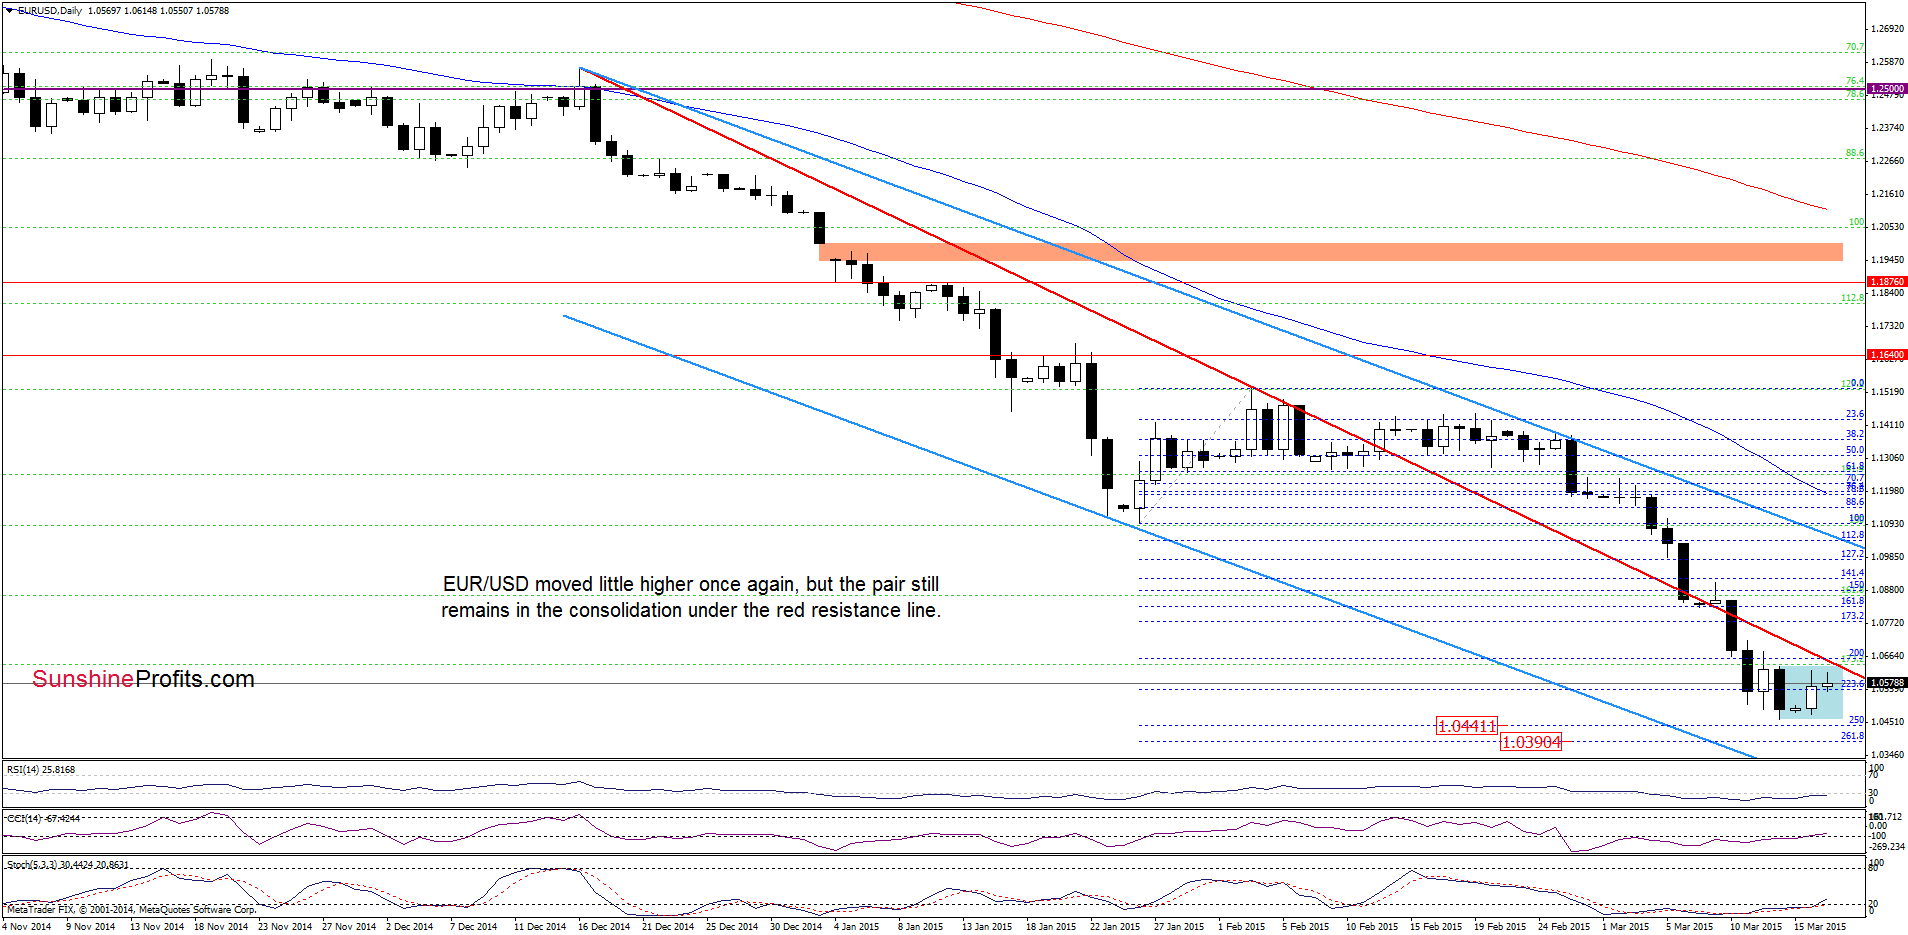
Looking at the charts, we see that the situation hasn’t changed much as EUR/USD still remains in the consolidation between Friday’s high and low under the red declining resistance line. Therefore, what we wrote yesterday is up-to-date:
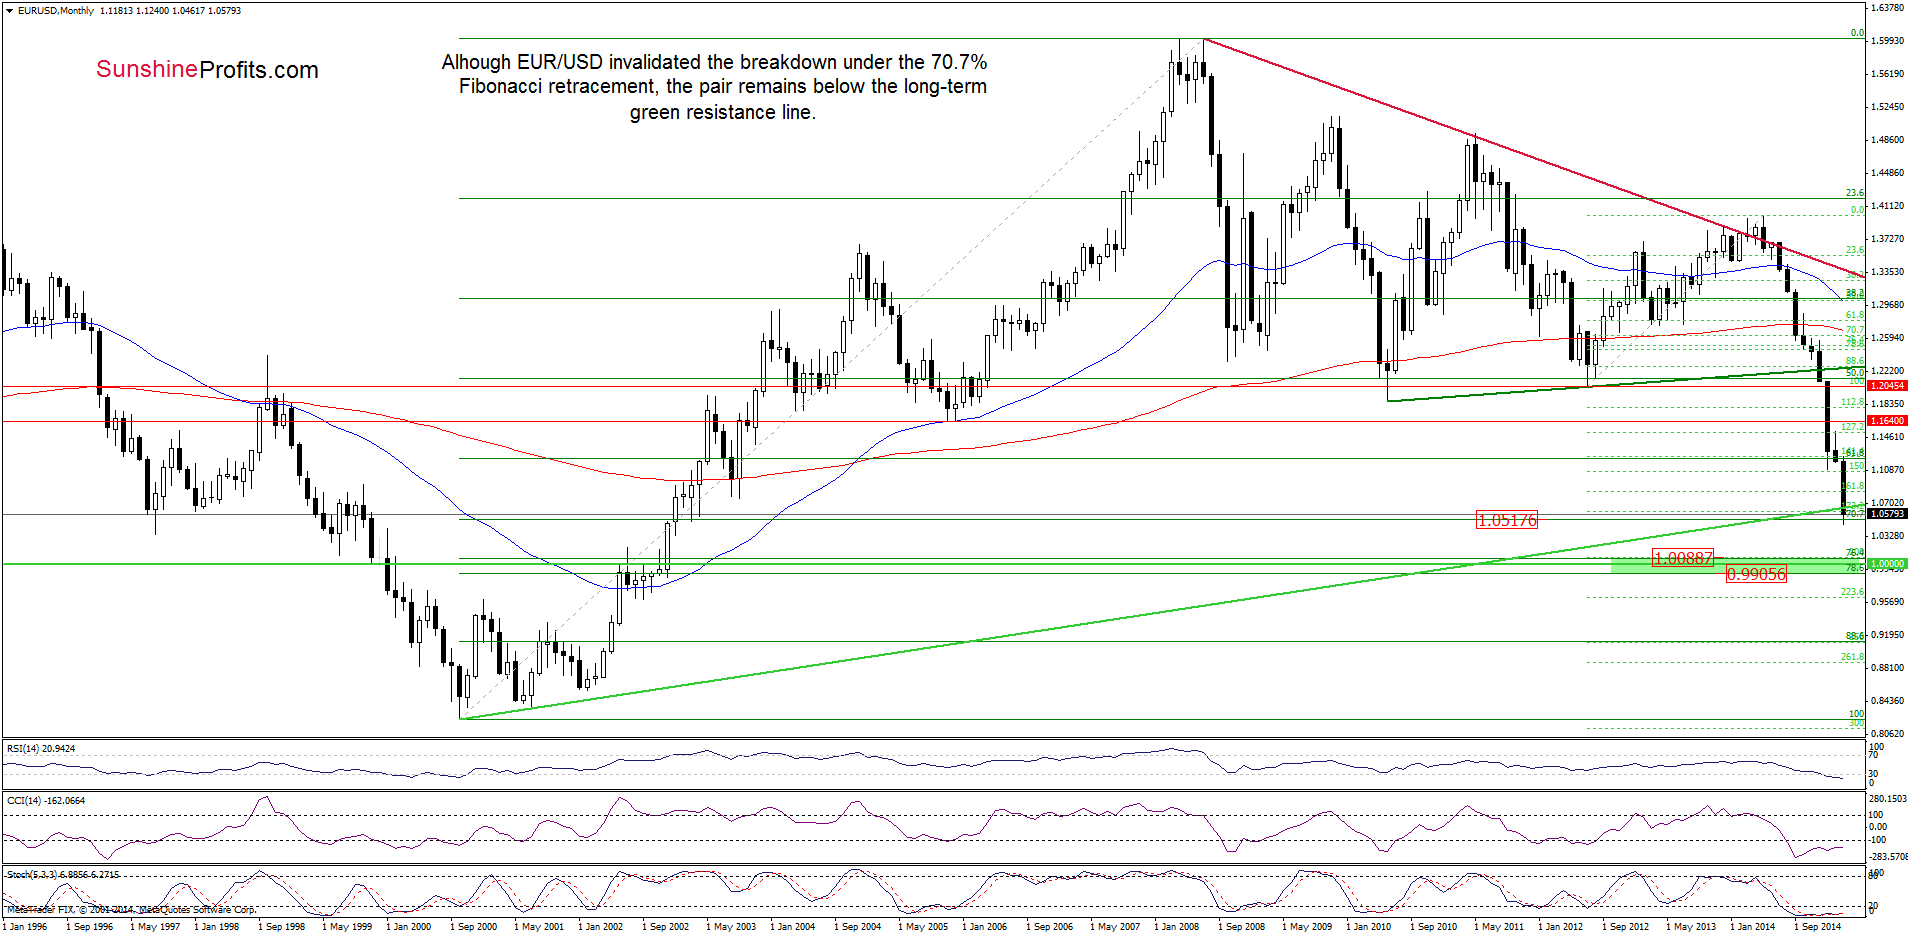
(…) EUR/USD came back above the 70.7% Fibonacci retracement, invalidating Friday’s breakdown. Although this is a positive signal, we should keep in mind that the exchange rate still remains under the previously-broken long-term green and medium-term red resistance lines. In our opinion, as long as there is no comeback above them further improvement is questionable and another downswing should not surprise us.
Very short-term outlook: mixed
Short-term outlook: mixed
MT outlook: mixed
LT outlook: mixed
Trading position (short-term; our opinion): No positions are justified from the risk/reward perspective at the moment. We will keep you informed should anything change, or should we see a confirmation/invalidation of the above.
USD/JPY
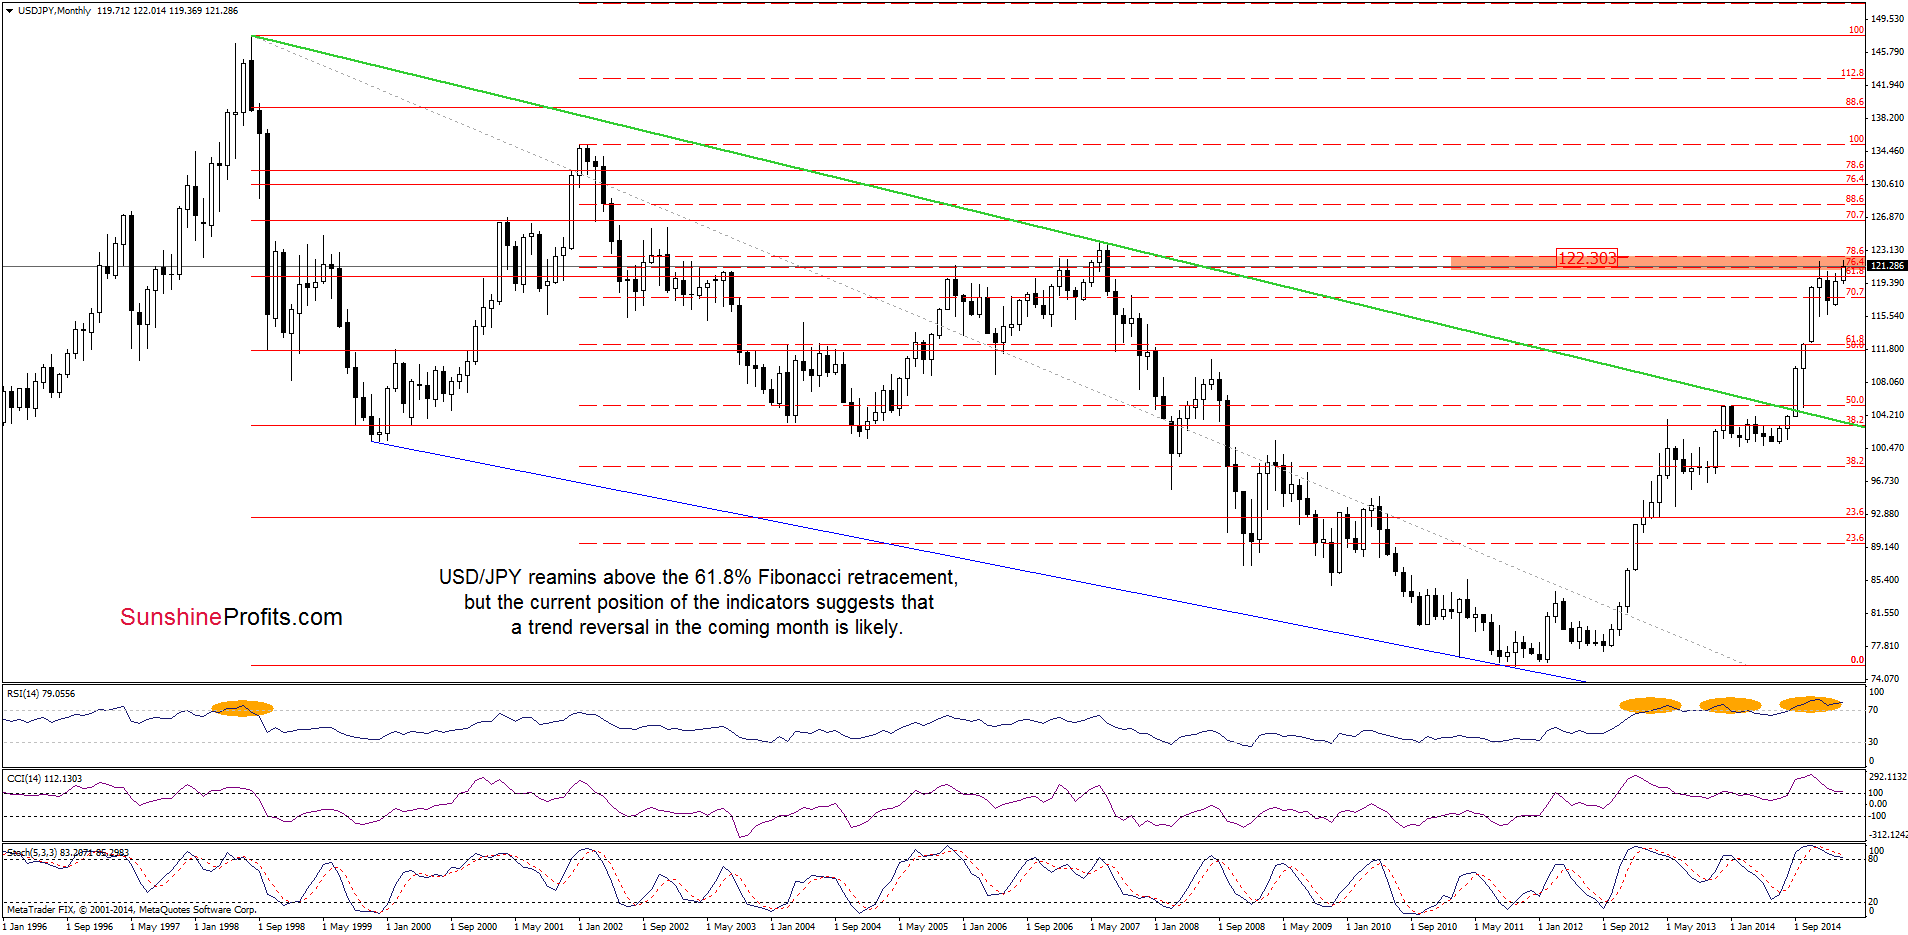
On the above chart, we see that the comeback above the 61.8% Fibonacci retracement level (based on the entire 1998-2011 declines), still supports currency bulls.
Having said that, let’s examine the daily chart.
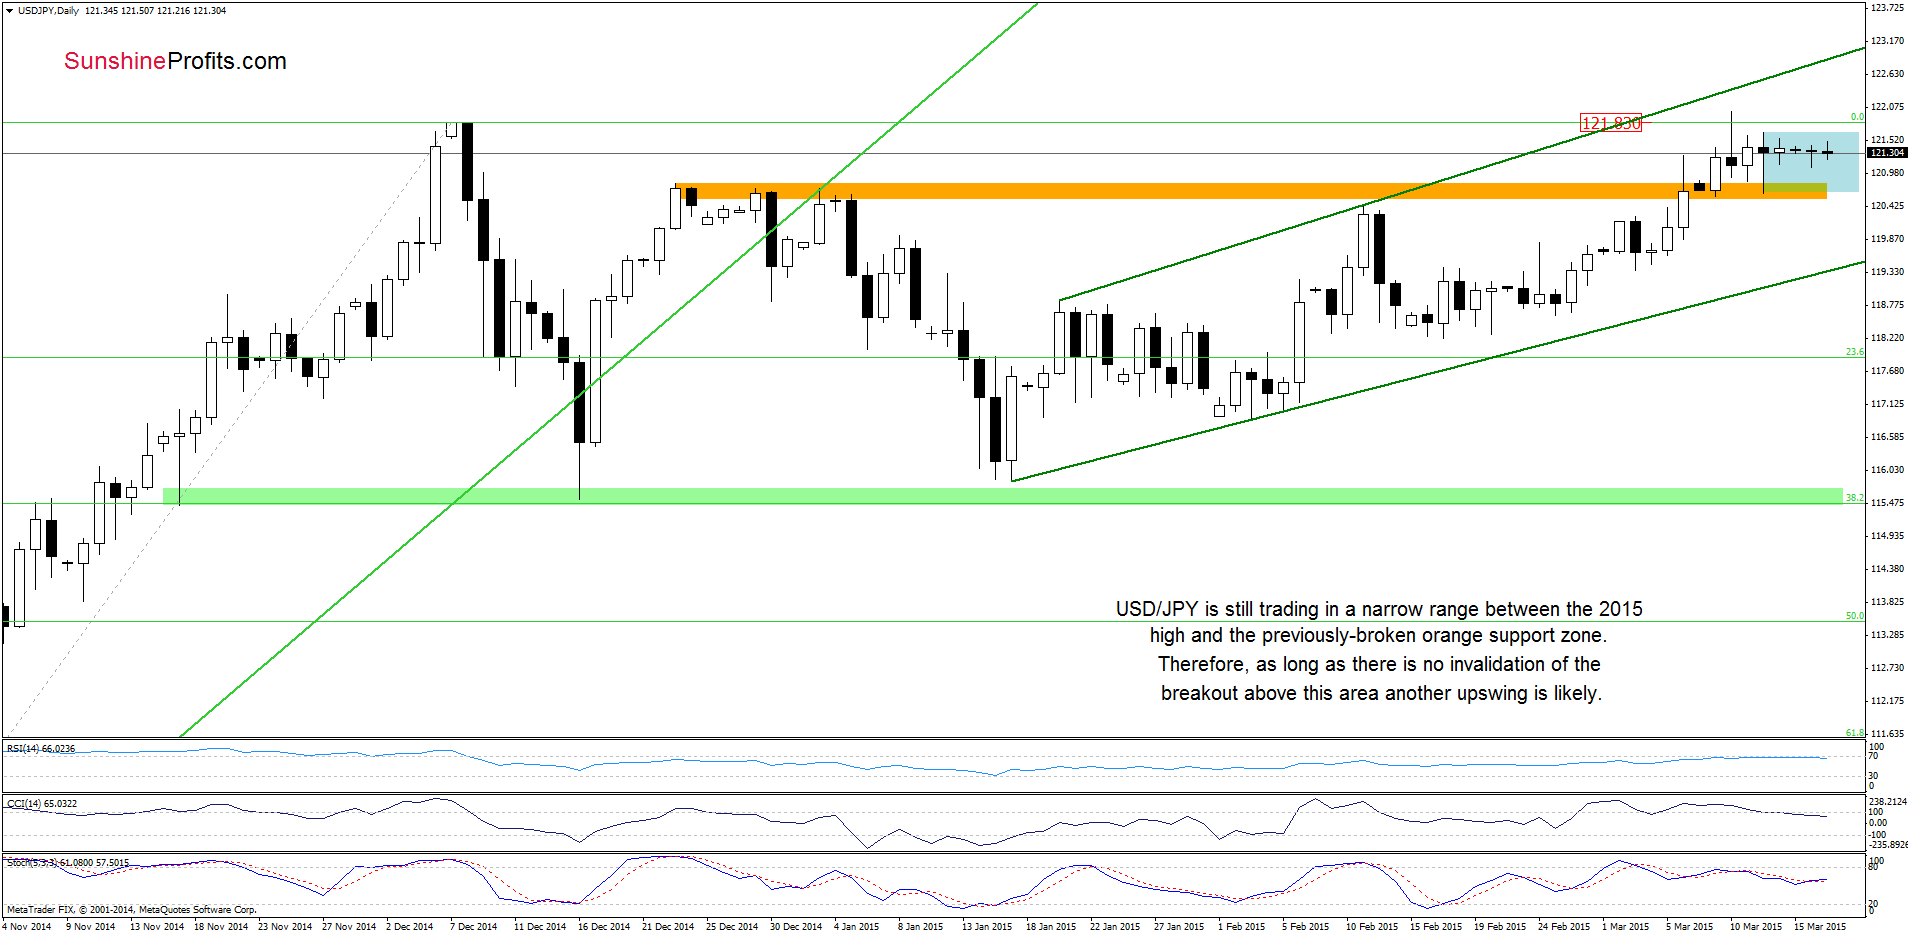
From today’s point of view we see that the very short-tem picture remains almost unchanged as USD/JPY is still trading in a narrow range between the 2015 high and the previously-broken orange support zone. Taking this fact into account, we believe that our Friday’s commentary is still valid:
(…) as long as there is no invalidation of the breakout above this area another upswing is likely. If this is the case, well se a test of the strength of the 78.6% Fibonacci retracement (around 122.30) in the coming days.
Nevertheless, we should keep in mind that sell signals generated by the indictors support the bearish case, suggesting that another test of the strength of the orange support zone is more likely than not.
Very short-term outlook: mixed
Short-term outlook: mixed
MT outlook: mixed
LT outlook: bullish
Trading position (short-term; our opinion): No positions are justified from the risk/reward perspective at the moment. We will keep you informed should anything change, or should we see a confirmation/invalidation of the above.
USD/CAD
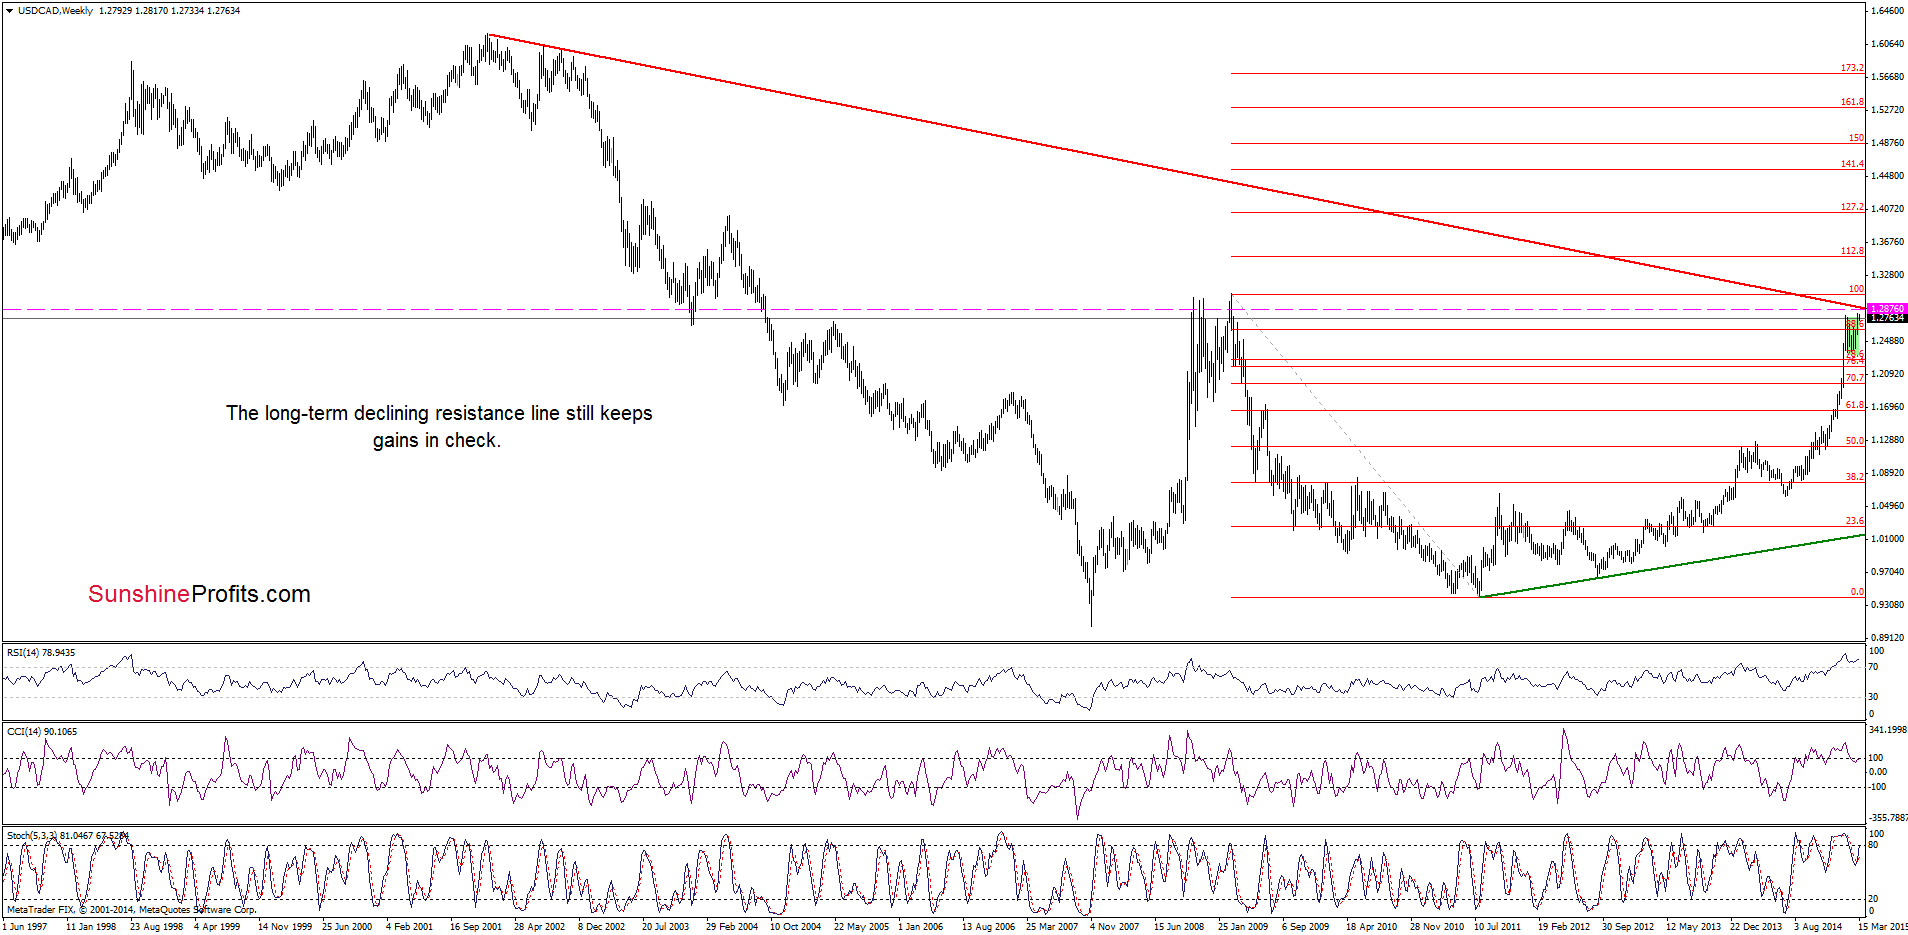
As you see on the weekly chart although USD/CAD moved higher in the previous week, the long-term red declining resistance line still keeps gains in check. In the previous weeks, the proximity to this key resistance was enough to trigger a correction. Therefore, we think that as long as there is no breakout above this line, the probability of a reversal is high.
Are there any short-term factors that could support or hinder the realization of the above scenario? Let’s check.
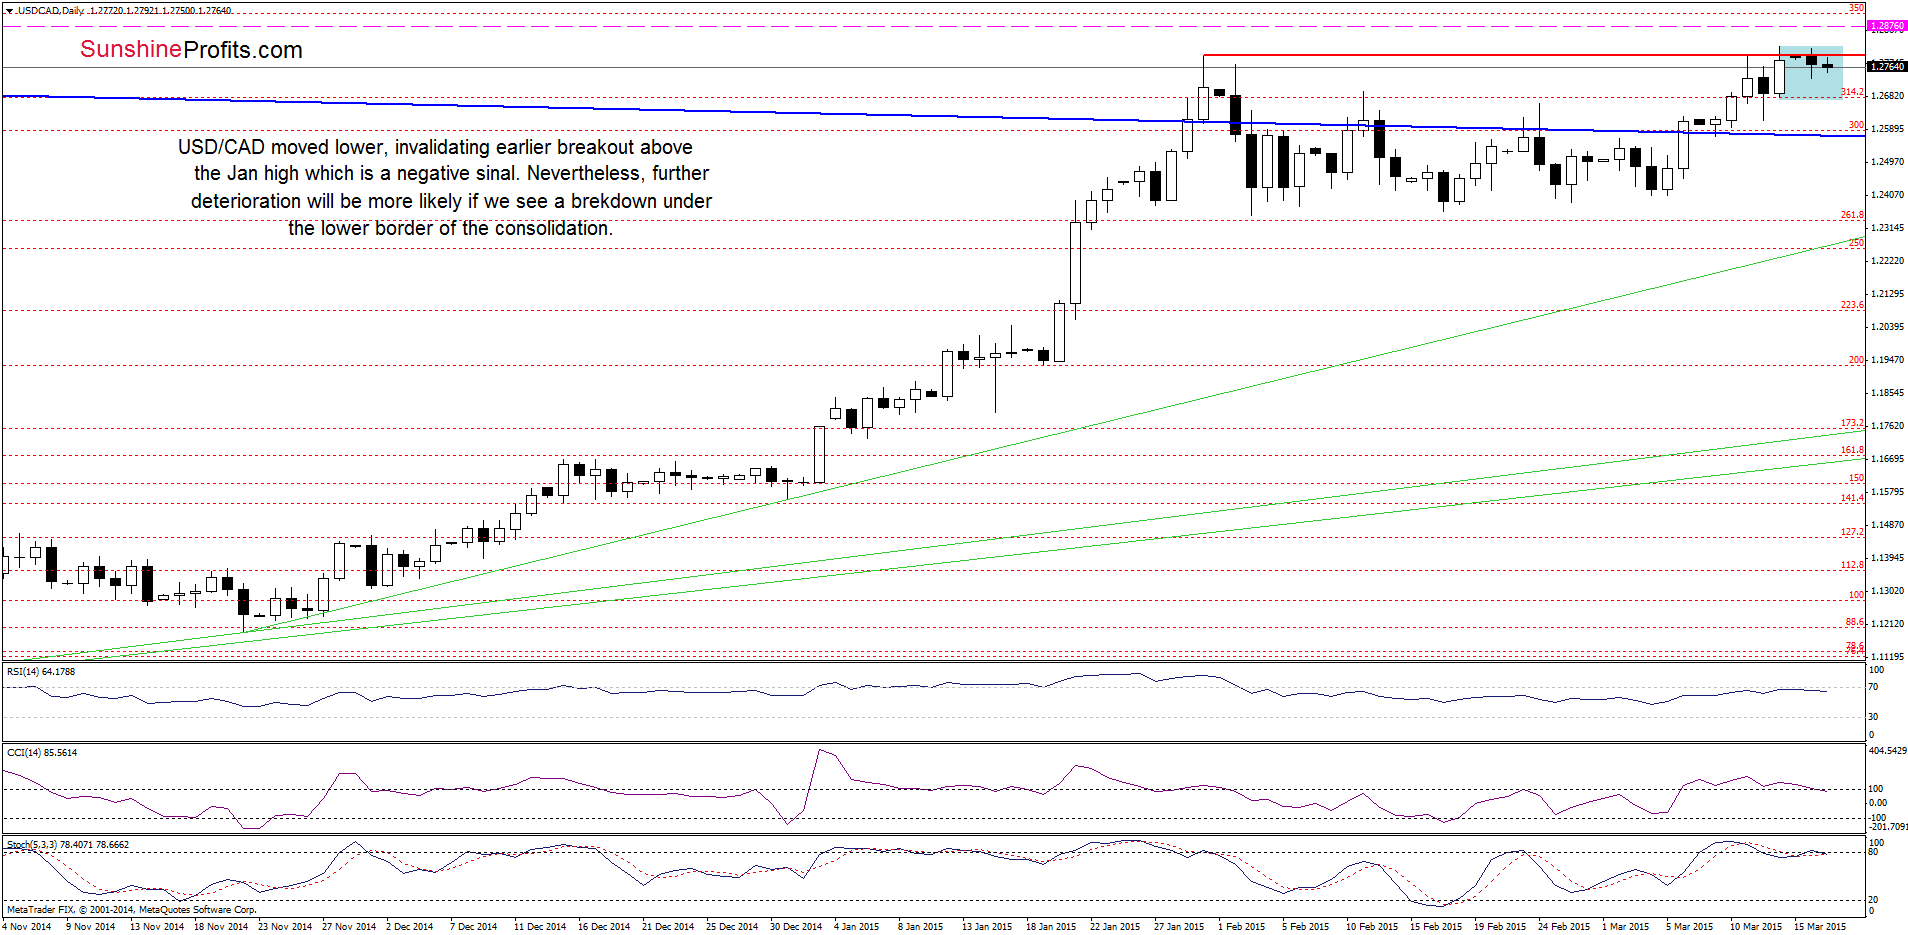
On Friday, we wrote the following:
(…) USD/CAD moved higher once again and broke above the Jan high, hitting a fresh 201 high. (…) Nevertheless, taking into account a sell signal generated by the Stochastic Oscillator, negative divergences between the RSI, CCI and the exchange rate and the medium-term picture, we think that this breakout will be more reliable if we see a daily and weekly close above the previous high.
As you see on the daily chart currency bulls didn’t manage to close the day above the Jan high, which resulted in an invalidation of earlier breakout. This is a negative signal, which suggests that further deterioration is just around the corner. Nevertheless, it seems that declines will accelerate if we see a breakdown under the lower border of the consolidation (at 1.2680).
Very short-term outlook: bearish
Short-term outlook: mixed with bearish bias
MT outlook: mixed
LT outlook: mixed
Trading position (short-term; our opinion): Short positions with a stop loss order at 1.2876 are justified from the risk/reward perspective. We will keep you informed should anything change, or should we see a confirmation/invalidation of the above.
Thank you.
Nadia Simmons
Forex & Oil Trading Strategist
Przemyslaw Radomski, CFA
Founder, Editor-in-chief
Gold & Silver Trading Alerts
Forex Trading Alerts
Oil Investment Updates
Oil Trading Alerts

