
Earlier today, the U.S. dollar moved lower and approached the barrier of 100 as Friday’s disappointing data encouraged investors to take profits from the recent rally to almost 12 years high against the basket of major currencies. As a result, USD/CHF reversed and erased some gains. Is this a shallow correction or maybe the beginning of a trend reversal?
In our opinion the following forex trading positions are justified - summary:
- EUR/USD: none
- GBP/USD: none
- USD/JPY: none
- USD/CAD: short (stop loss order at 1.2876)
- USD/CHF: none
- AUD/USD: none
EUR/USD
Quoting our previous Forex Trading Alert:
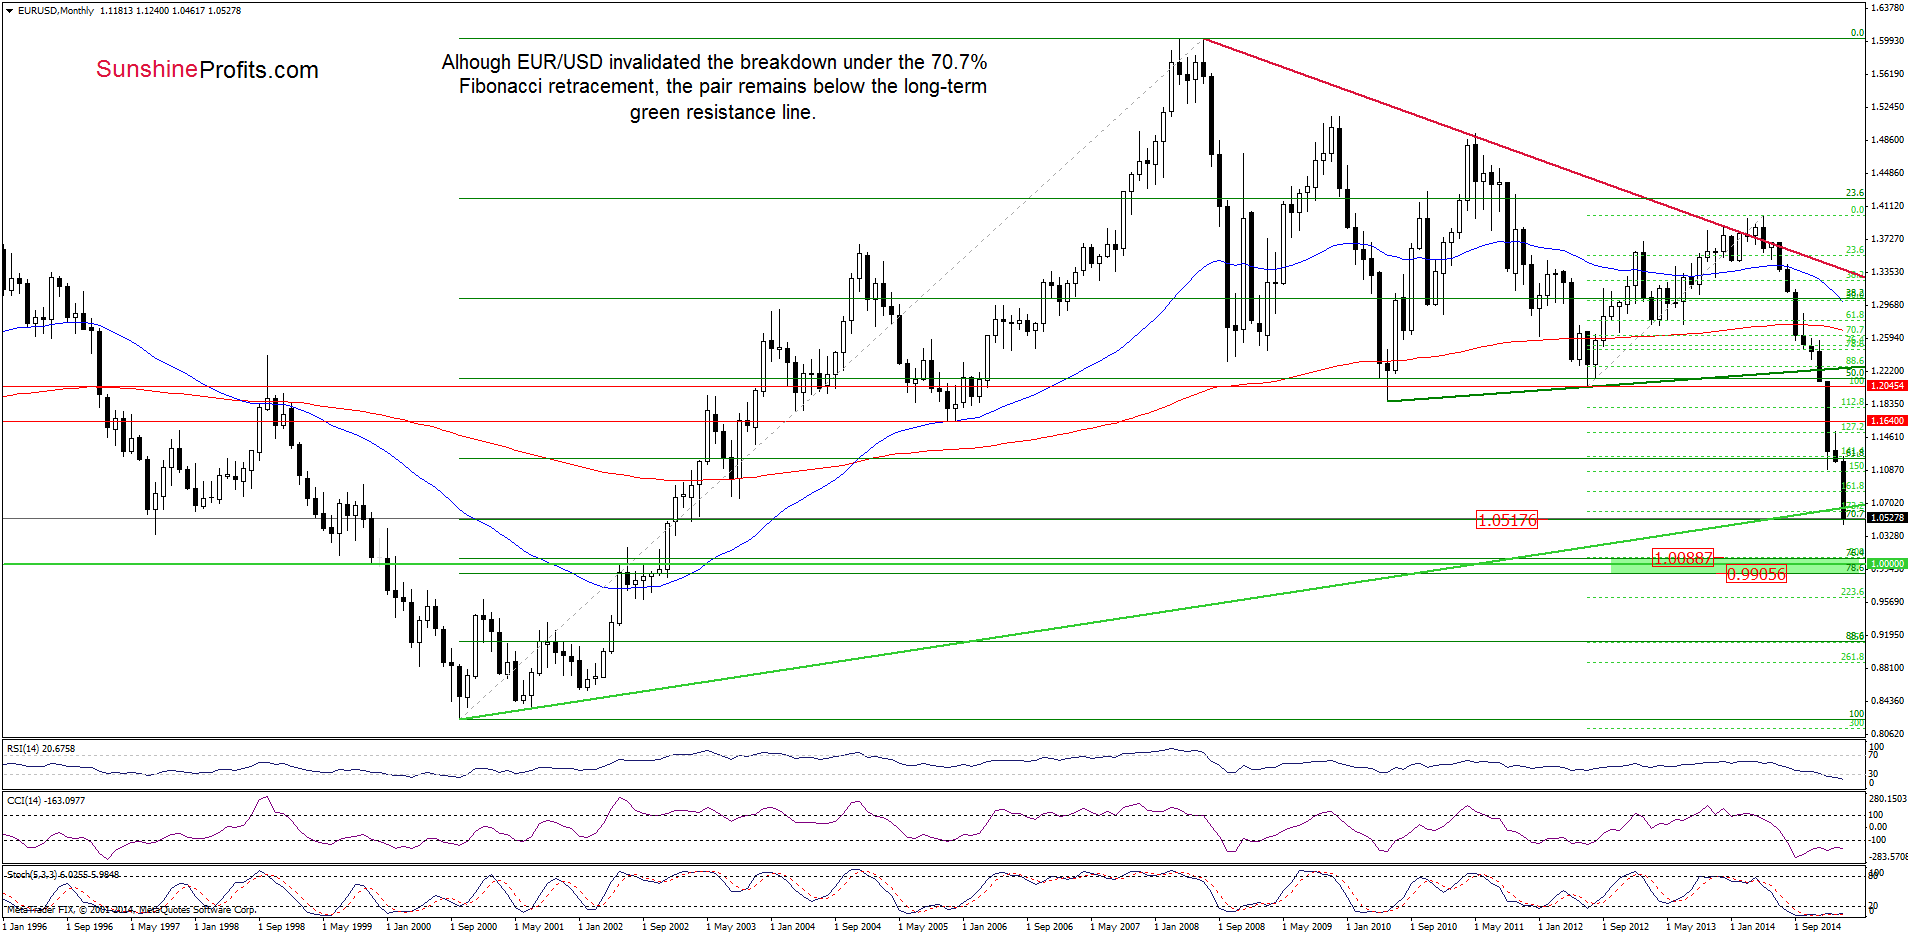
(…) Taking (…) into account (…) a comeback under the 70.7% Fibonacci retracement and the breakdown below the long-term green (marked on the weekly chart) and medium-term red lines, it seems that lower values of the exchange rate are still ahead us. If this is the case, the initial downside target would be around 1.0441, where the 250% Fibonacci extension (based on the Jan-Feb upward move) is.
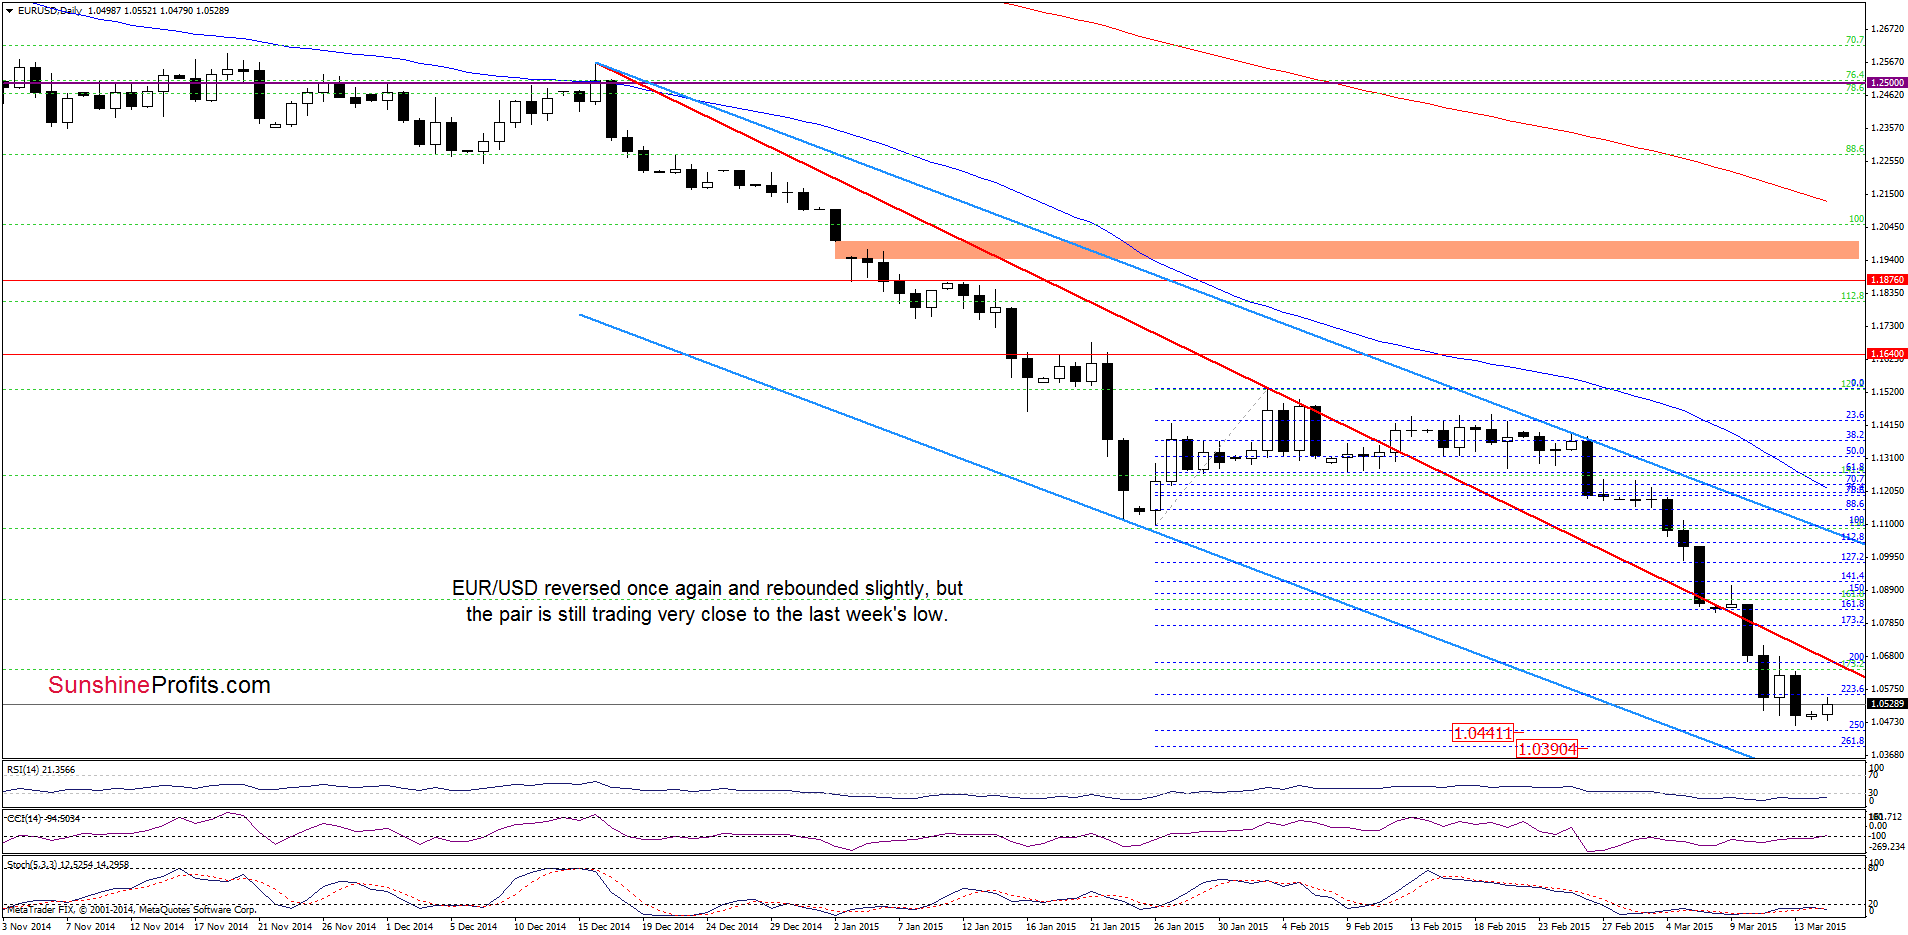
As you see on the daily chart, EUR/USD moved lower on Friday, hitting an intraday low of 1.0461 and approaching the above-mentioned downside target. Despite this drop, the exchange rate reversed and rebounded slightly earlier today. With this upswing EUR/USD came back above the 70.7% Fibonacci retracement, invalidating Friday’s breakdown. Although this is a positive signal, we should keep in mind that the exchange rate still remains under the previously-broken long-term green and medium-term red resistance lines. In our opinion, as long as there is no comeback above them further improvement is questionable and another downswing should not surprise us.
Very short-term outlook: mixed
Short-term outlook: mixed
MT outlook: mixed
LT outlook: mixed
Trading position (short-term; our opinion): No positions are justified from the risk/reward perspective at the moment. We will keep you informed should anything change, or should we see a confirmation/invalidation of the above.
GBP/USD
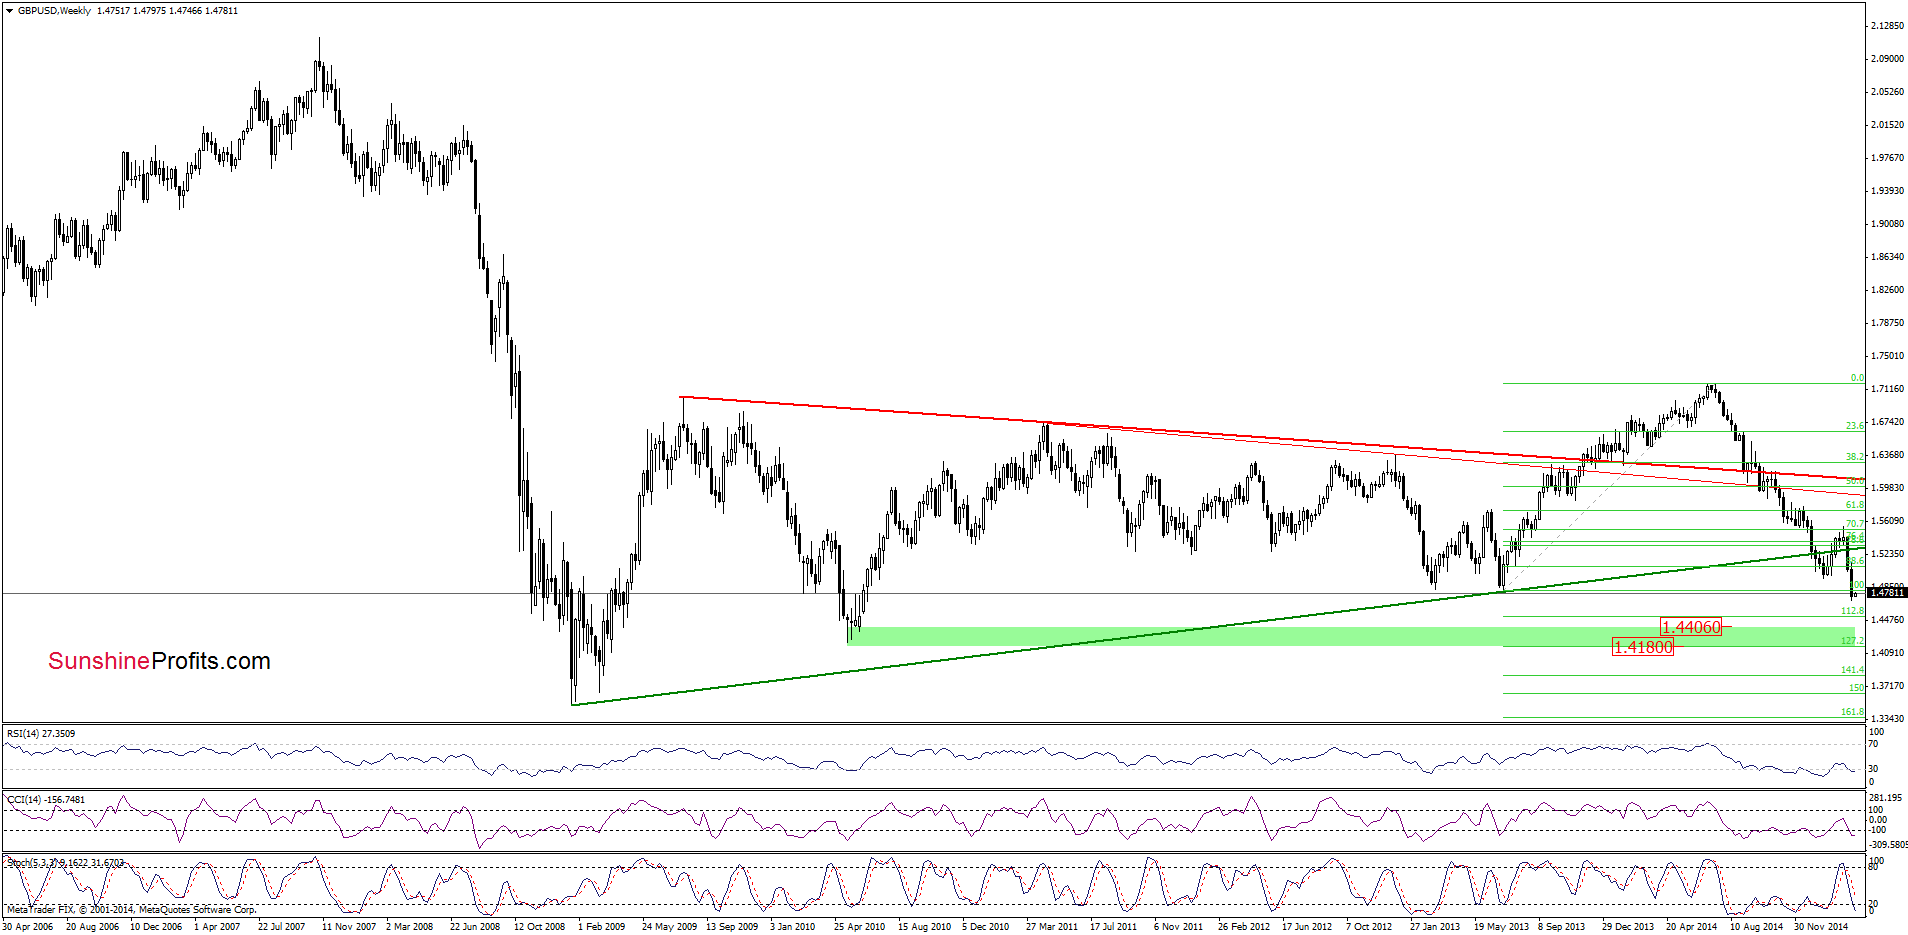
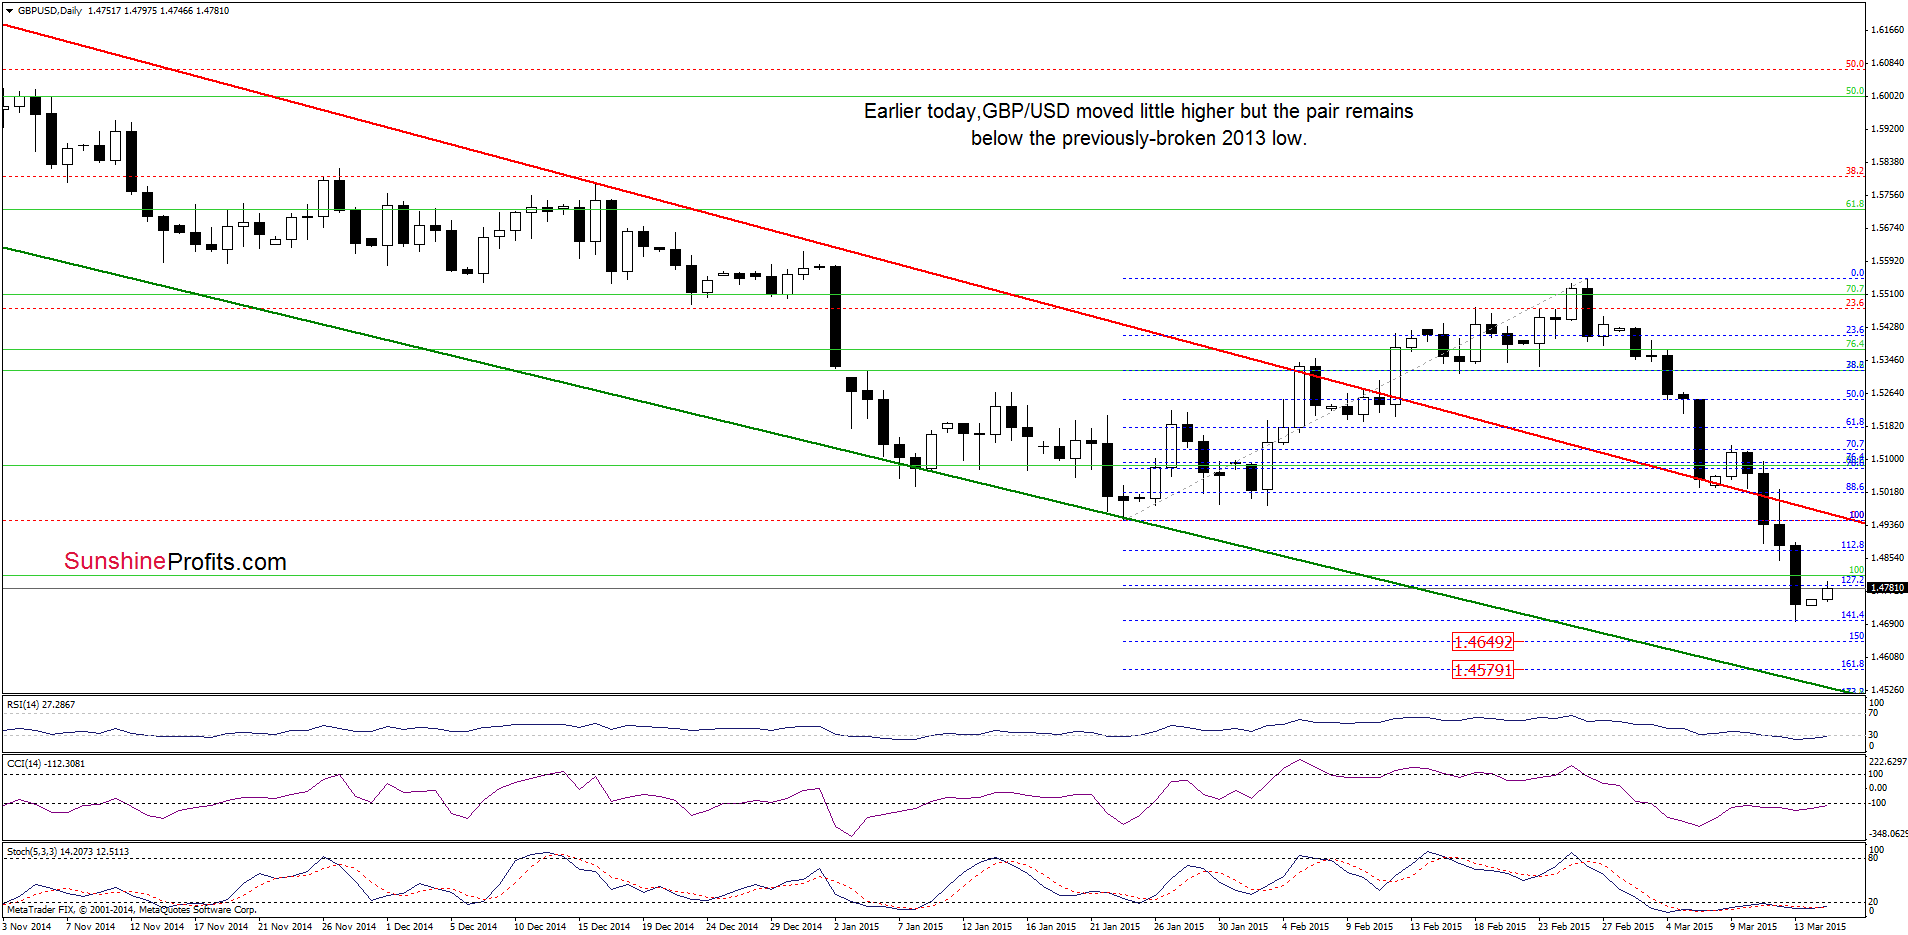
Looking at the above chart, we see that although GBP/USD moved little higher, the pair still remains under the previously-broken Jul 2013 low. Additionally, the sell signal generated by the weekly Stochastic Oscillator is still in play, supporting the bearish case at the moment. Therefore, as long as there is no invalidation of the breakout, further improvement is questionable and another downswing is likely. If this is the case, downside targets from our last commentary will be in play:
(…) If (…) the pair moves lower once again, the initial downside target would be around 1.4649, where the 150% extension is. If this support is broken, we could see a decline to 1.4579 (161.8% extension). Nevertheless, taking into account the medium-term picture, it seems that GBP/USD could drop even to around 1.4180-1.4406, where the green support zone (marked on the weekly chart) created by the 2010 lows and the 127.2% Fibonacci extension (based on the entire 2013-2014 rally) is.
Very short-term outlook: mixed with bearish bias
Short-term outlook: mixed
MT outlook: mixed
LT outlook: mixed
Trading position (short-term; our opinion): No positions are justified from the risk/reward perspective at the moment. We will keep you informed should anything change, or should we see a confirmation/invalidation of the above.
USD/CHF
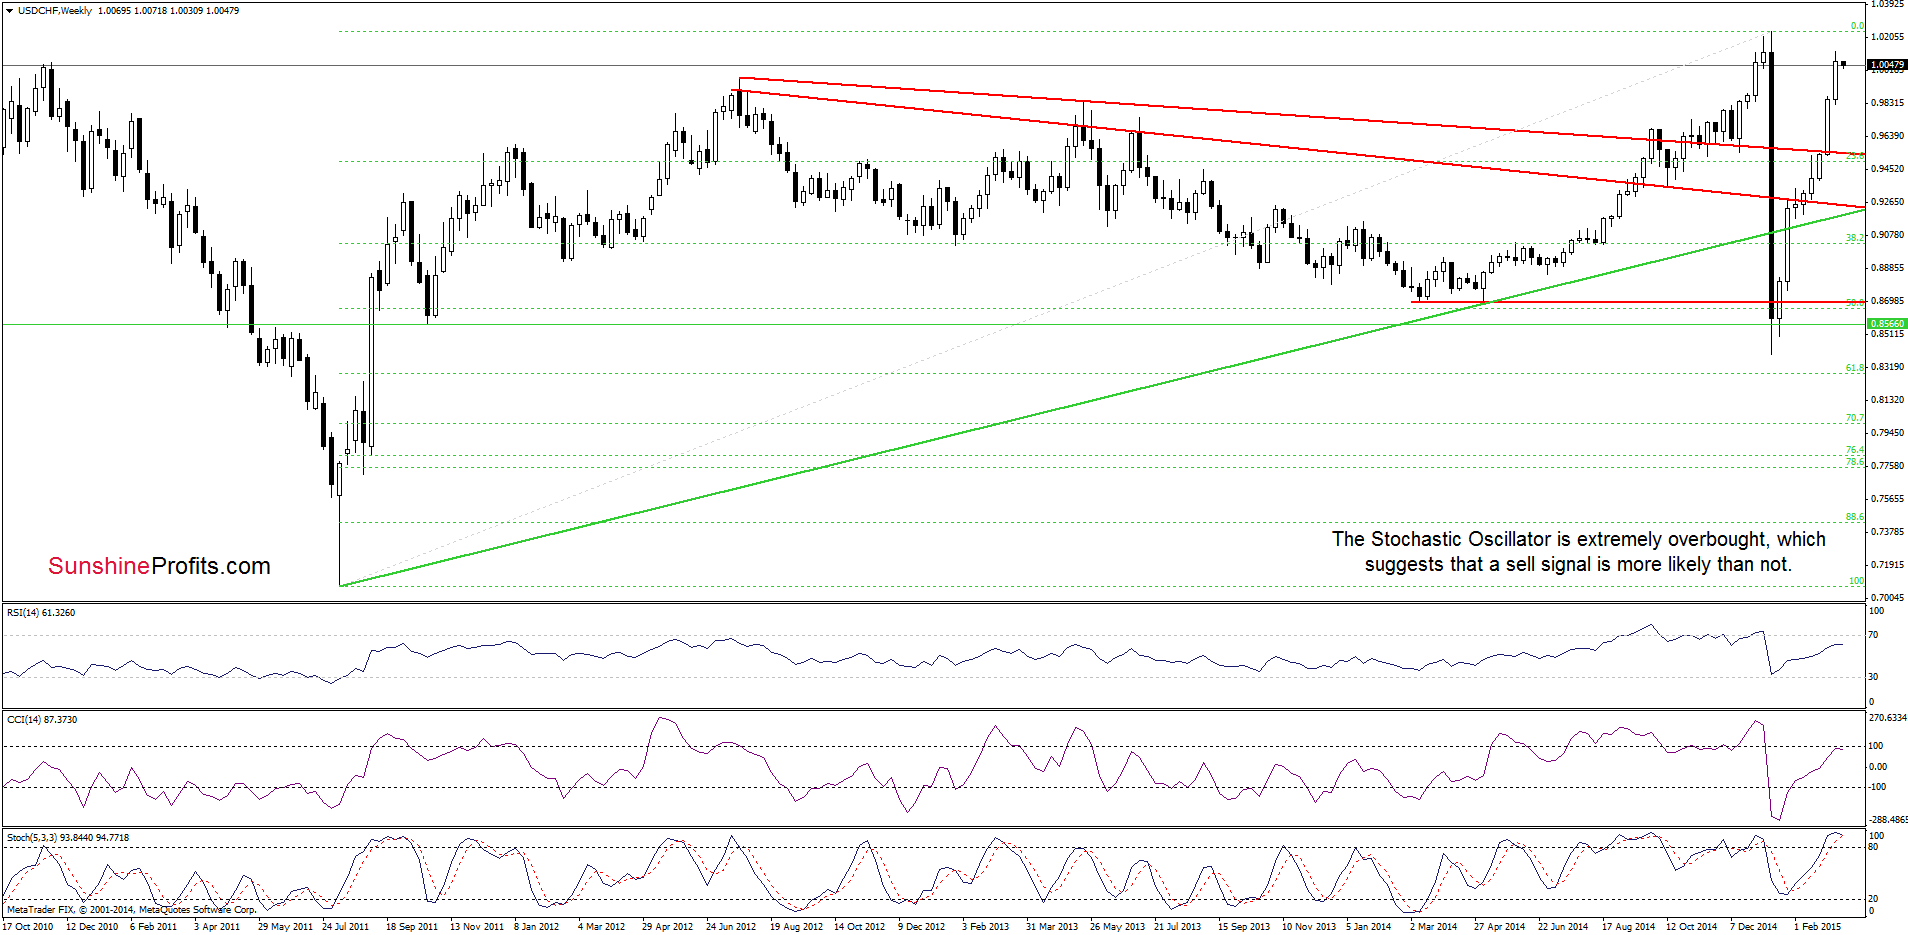
The medium-term picture hasn’t changed much as USD/CHF still remains quite close to the last week’s high. Nevertheless, we should keep in mind that the Stochastic Oscillator is extremely overbought, which suggests that we’ll see a sell signal in the coming week. In this case, the probability of a correction will increase.
Having said that, let’s check what we can infer from the daily chart.
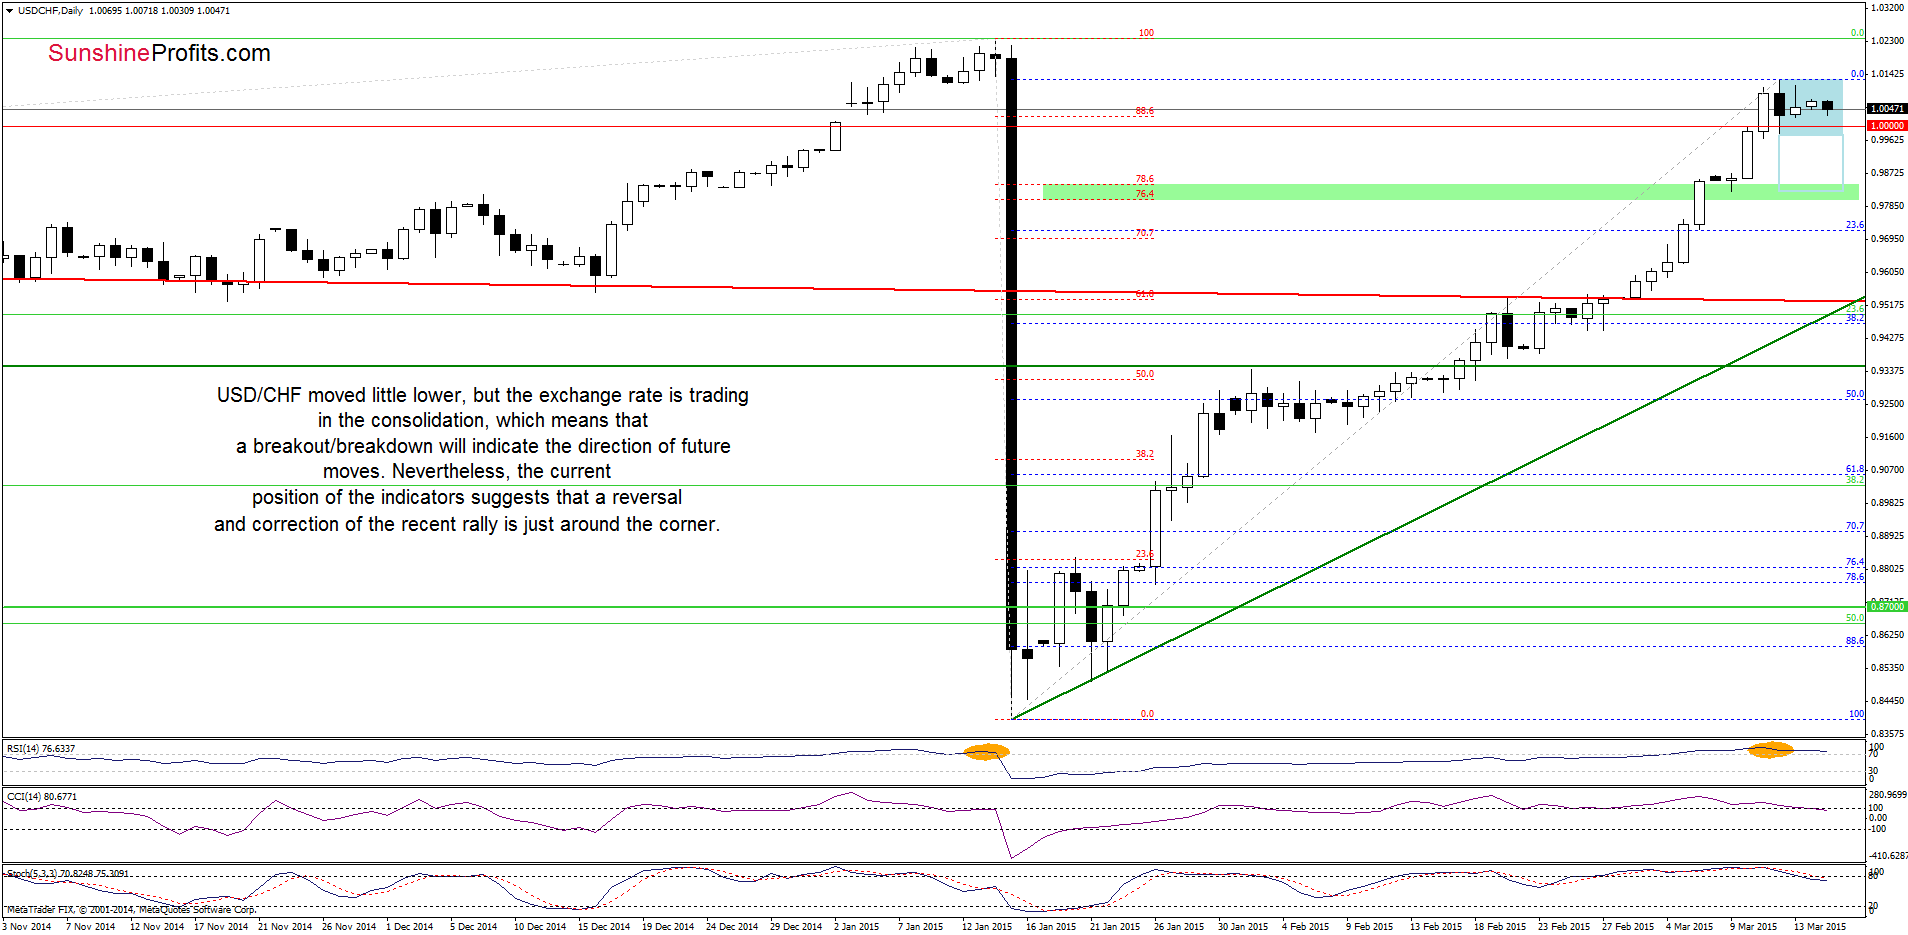
On the above chart we see that USD/CHF moved little lower, but the exchange rate is trading in the consolidation (marked with blue), which means that a breakout/breakdown will indicate the direction of future moves.
Nevertheless, we should keep in mind our last commentary on this currency pair:
(…) when we take a closer look at the current position of the indicators, we see that the RSI remains above the level of 70, which is a negative sign. The reason? As you see on the daily chart, in Jan such high reading of the indicator preceded one of the sharpest declines in forex market. Taking this fact into account, and combining it with a sell signal generated by the Stochastic Oscillator (…), it seems that a reversal and correction of the recent rally is just around the corner.
Please note that the CCI generated a sell signal earlier today, supporting the bearish case.
Very short-term outlook: mixed with bearish bias
Short-term outlook: mixed
MT outlook: mixed
LT outlook: bearish
Trading position (short-term; our opinion): No positions are justified from the risk/reward perspective at the moment. We will keep you informed should anything change, or should we see a confirmation/invalidation of the above.
Thank you.
Nadia Simmons
Forex & Oil Trading Strategist
Przemyslaw Radomski, CFA
Founder, Editor-in-chief
Gold & Silver Trading Alerts
Forex Trading Alerts
Oil Investment Updates
Oil Trading Alerts

