
On Friday, the Bureau of Labor Statistics showed that the economy added 295,000 jobs in the previous month, beating analysts’ expectations for a 55,000gain. These bullish numbers supported the USD Index and pushed it to an intraday high of 97.75. What impact did this rally have on the euro, British pound and Japanese yen?
In our opinion the following forex trading positions are justified - summary:
- EUR/USD: none
- GBP/USD: none
- USD/JPY: none
- USD/CAD: short (stop loss order at 1.2876)
- USD/CHF: none
- AUD/USD: none
EUR/USD
Quoting our previous Forex Trading Alert:
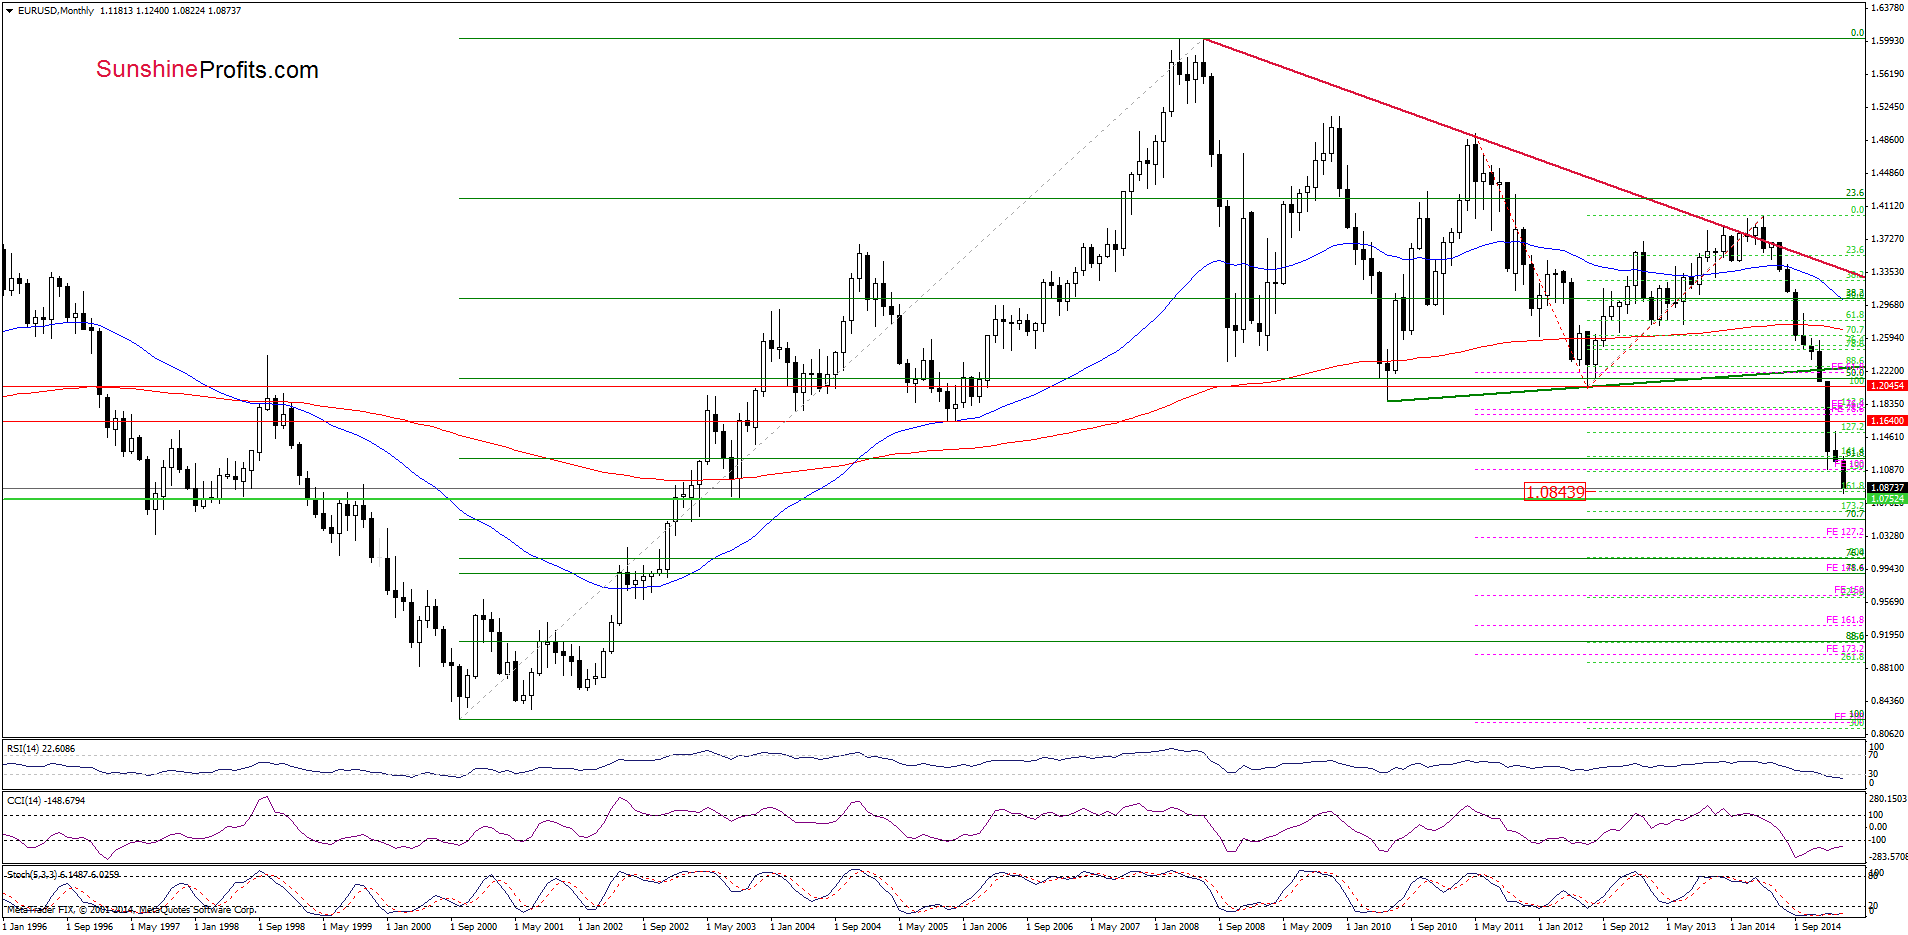
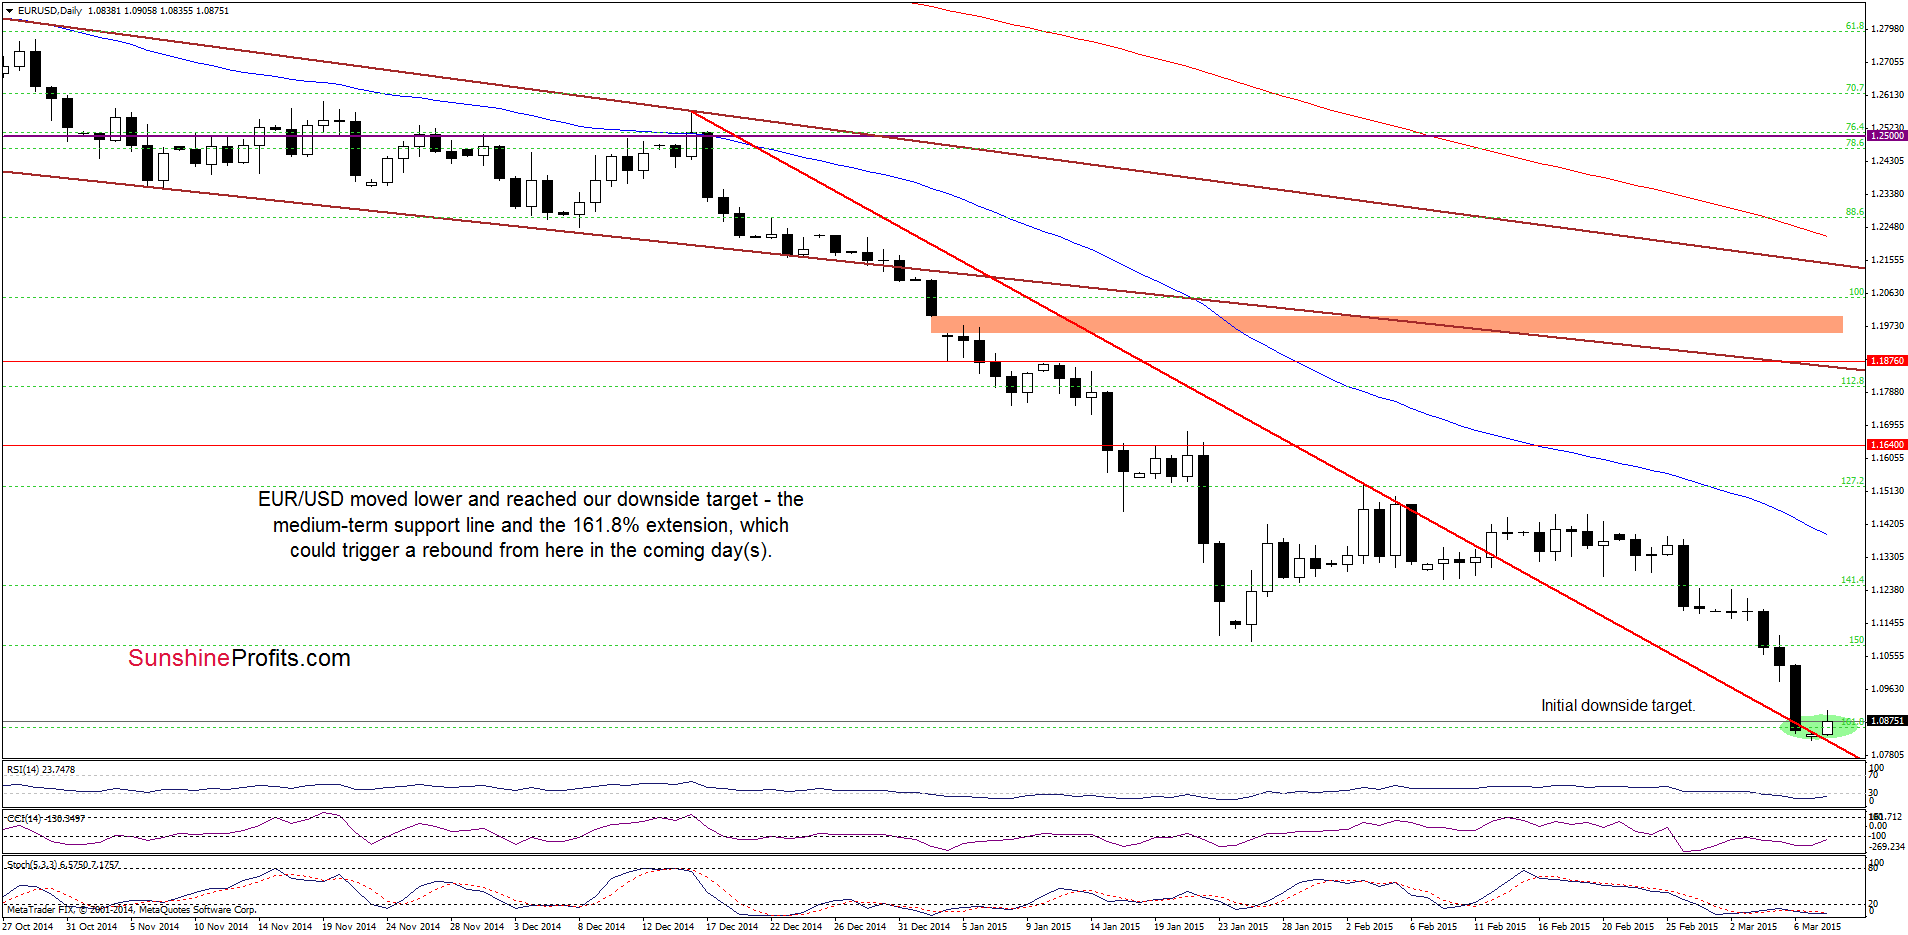
(…) EUR/USD extended losses and hit a fresh 2015 low earlier today. (…) This is a negative signal which suggests further deterioration and a drop to around 1.0844, where the 161.8% Fibonacci extension (based on the Jul 2012 – May 2014 rally is. Additionally, slightly above this level is also the medium-term red declining (…) line, which supports this area.
Looking at the charts, we see that the situation developed in line with the above-mentioned scenario and EUR/USD reached our downside target. As you see on the daily chart, the medium-term red declining support line withstood the selling pressure and triggered a small rebound earlier today. Although this is a positive signal, we should keep in mind that this upswing is barely visible from the medium-term perspective and the exchange rate is still trading well below the Jan lows. All the above suggests that as long as there is no comeback above 1.1097 another test of the red support line is likely. At this point, it’s worth noting that below the current levels (around 1.0762-1.0786) is the support zone based on the Aug and Sep 2003 lows, which could pause further declines in the coming week.
Very short-term outlook: mixed with bearish bias
Short-term outlook: mixed
MT outlook: mixed
LT outlook: mixed
Trading position (short-term; our opinion): No positions are justified from the risk/reward perspective at the moment. We will keep you informed should anything change, or should we see a confirmation/invalidation of the above.
GBP/USD
On Friday, we wrote the following:
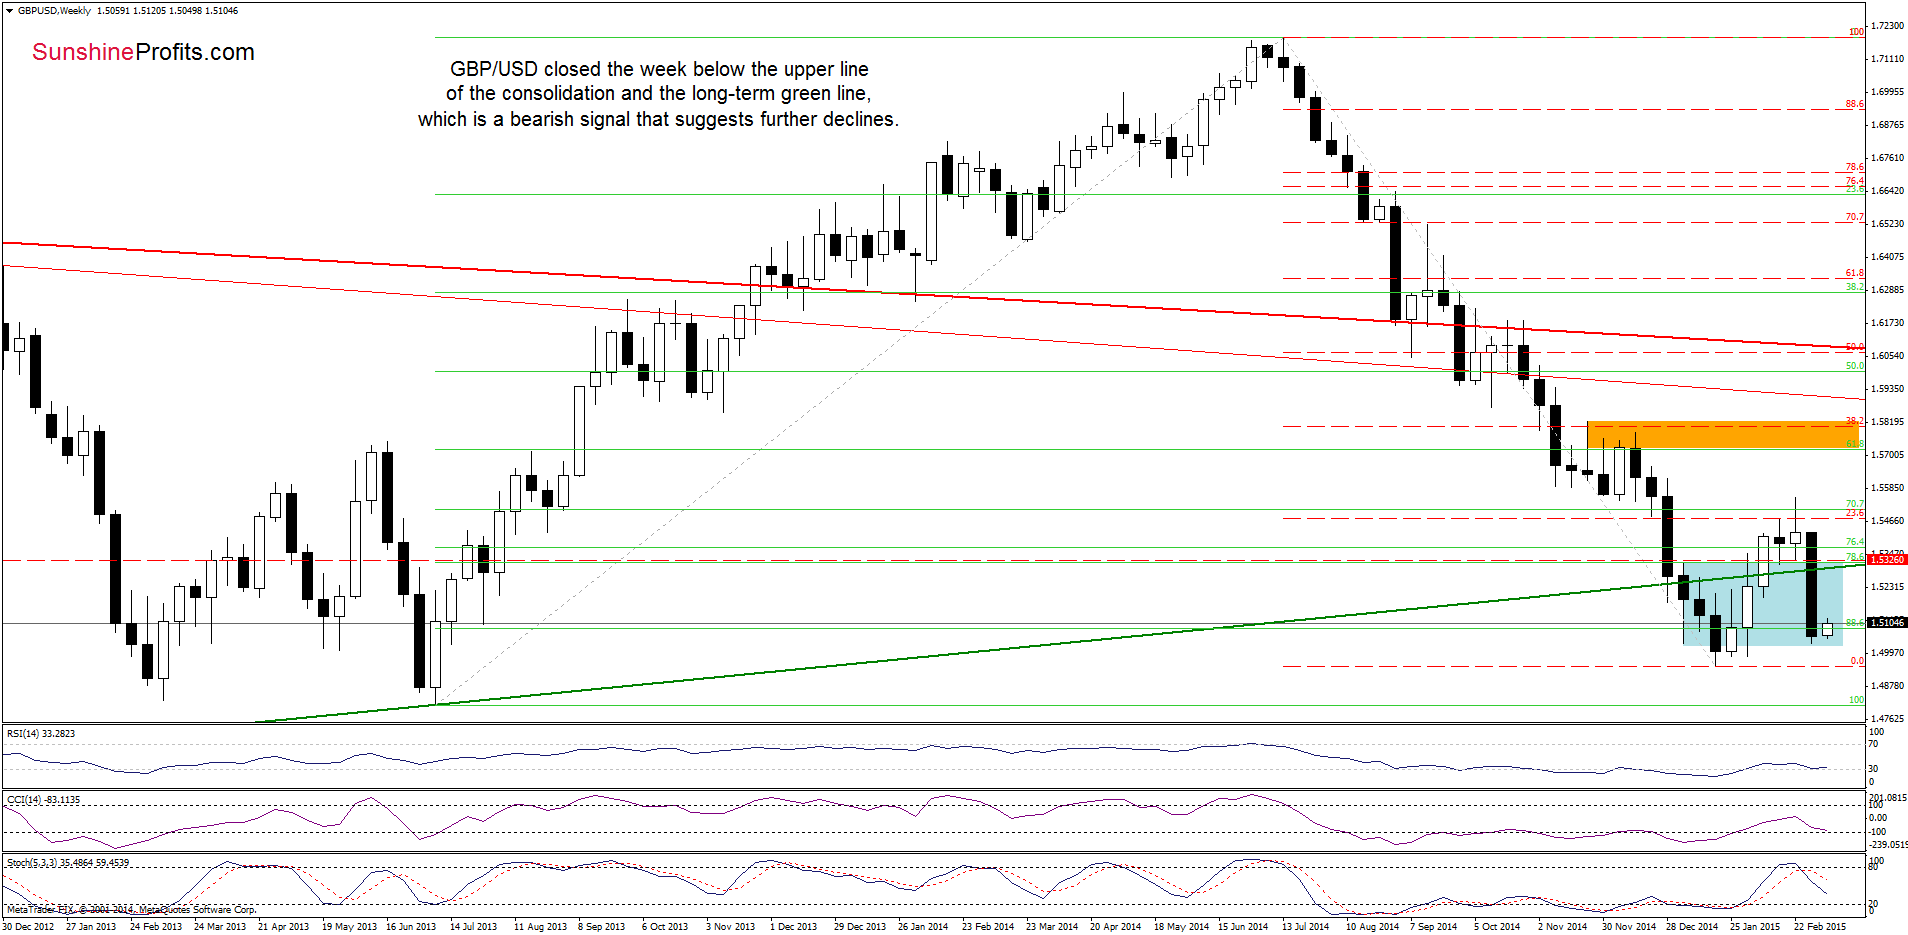
(…) currency bears not only took the exchange rate to our initial downside target, but also managed to push the pair below it, invalidating earlier breakout above these important support lines. This is a negative signal, which suggests further deterioration in the coming week.
How low could the exchange rate go?
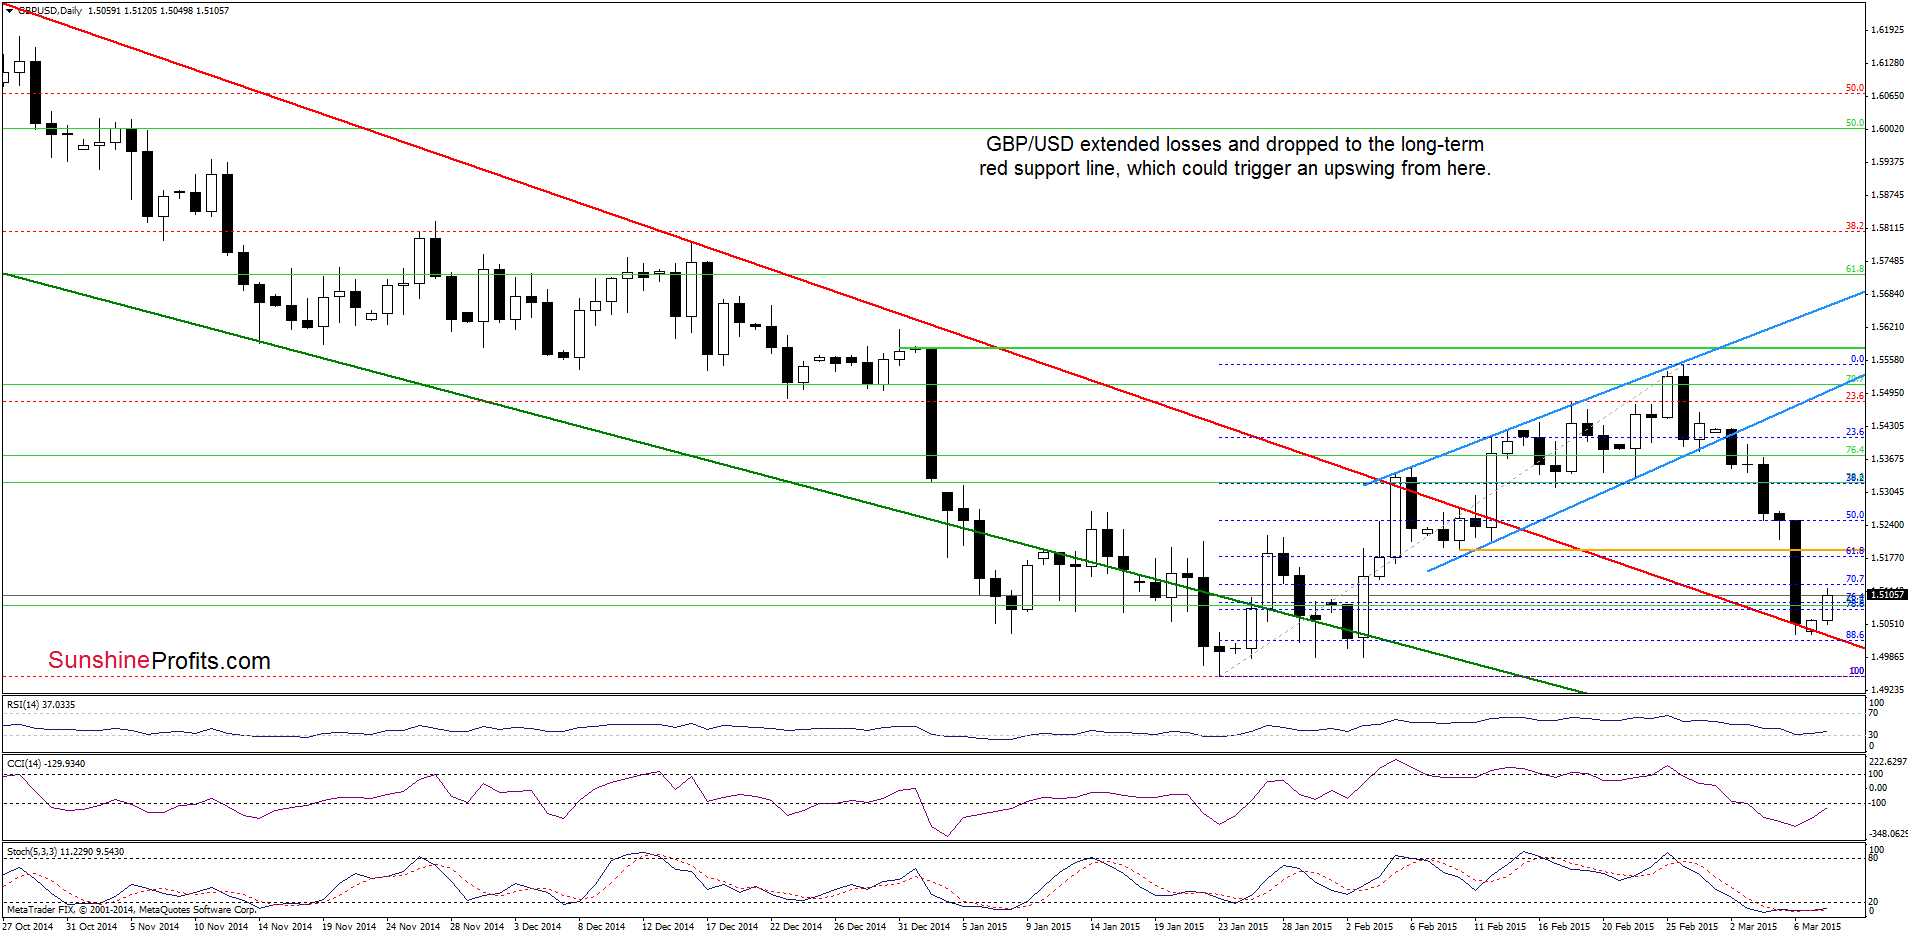
(…) If (…) the pair drops under the 61.8% Fibonacci retracement, the next initial downside target would be around 1.5080-1.5090, where the 76.4% and 78.6% Fibonacci retracement levels are.
As you see on the above charts currency bears not only took GBP/USD to our initial downside target, but also pushed the exchange rate to the long-term red line. From today’s point of view, we see that this support withstood the selling pressure, which encouraged currency bulls to act and resulted in a small rebound earlier today. Although this is a positive signal, the pair remains below the Feb 10 low and the previously-broken medium-term lines. Therefore, we think that as long as there is no invalidation of the breakdown below them another downswing an a test of the strength of the support line (and the 88.6% Fibonacci retracement marked on the daily chart) is likely.
Very short-term outlook: mixed with bearish bias
Short-term outlook: mixed
MT outlook: mixed
LT outlook: mixed
Trading position (short-term; our opinion): No positions are justified from the risk/reward perspective at the moment. We will keep you informed should anything change, or should we see a confirmation/invalidation of the above.
USD/JPY
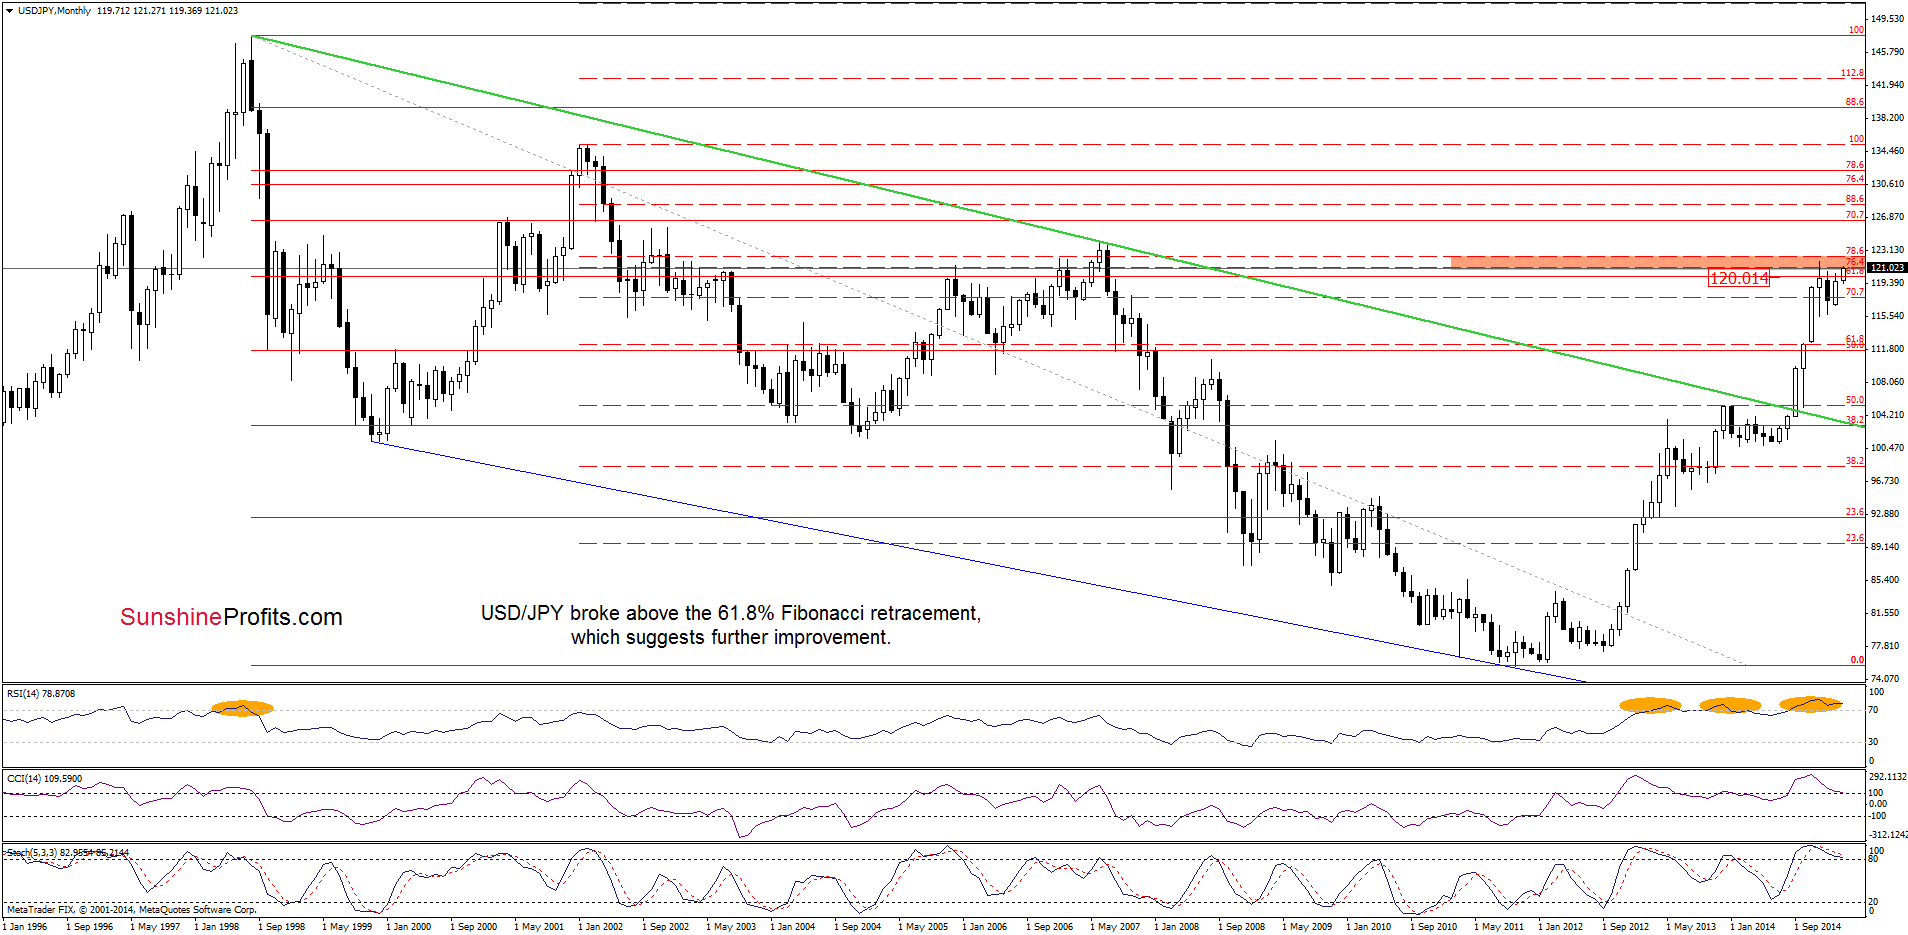
The first thing that catches the eye on the above chart is an invalidation f the breakdown under the 61.8% Fibonacci retracement level (based on the entire 1998-2011 declines), which suggests further improvement.
What impact did this event have on the very short-term picture? Let’s examine the daily chart and find out.
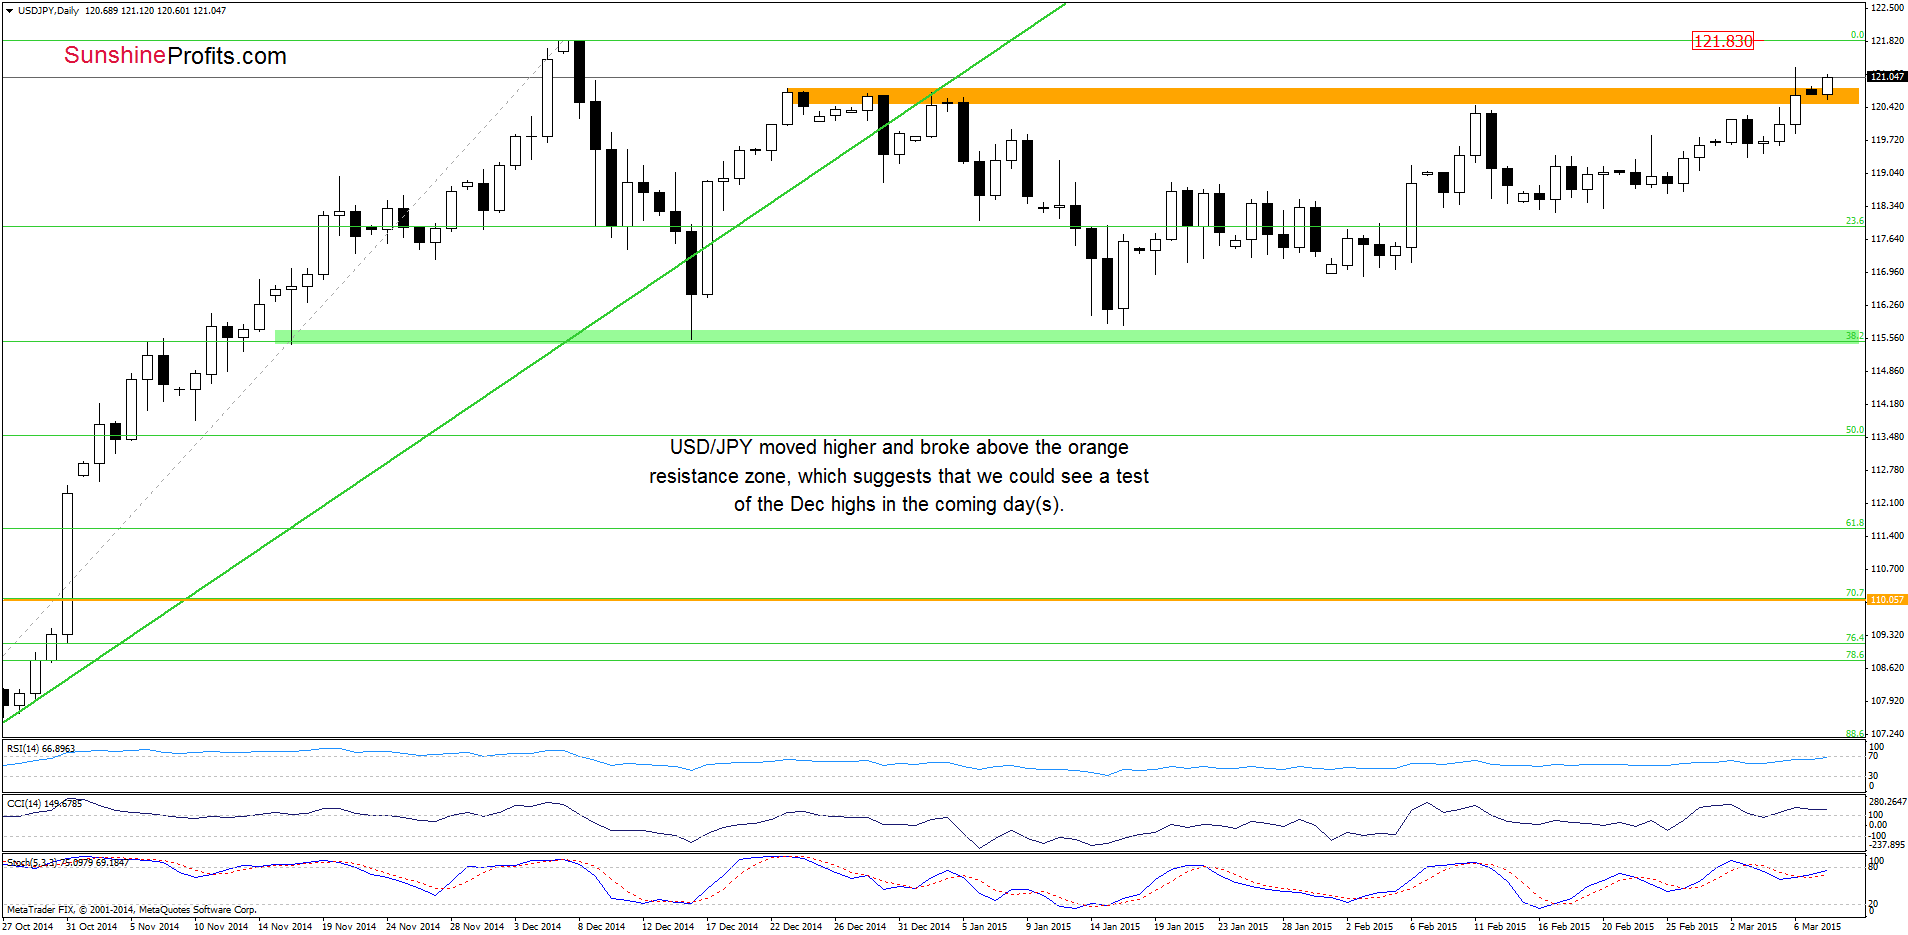
From this perspective, we see that the situation has improved significantly as USD/JPY broke above the orange resistance zone. This bullish signal suggests further improvement and a test of the Dec high of 121.830 in the coming days.
Very short-term outlook: bullish
Short-term outlook: mixed
MT outlook: mixed
LT outlook: bullish
Trading position (short-term; our opinion): No positions are justified from the risk/reward perspective at the moment. We will keep you informed should anything change, or should we see a confirmation/invalidation of the above.
Thank you.
Nadia Simmons
Forex & Oil Trading Strategist
Przemyslaw Radomski, CFA
Founder, Editor-in-chief
Gold & Silver Trading Alerts
Forex Trading Alerts
Oil Investment Updates
Oil Trading Alerts

