
On Wednesday, the ADP report showed that non-farm private employment increased by 212,000 last month, missing expectations for an increase of 220,000. Yesterday, the U.S. Department of Labor showed that the number of initial jobless claims in the week ending February 28 increased by 7,000, missing analysts’ forecasts of a 18,000 drop. Despite these disappointing numbers, the USD Index extended gains and hit a fresh 2015 high. Will today’s closely watched government report on nonfarm payrolls trigger further improvement and an increase above the level of 97? Before we know the answer to this question, let’s take a closer look at the current picture of major currency pairs and find out what impact did the recent rally have on their outlooks.
In our opinion the following forex trading positions are justified - summary:
- EUR/USD: none
- GBP/USD: none
- USD/JPY: none
- USD/CAD: short (stop loss order at 1.2876)
- USD/CHF: none
- AUD/USD: none
EUR/USD
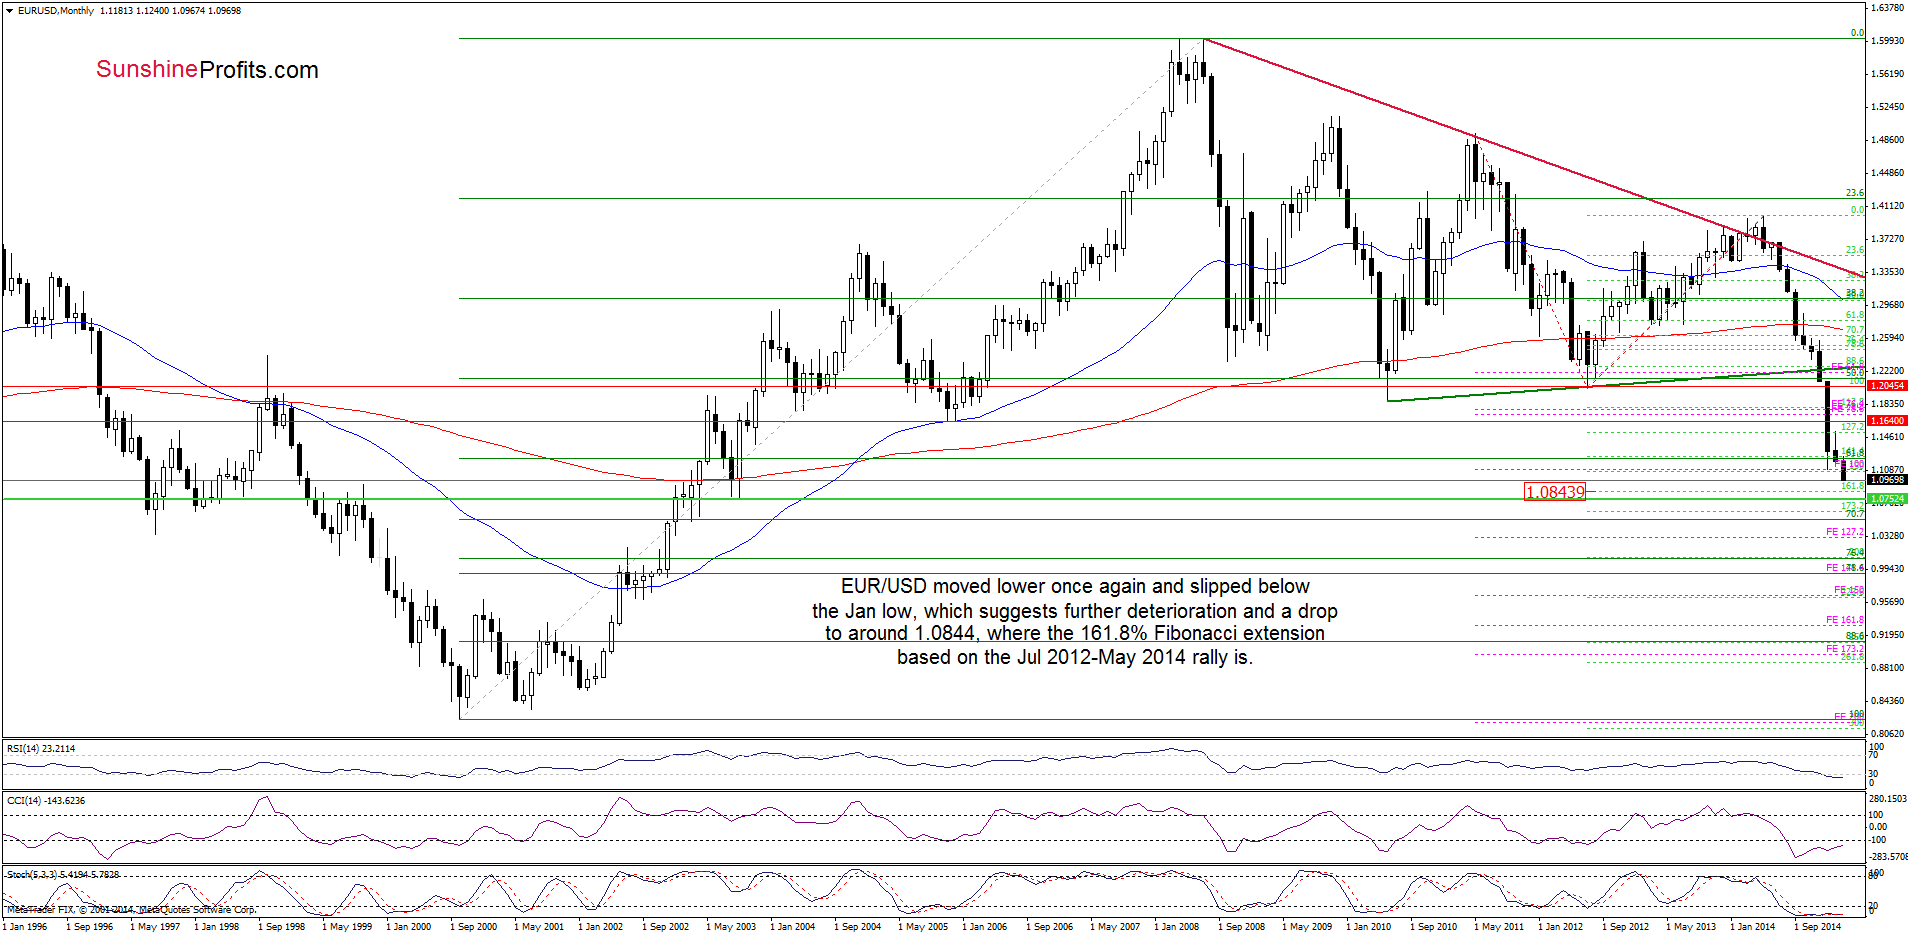
Looking at the charts, we see that EUR/USD extended losses and hit a fresh 2015 low earlier today. Taking this fact into account, we believe that what we wrote yesterday is up-to-date:
(…) This is a negative signal which suggests further deterioration and a drop to around 1.0844, where the 161.8% Fibonacci extension (based on the Jul 2012 – May 2014 rally is. Additionally, slightly above this level is also the medium-term red declining resistance line, which supports this area.
Very short-term outlook: bearish
Short-term outlook: mixed
MT outlook: mixed
LT outlook: mixed
Trading position (short-term; our opinion): No positions are justified from the risk/reward perspective at the moment. We will keep you informed should anything change, or should we see a confirmation/invalidation of the above.
GBP/USD
On Wednesday, we wrote the following:
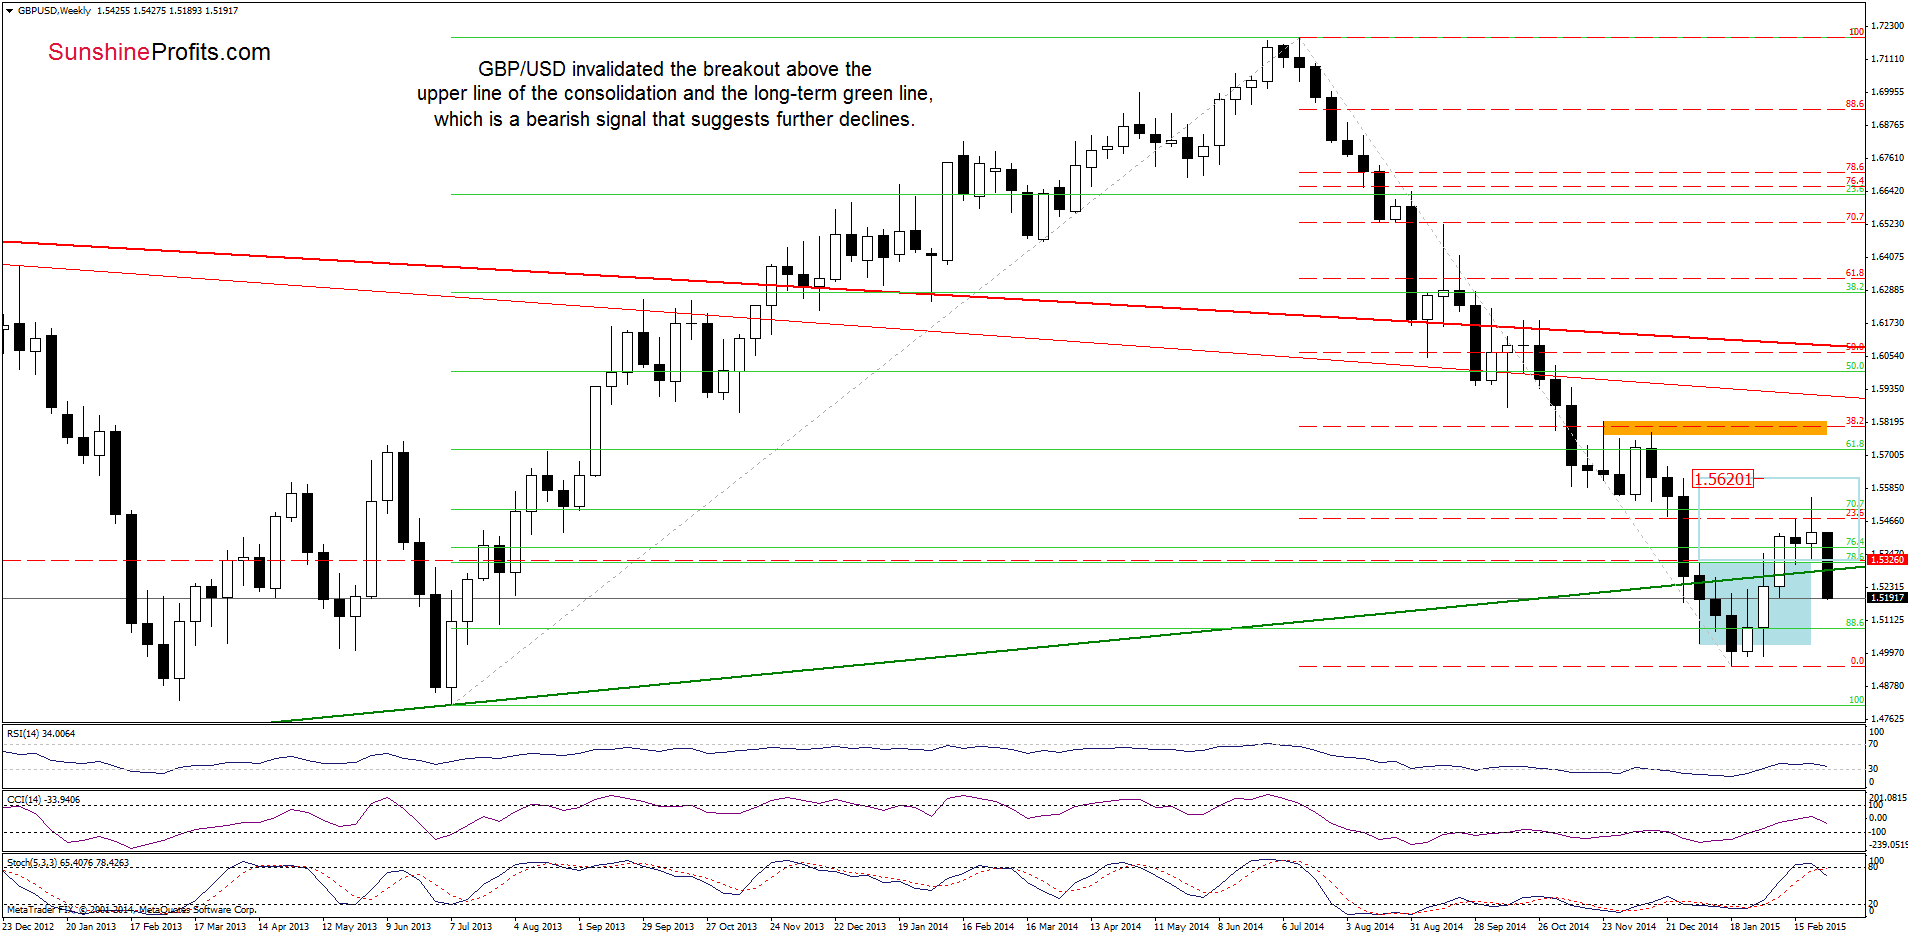
(…) GBP/USD still remains above the previously-broken upper border of the consolidation and the long-term green support line (…) Nevertheless, taking into account the current position of the Stochastic Oscillator, it seems to us that we could see a test of this support area in the coming week.
As you see on the weekly chart, currency bears not only took the exchange rate to our initial downside target, but also managed to push the pair below it, invalidating earlier breakout above these important support lines. This is a negative signal, which suggests further deterioration in the coming week.
How low could the exchange rate go? Let’s examine the daily chart and look for more clues.
Quoting our last commentary on this currency pair:
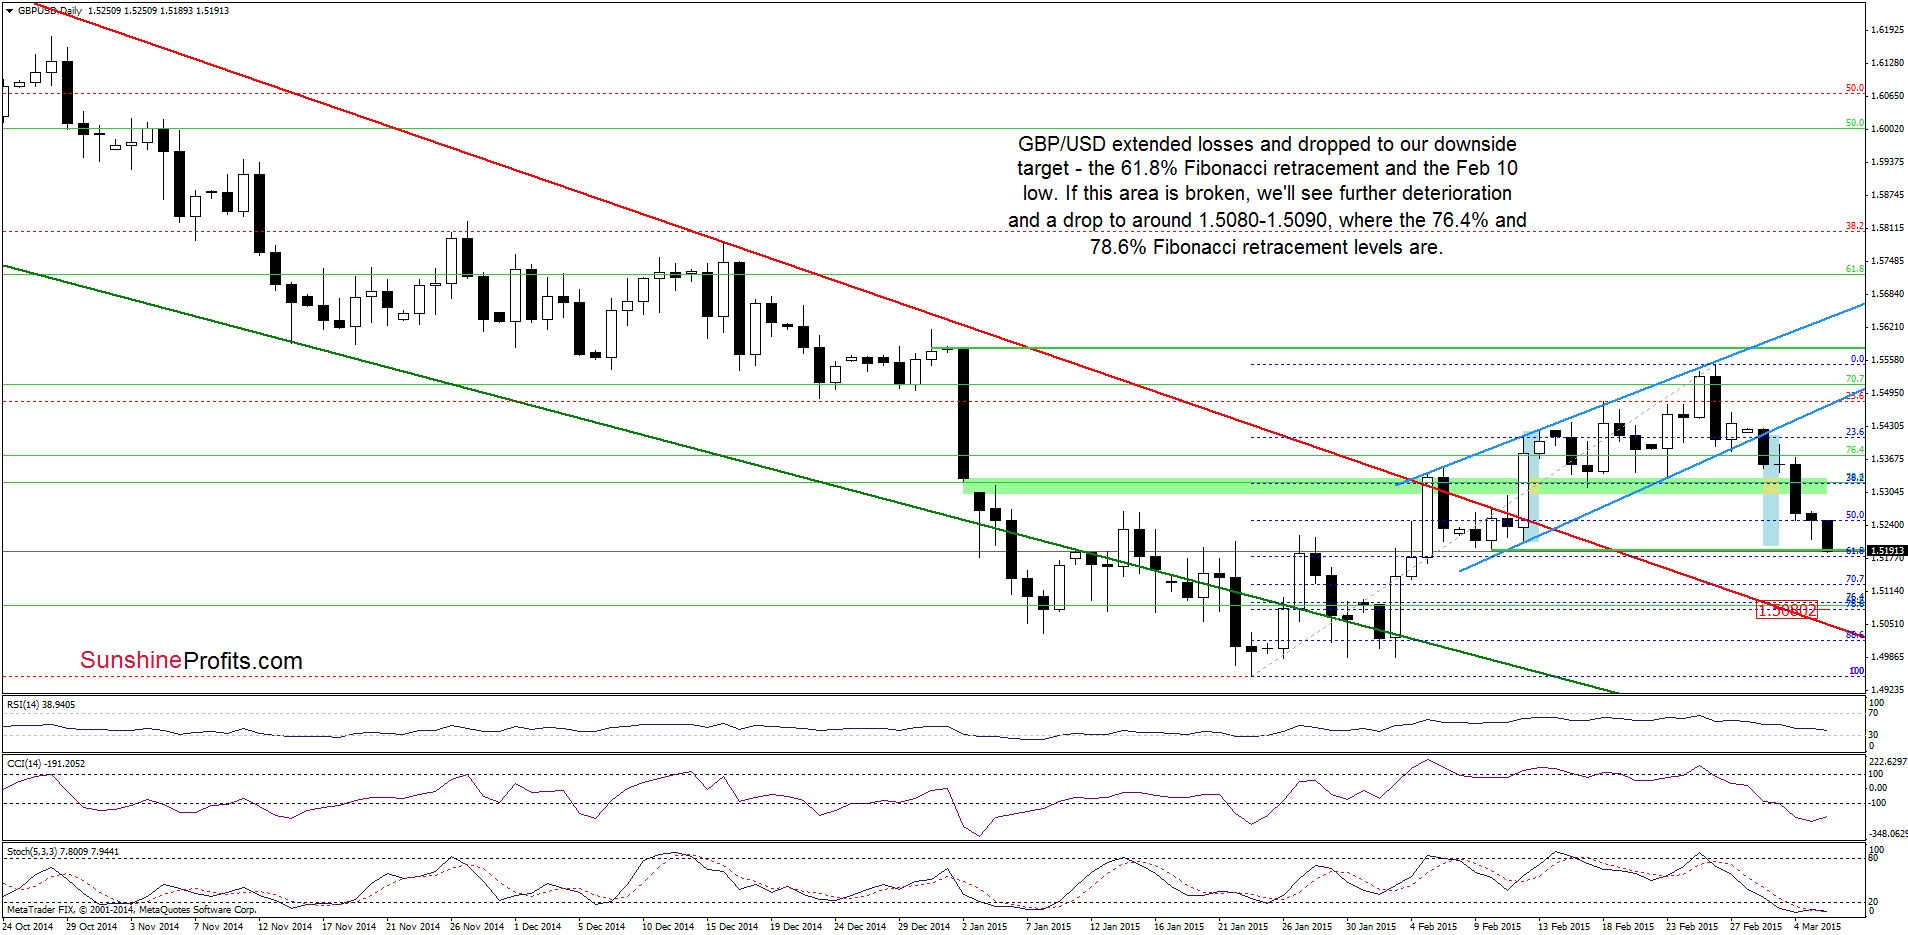
(…) it seems that the space for growth is limited as the previously-broken lower border of the rising trend channel serves as the nearest resistance. Taking this fact into account, and combining it with the position of the indicators (the CCI and Stochastic Oscillator are oversold, but there are no buy signals at the moment), we think that further deterioration is just around the corner. If this is the case (…) the exchange rate might drop even to around 1.5176-1.5195, where the Feb 10 and the 61.8% Fibonacci retracement (based on the entire recent rally) is. (…) Nevertheless, it seems to us that we’ll see such low values of the exchange rate only if currency bears break below the medium-term support area around 1.5268-1.5318
From this perspective, we see that the situation developed in line with the above-mentioned scenario and GBP/USD reached our downside target earlier today. What’s next? Taking into account an invalidation of the breakout seen on the weekly chart and the current position of the daily and weekly indicators (weekly Stochastic Oscillator generated a sell signal), we think that we’ll see lower values of the exchange rate in the coming week. If this is the case, and the pair drops under the 61.8% Fibonacci retracement, the next initial downside target would be around 1.5080-1.5090, where the 76.4% and 78.6% Fibonacci retracement levels are.
Very short-term outlook: mixed with bearish bias
Short-term outlook: mixed
MT outlook: mixed
LT outlook: mixed
Trading position (short-term; our opinion): No positions are justified from the risk/reward perspective at the moment. We will keep you informed should anything change, or should we see a confirmation/invalidation of the above.
USD/JPY
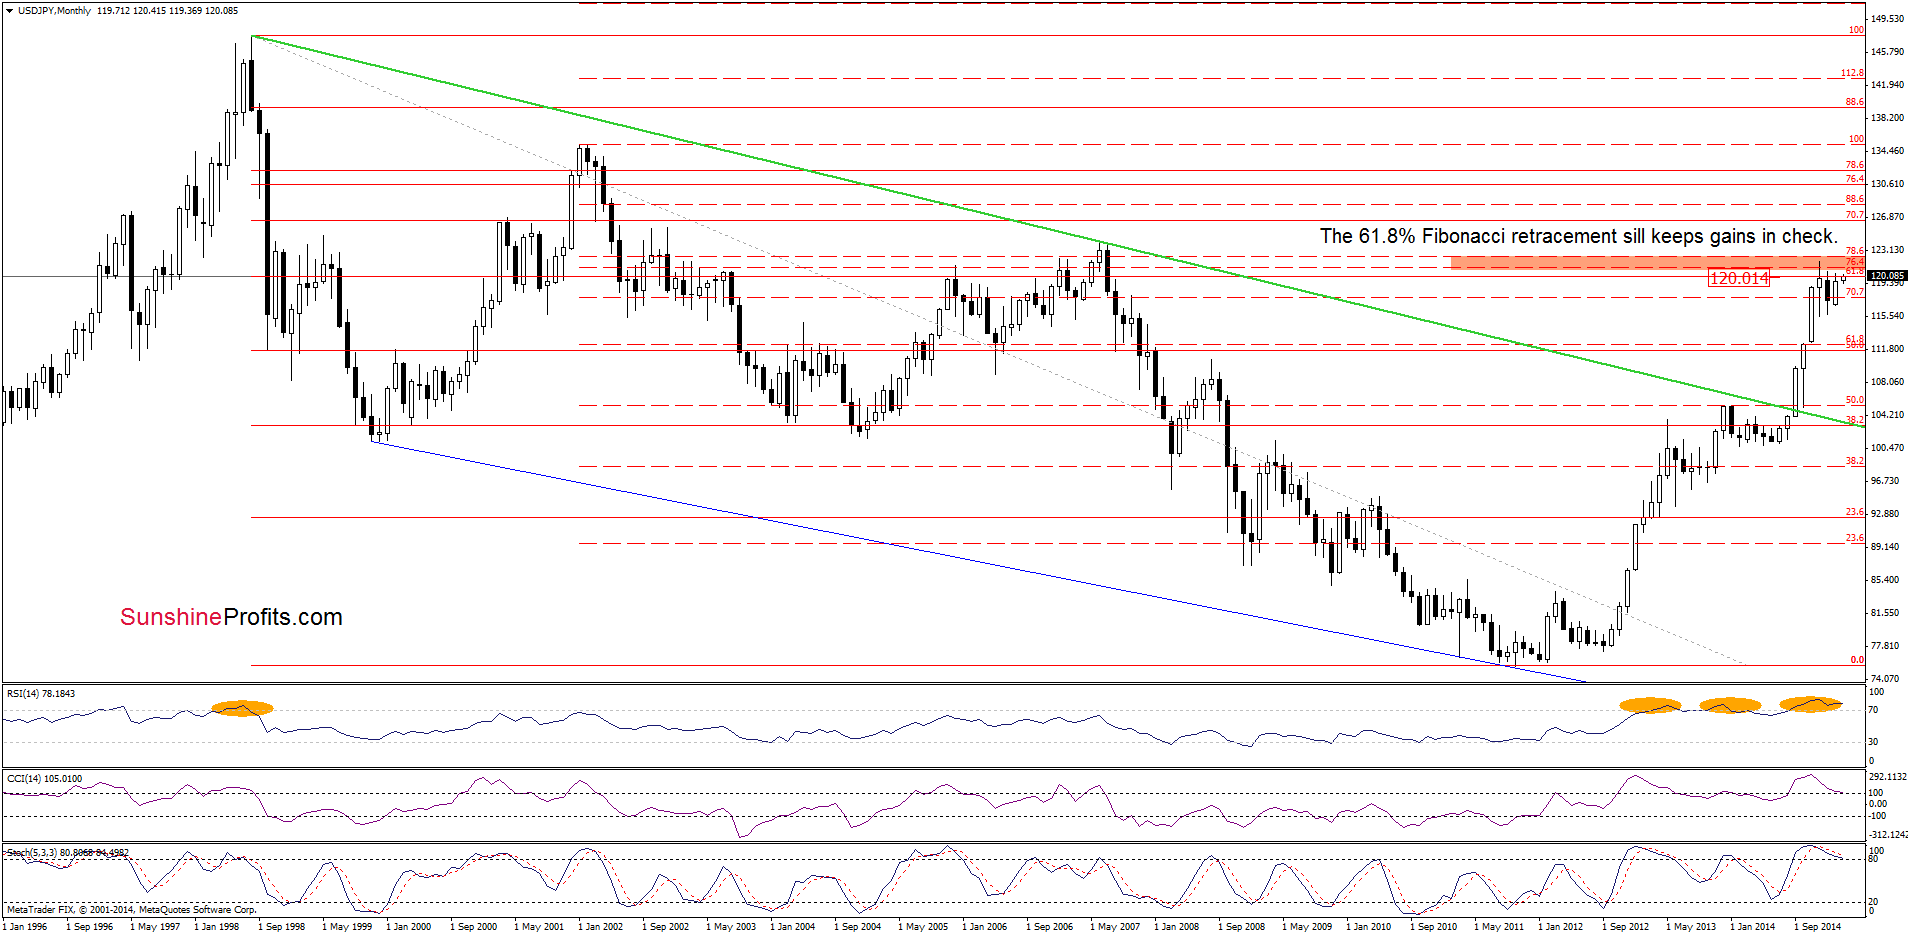
The situation in the medium term hasn’t changed much as the exchange rate still remains under the 61.8% Fibonacci retracement level based on the entire 1998-2011 declines.
Did the very short-trm picture change in the recent days?
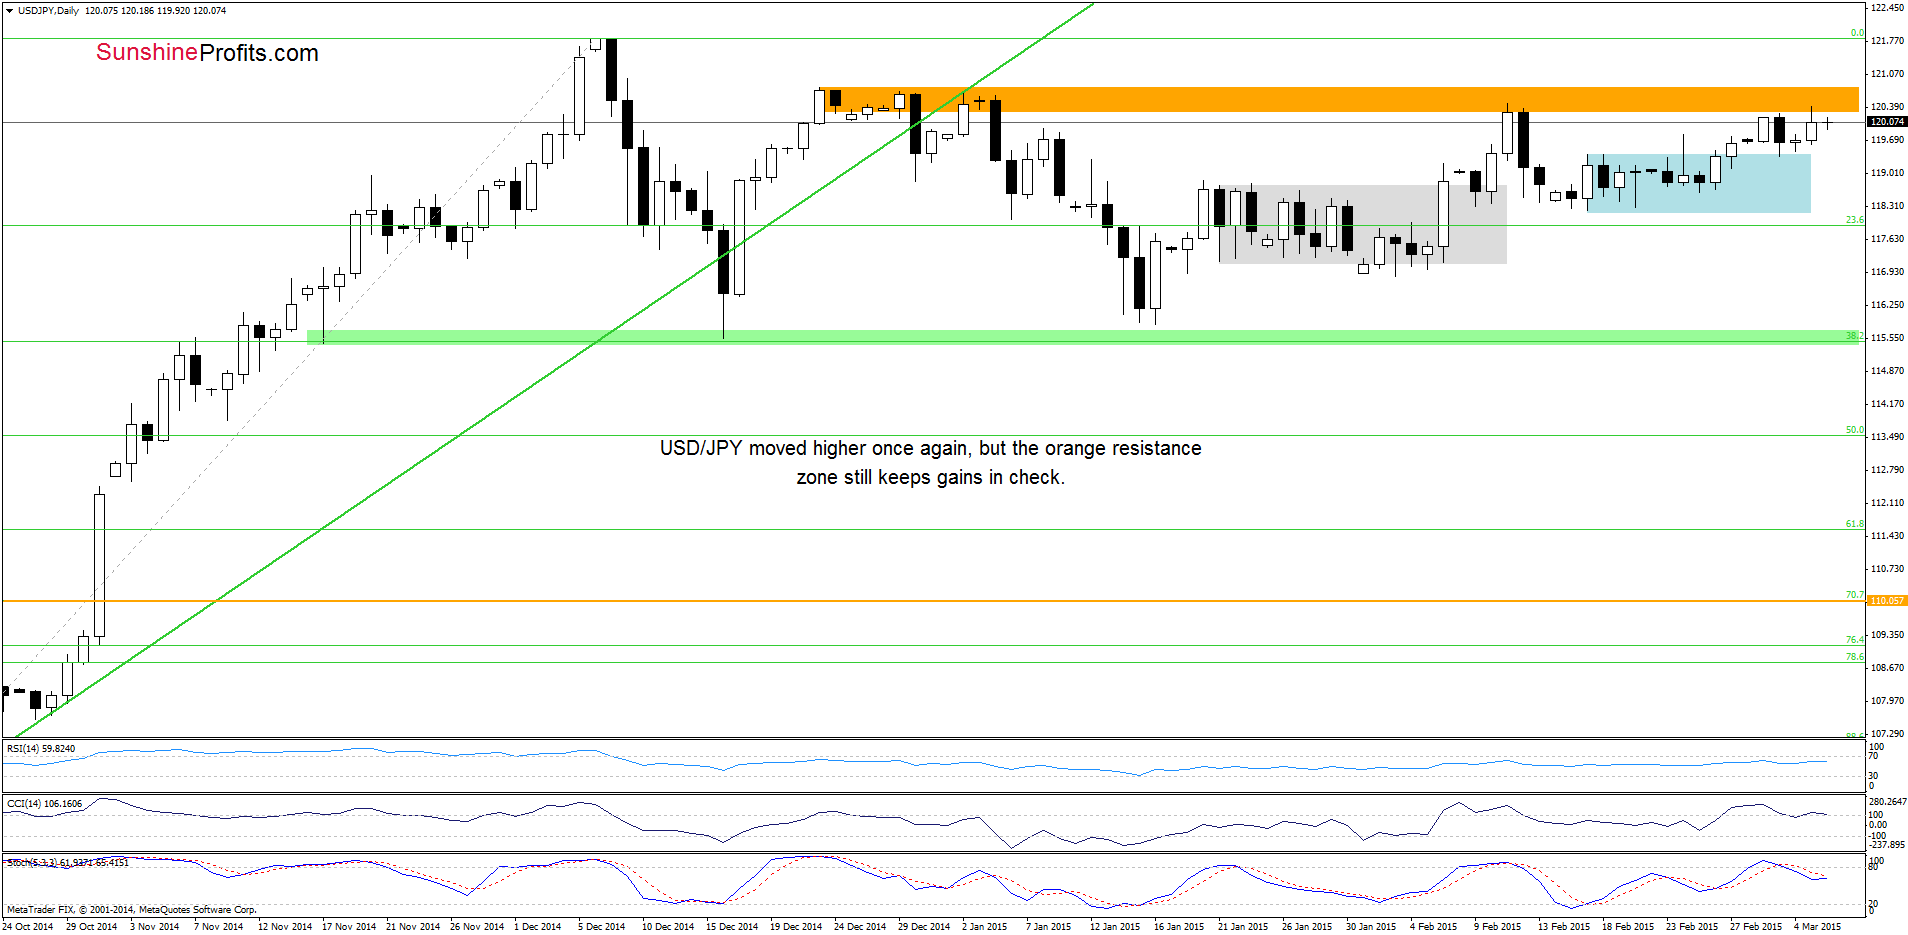
On the daily chart, we see that although USD/JPY moved little higher yesterday, the pair still remains under the orange resistance zone (reinforced by the above-mentioned 61.8% Fibonacci retracement). Therefore, we believe that our last commentary on this currency pair is still valid:
(…) as long as this area is in play further ally is questionable. The reason? In the previous weeks, we saw similar attempts to move higher, but as you see on the daily chart, they all failed, which suggests that history will repeat once again – especially when we factor in the current position of the indicators (…). If this is the case, the initial downside target for currency bears would be around 118.23, where the bottom of the previous correction is.
Very short-term outlook: mixed with bearish bias
Short-term outlook: mixed
MT outlook: mixed
LT outlook: bullish
Trading position (short-term; our opinion): No positions are justified from the risk/reward perspective at the moment. We will keep you informed should anything change, or should we see a confirmation/invalidation of the above.
USD/CAD
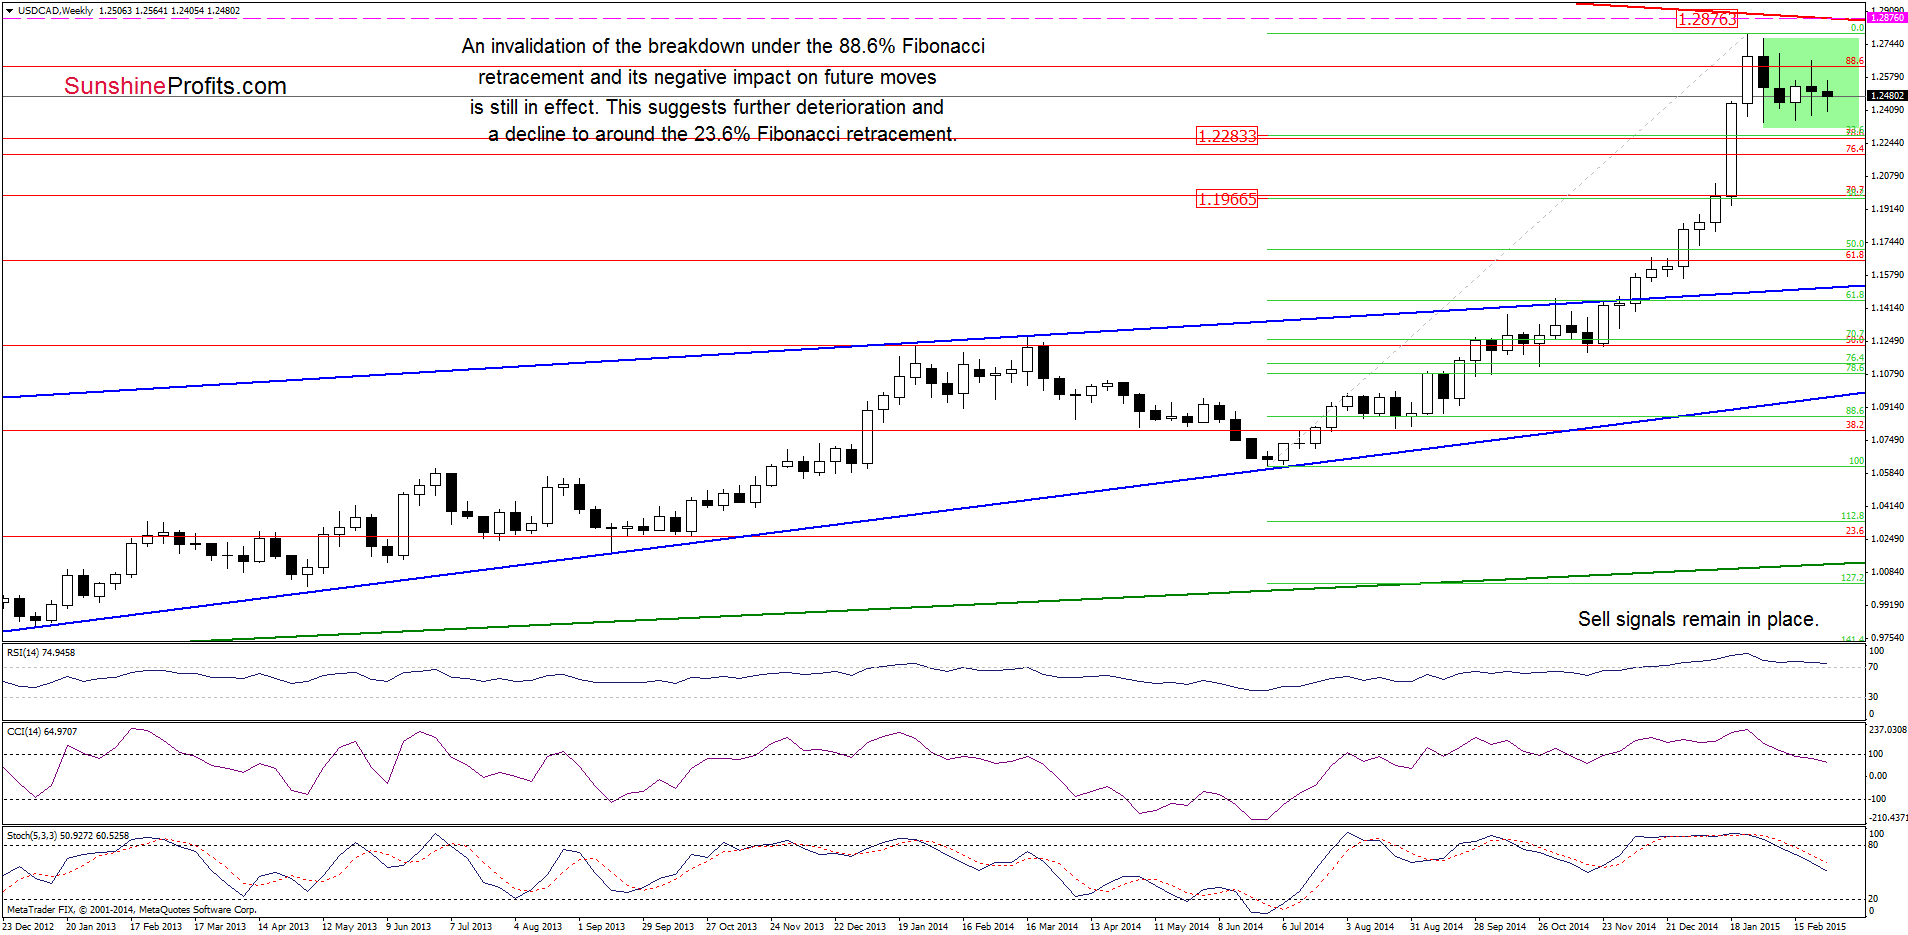
The situation in the medium-term hasn’t changed much as the invalidation of the breakout above the 88.6% Fibonacci retracement and its negative impact on future moves is still in effect. Therefore, our last commentary is up-to-date:
(…) we believe that further deterioration is just around the corner. If this is the case, the initial downside target would be the 23.6% Fibonacci retracement based on the entire Jun-Jan rally (around 1.2275). If it is broken, we’ll see a decline to the 38.2% retracement (at 1.1973) in the coming week. Additionally, sell signals generated by the CCI and Stochastic Oscillator are still in play, supporting the bearish case.
Having said that, let’s check the daily chart.
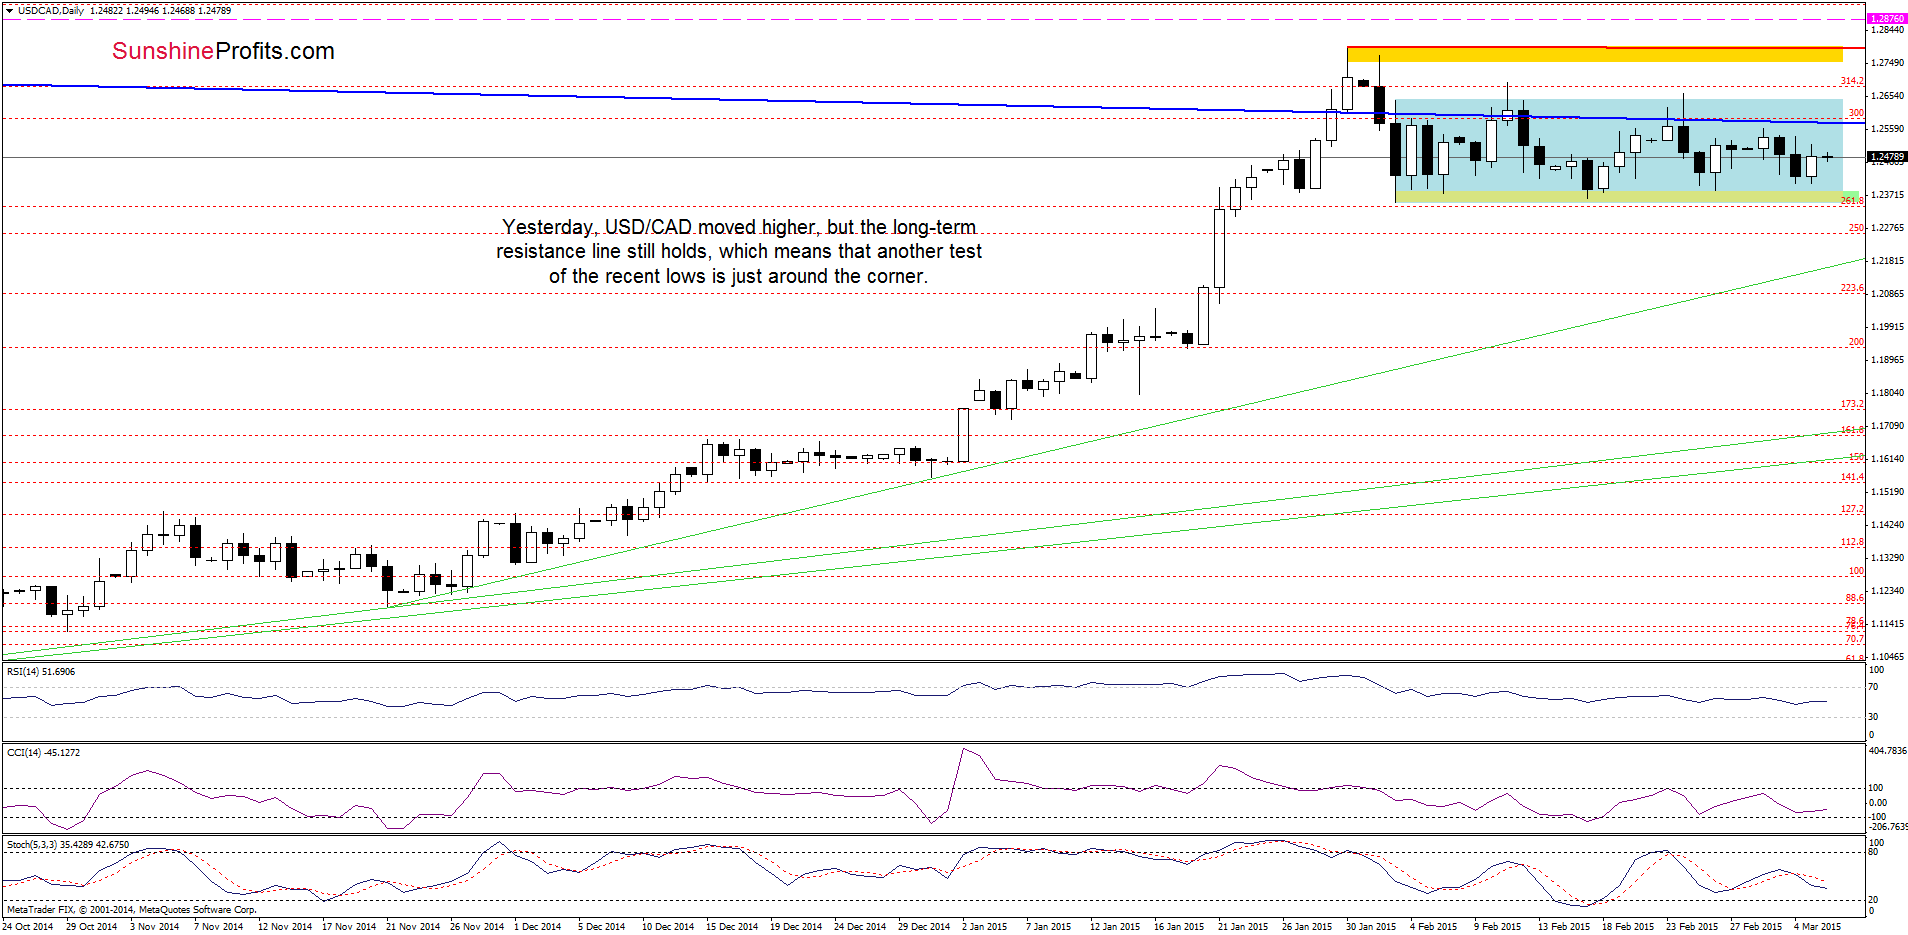
Yesterday, USD/CAD moved higher once again, but the long-term resistance line still holds, which means that another test of the support zone created by the recent lows (around 1.2351-1.2361) is just around the corner.
Very short-term outlook: bearish
Short-term outlook: mixed with bearish bias
MT outlook: mixed
LT outlook: mixed
Trading position (short-term; our opinion): Short positions with a stop loss order at 1.2876 are still justified from the risk/reward perspective. We will keep you informed should anything change, or should we see a confirmation/invalidation of the above.
USD/CHF
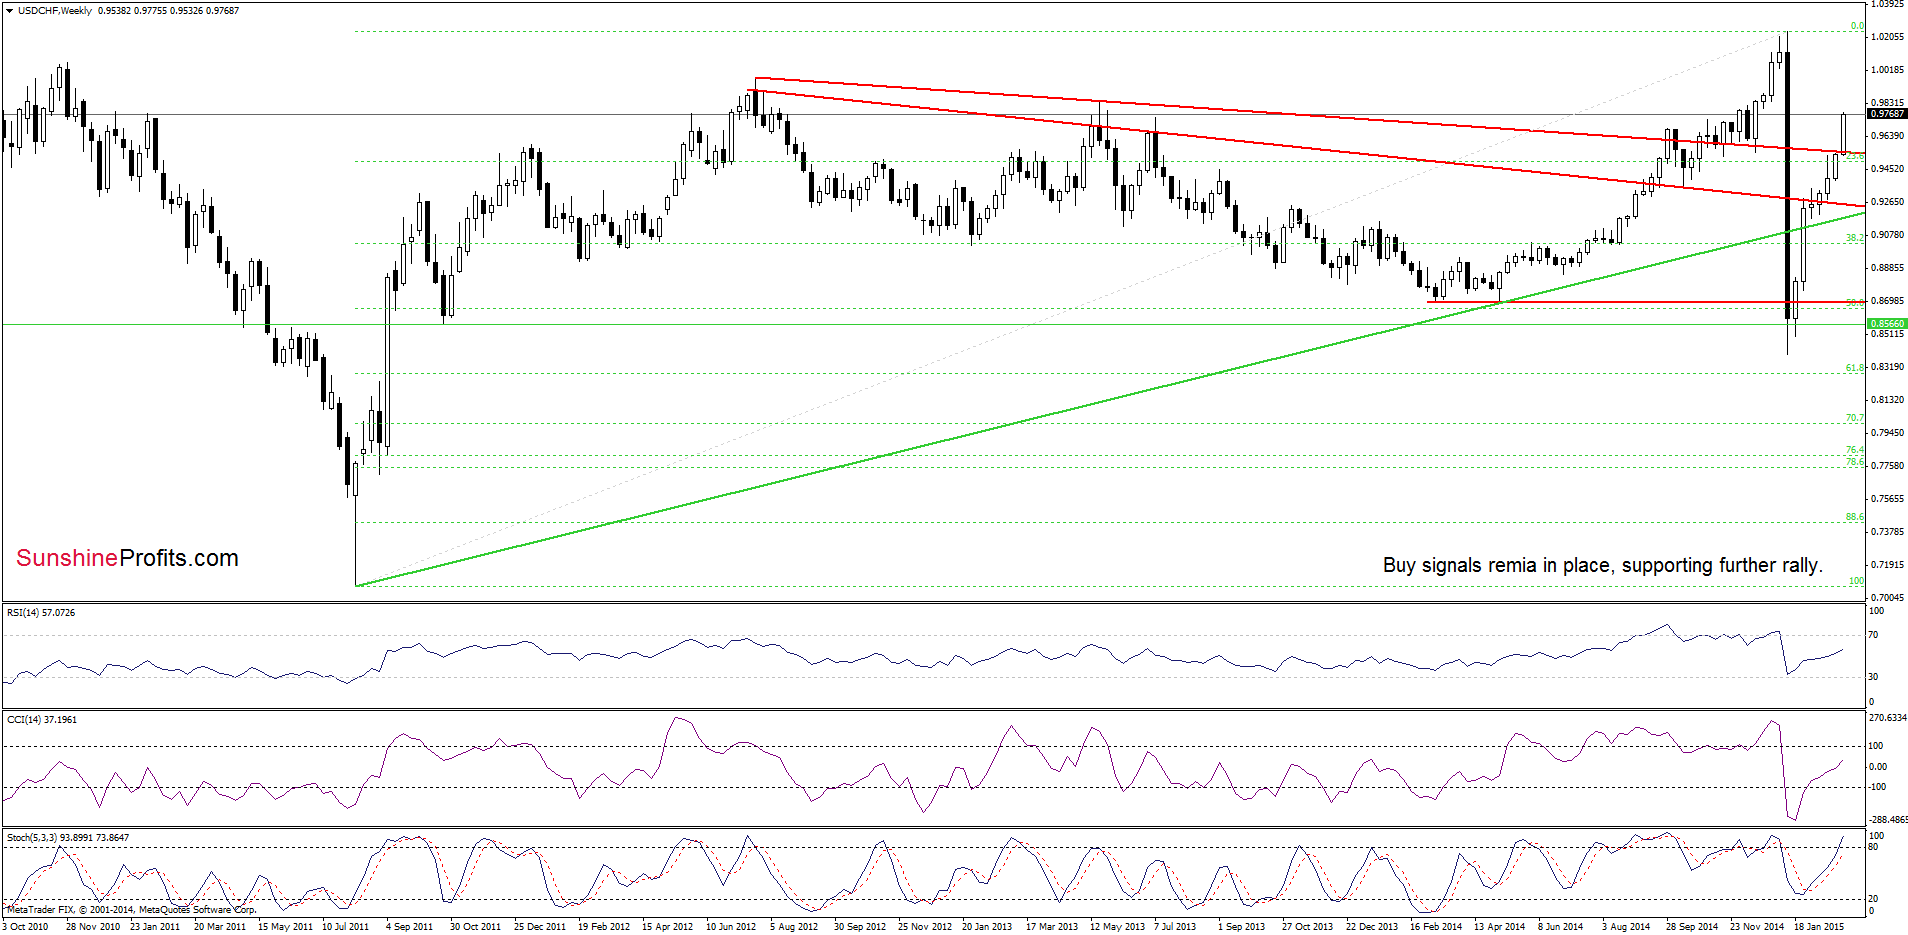
On the above chart, we see that the situation in the medium term remains bullish as USD/CHF extended gains and buy signals generated by the indicators are still in play, supporting the bullish case.
How high could the exchange rate go? Let’s examine the daily chat and find out.
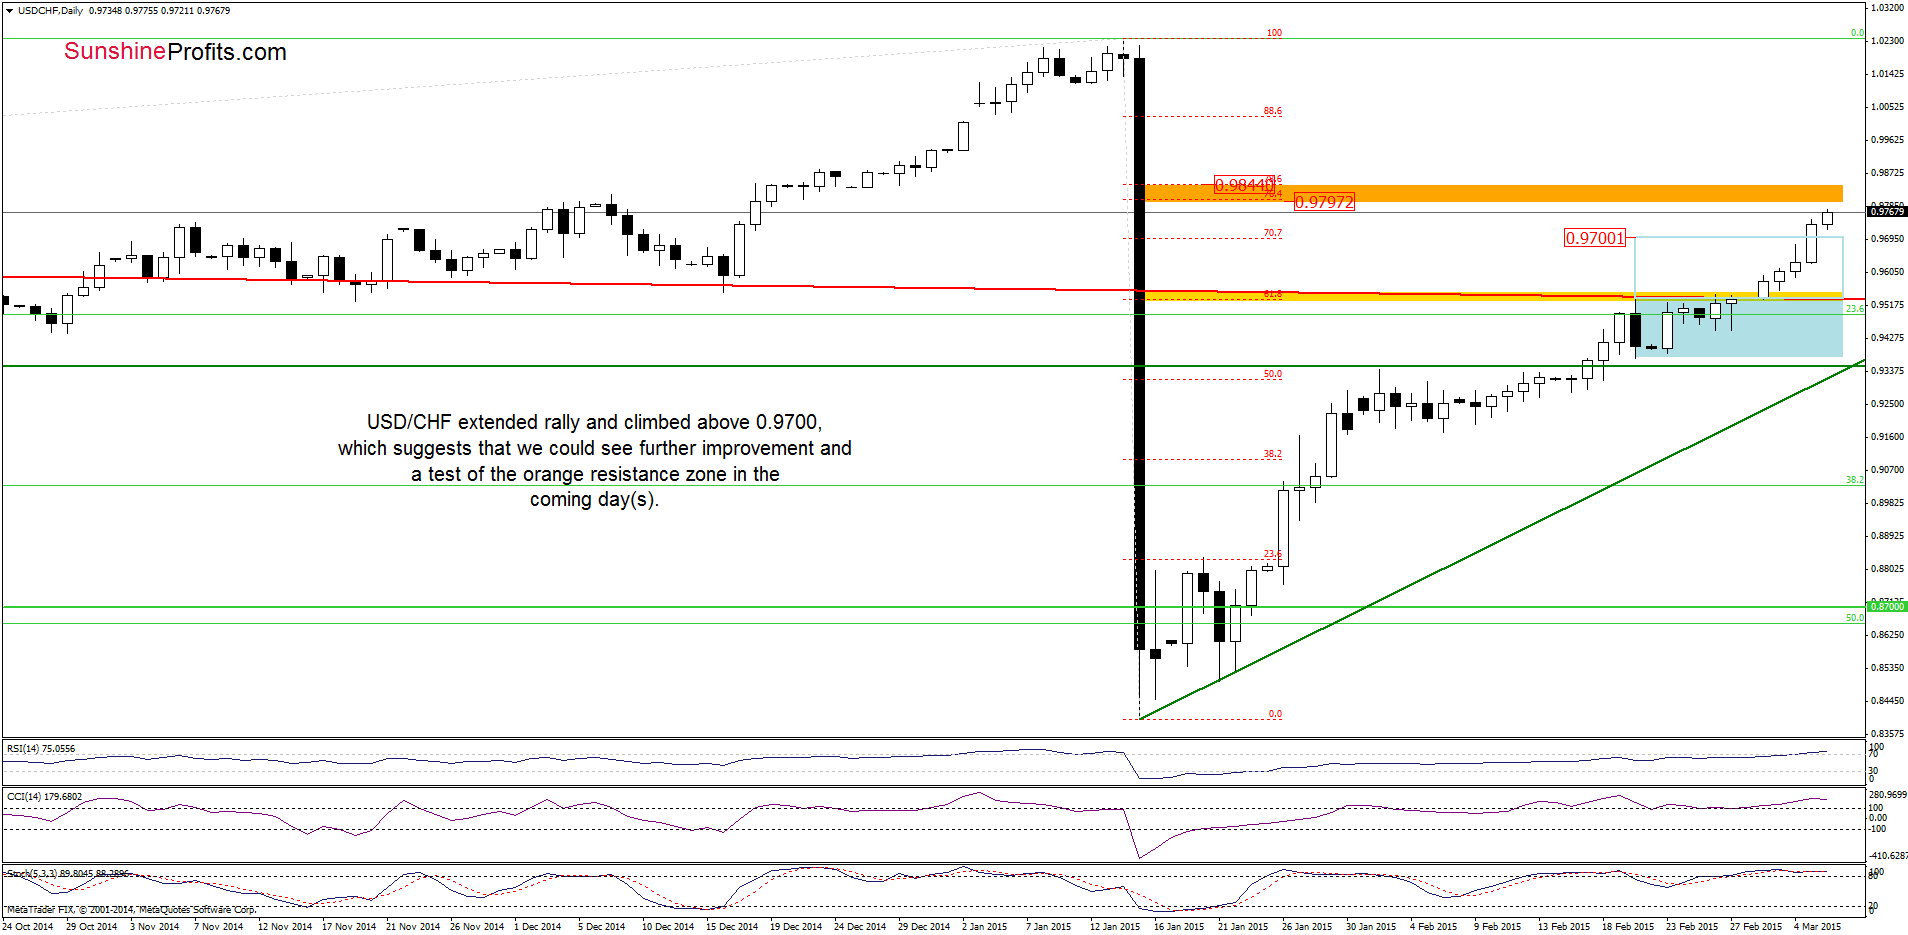
From this perspective we see that USD/CHF moved higher once again and broke above the barrier of 0.9700, which means that the scenario from our yesterday’s Forex Trading Alert is still in play:
(…) If (…) USD/CHF breaks above the barrier of 0.9700, we’ll likely see a rally to around 0.9797-0.9844, where the orange resistance zone created by the 76.4% and 78.6% Fibonacci retracement levels is. Nevertheless, we should keep in mind that the CCI and Stochastic Oscillator are overbought, while RSI climbed above the level of 70, which suggests that the space for further rally might be limited and the probability of a trend reversal is just around the corner (especially if the indicators generate sell signals in the coming days).
Very short-term outlook: mixed with bullish bias
Short-term outlook: mixed
MT outlook: mixed
LT outlook: bearish
Trading position (short-term; our opinion): No positions are justified from the risk/reward perspective at the moment. We will keep you informed should anything change, or should we see a confirmation/invalidation of the above.
AUD/USD
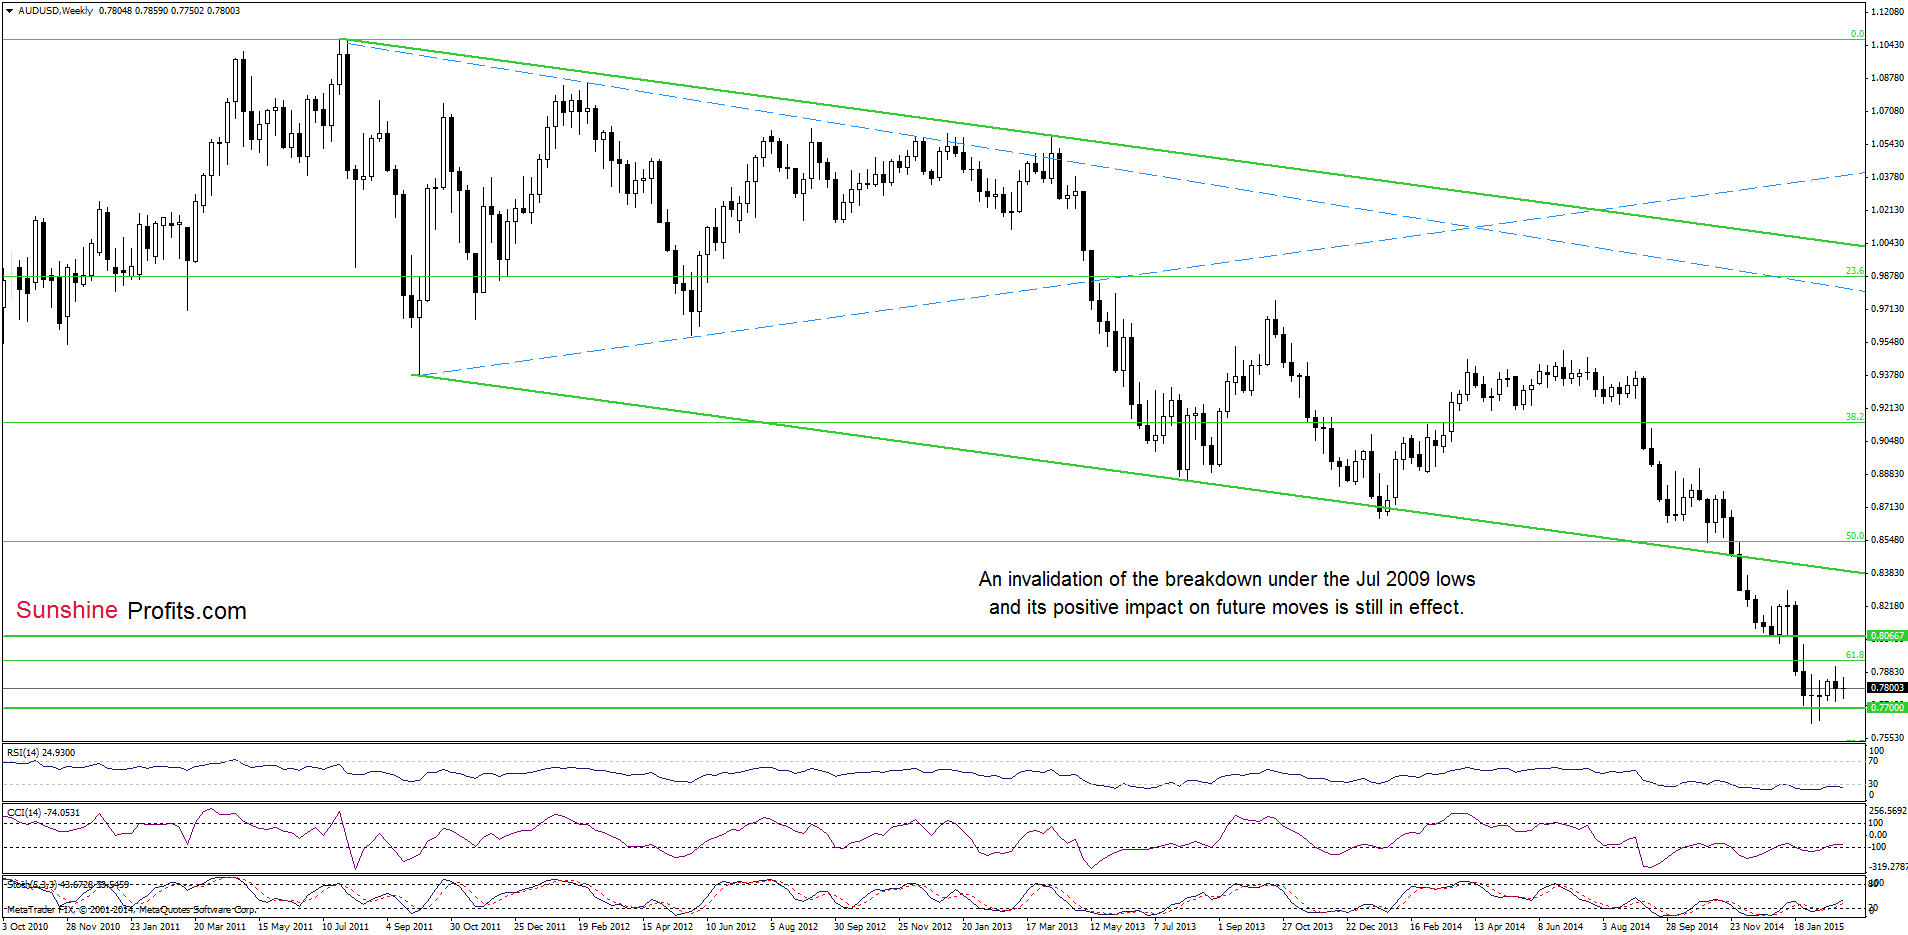
The situation in the medium term hasn’t changed much as an invalidation of the breakdown below the Jul 2009 lows and its potential positive impact on future moves is still in effect.
Having said that, let’s take a closer look at the daily chart.
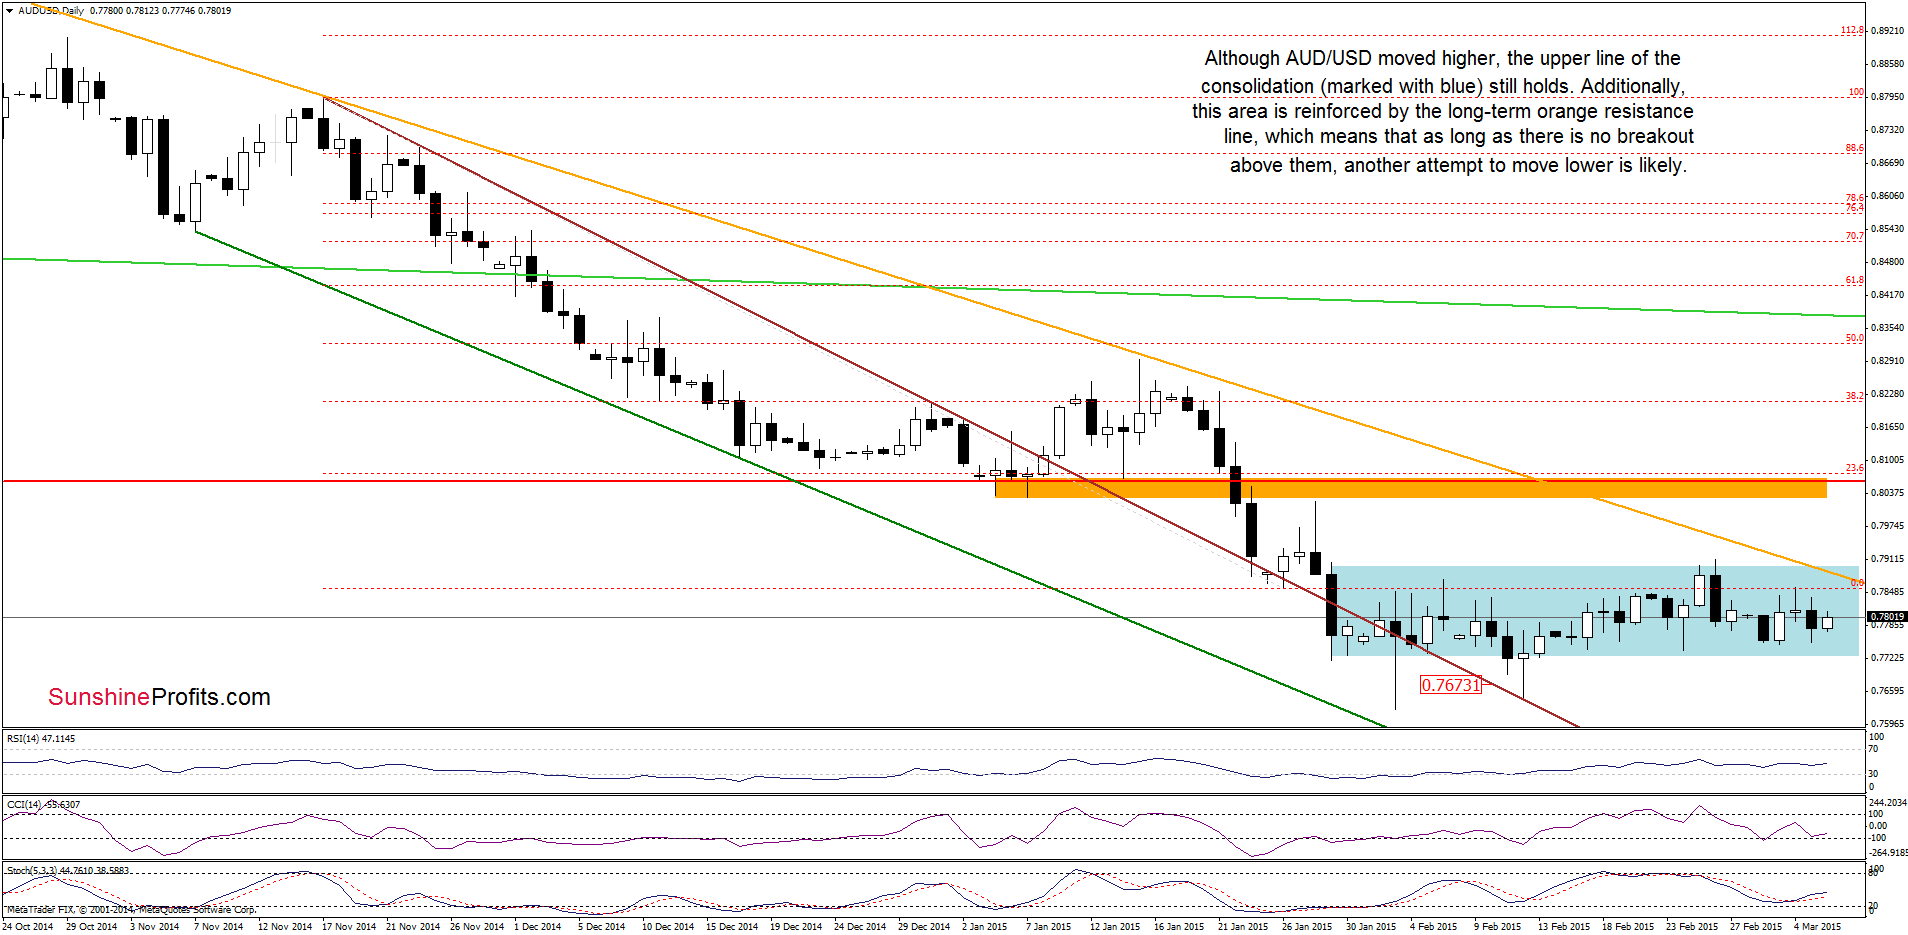
On the above chart, we see that although the pair moved higher on Wednesday, the proximity to the upper border of the consolidation (marked with blue) and the long-term orange resistance line encouraged currency bears to act, which resulted in a pullback. Despite this drop, AUD/USD is still trading in a narrow range, which means that as long as there is no breakout above the above-mentioned resistance zone, another attempt to move lower is likely. If this is the case, the initial target for currency bears would be around 0.7718-0.7738 where the Feb 24 and the lower line of the consolidation are.
Very short-term outlook: mixed with bearish bias
Short-term outlook: mixed
MT outlook: mixed
LT outlook: mixed
Trading position (short-term; our opinion): No positions are justified from the risk/reward perspective at the moment. We will keep you informed should anything change, or should we see a confirmation/invalidation of the above.
Thank you.
Nadia Simmons
Forex & Oil Trading Strategist
Przemyslaw Radomski, CFA
Founder, Editor-in-chief
Gold & Silver Trading Alerts
Forex Trading Alerts
Oil Investment Updates
Oil Trading Alerts

