
Although today’s Markit’s data showed that its U.K. manufacturing purchasing managers' index climbed to 54.1 in Feb, beating analysts’ expectation for an increase to 53.4, the exchange rate reversed and declined, breaking under its important support line. How low could the pair go?
In our opinion the following forex trading positions are justified - summary:
- EUR/USD: none
- GBP/USD: none
- USD/JPY: none
- USD/CAD: short (stop loss order at 1.2876)
- USD/CHF: none
- AUD/USD: none
EUR/USD
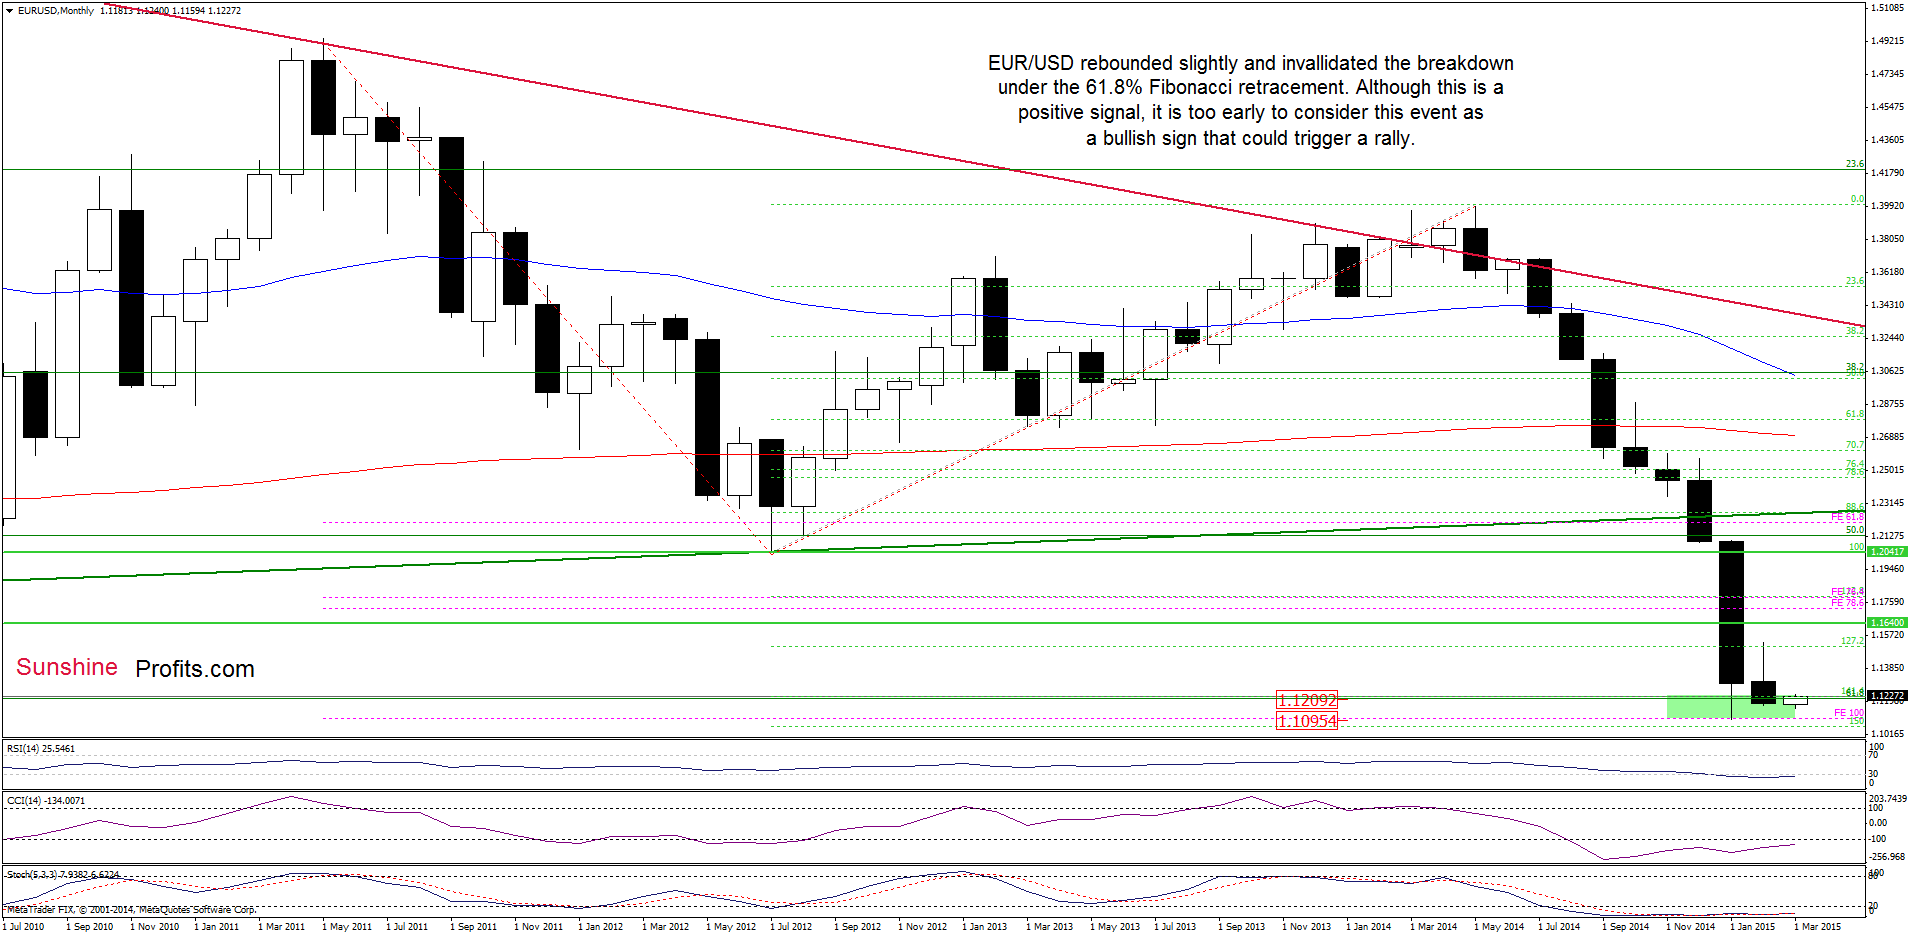
The situation in the medium term has improved slightly as EUR/USD reversed and came back above the 61.8% Fibonacci retracement (based on the entire 2000-2008 rally), invalidating earlier breakdown. As you know from our previous alerts, such price action is a positive signal, however, we think that it is too early to consider this event as a bullish signal that could trigger a rally, because this week’s increase is barely visible from this perspective and there are still four days to the end of the week.
Having said that, let’s focus on the very short-term picture.
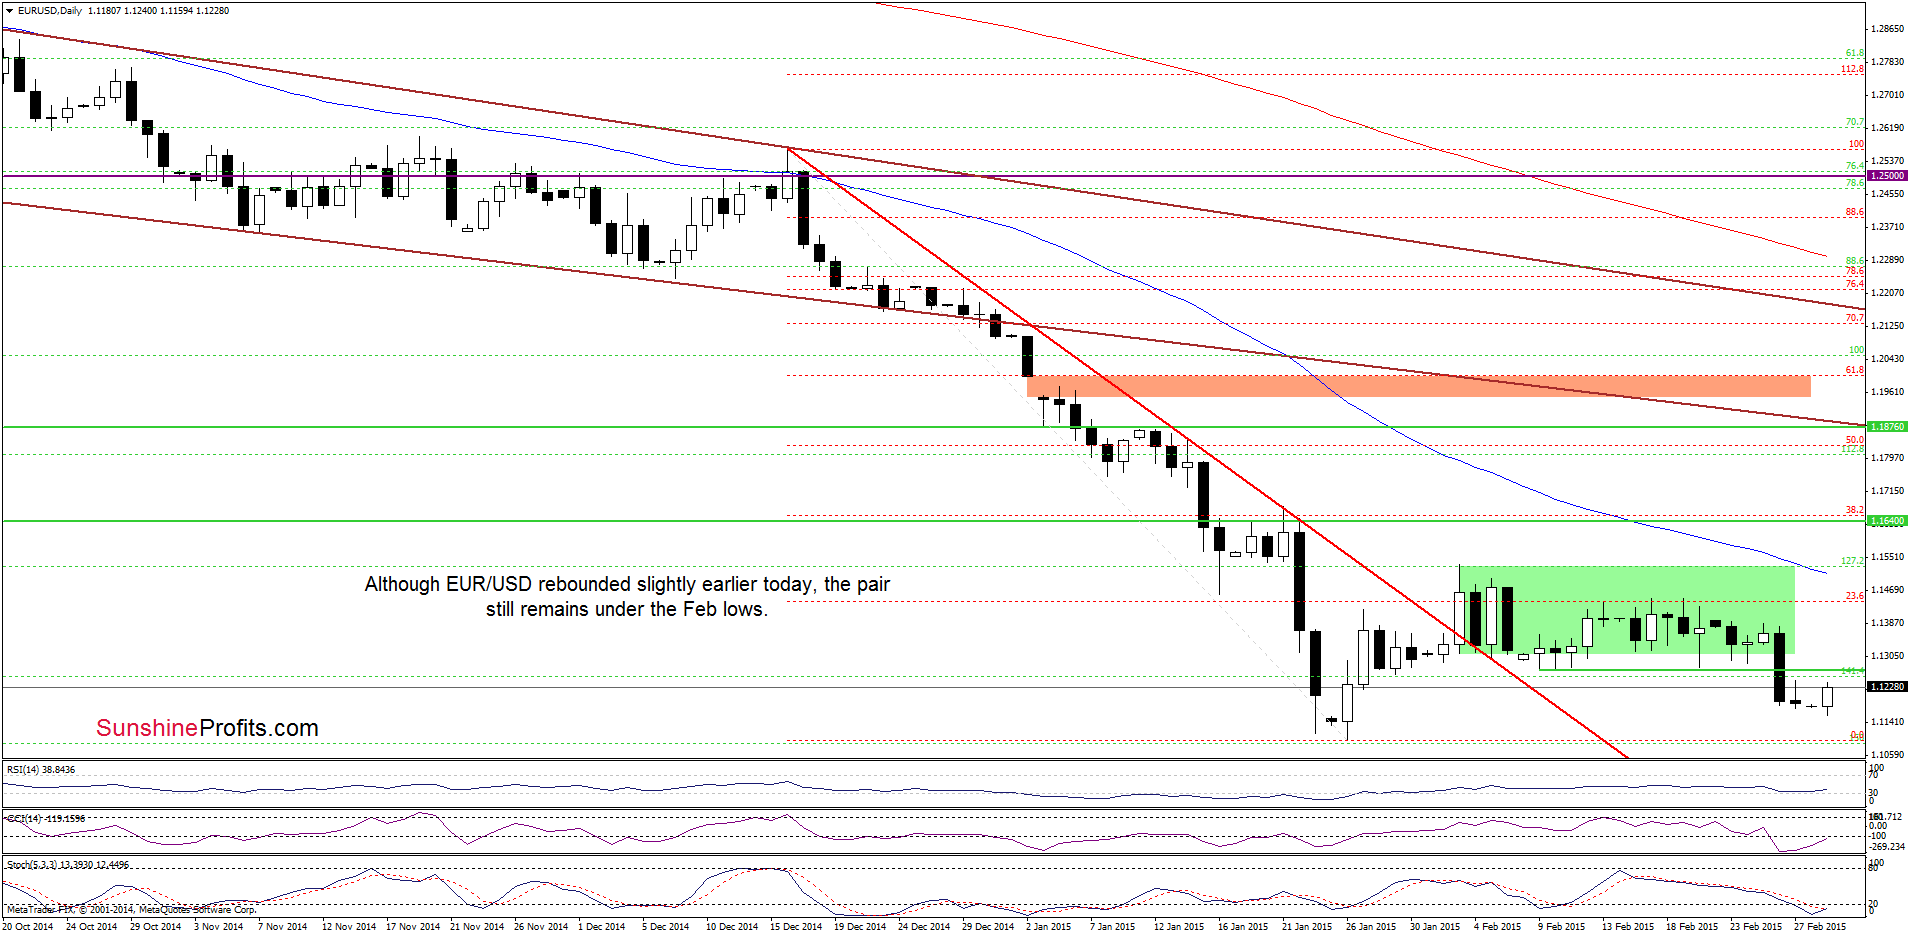
On the above chart, we see that although EUR/USD rebounded slightly earlier today, the pair still remains under the previously-broken support/resistance zone created by the Feb lows. Therefore, what we wrote on Friday is still valid:
(…) What does it mean for the exchange rate? If currency bulls manage to invalidate yesterday’s breakdown, it would be a bullish signal, which will trigger further improvement and a comeback to the green consolidation range. On the other hand, if this area withstands the buying pressure, EUR/USD will reverse and test the above-mentioned 61.8% Fibonacci retracement (based on the entire 2000-2008 rally) once again. Which scenario is more likely? The current position of the indicators suggests that a reversal is just around the corner.
Nevertheless, we should keep in mind that as long as there are no buy signals, another drop is in play.
Very short-term outlook: mixed
Short-term outlook: mixed
MT outlook: mixed
LT outlook: mixed
Trading position (short-term; our opinion): No positions are justified from the risk/reward perspective at the moment. We will keep you informed should anything change, or should we see a confirmation/invalidation of the above.
GBP/USD
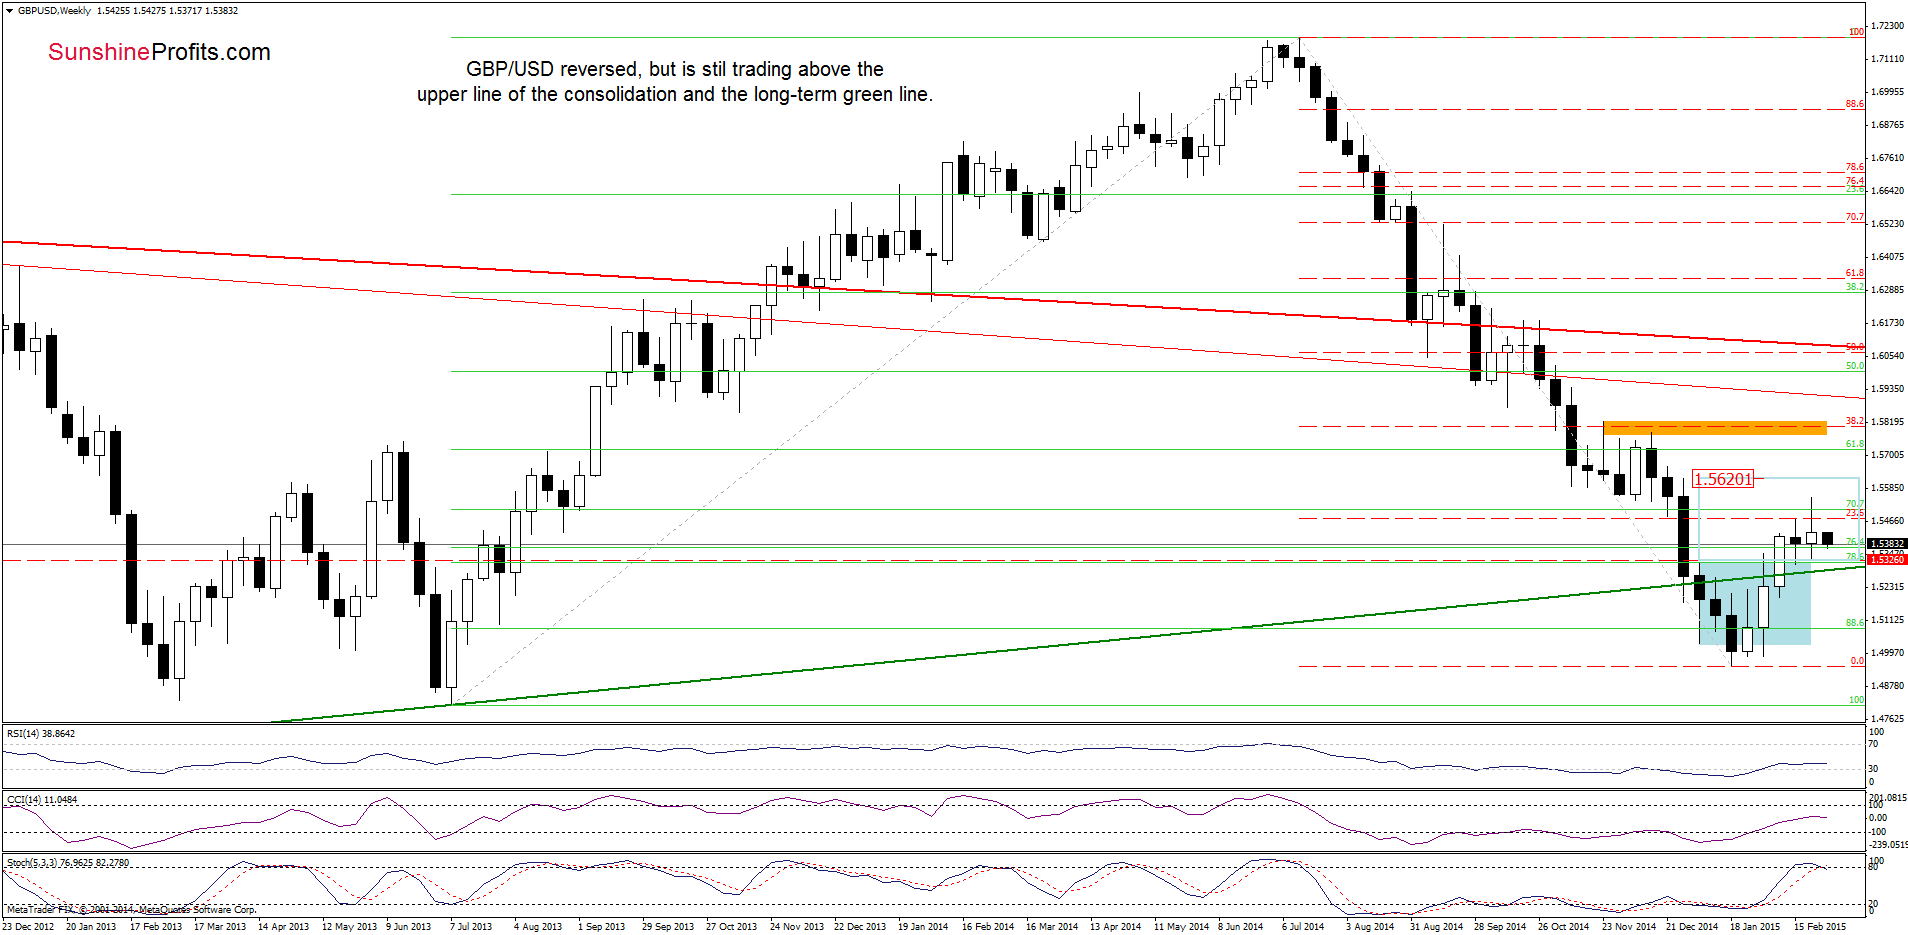
The medium-term picture hasn’t changed much as GBP/USD still remains above the previously-broken upper border of the consolidation and the long-term green support line, which serve as the major support at the moment. Nevertheless, taking into account the current position of the Stochastic Oscillator, it seems to us that we could see a test of this support area in the coming week.
Will the daily chart give us more clues about future moves? Let’s check.
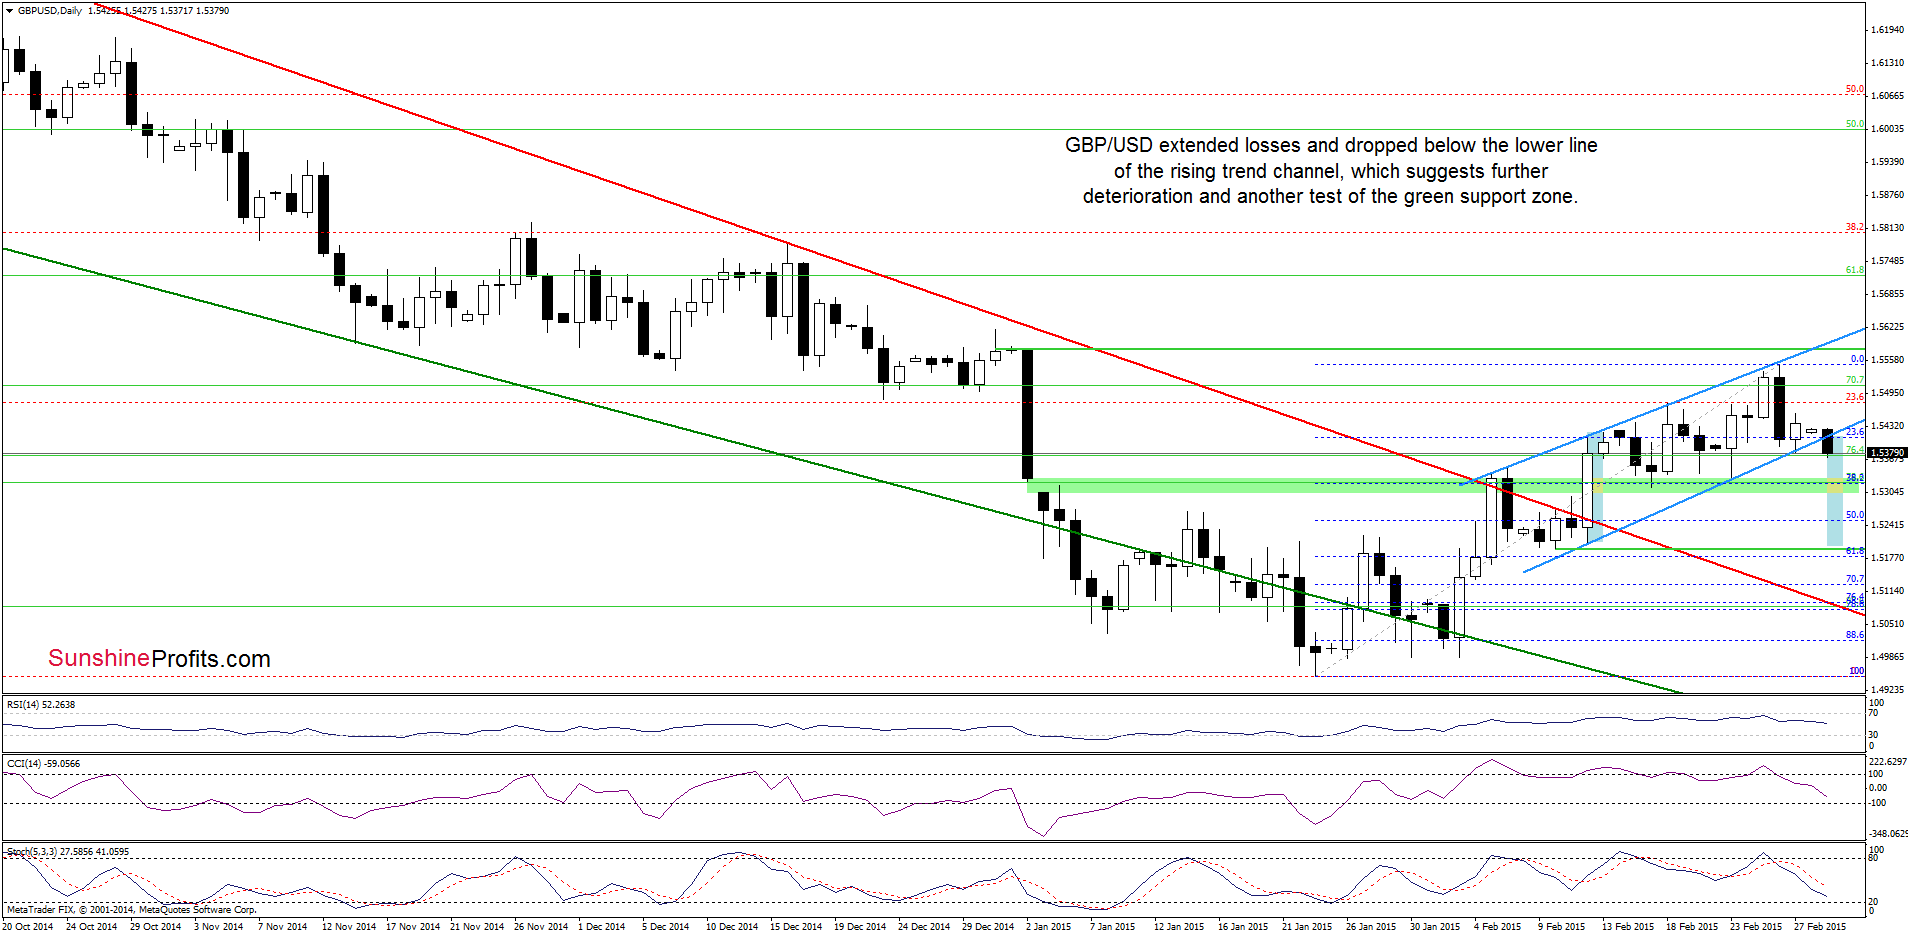
The first thing that catches the eye on the above chart is a breakdown under the lower line of the rising trend channel. Taking this fact into account, we think that our last commentary on this currency pair is up-to-date:
(…) if currency bulls fail, the exchange rate might drop even to around 1.5176-1.5195, where the Feb 10 and the 61.8% Fibonacci retracement (based on the entire recent rally) is. Will we see further deterioration? Taking into account the current position of the indicators, the bearish scenario is more likely at the moment. Nevertheless, it seems to us that we’ll see such low values of the exchange rate only if currency bears break below the medium-term support area around 1.5268-1.5318
Very short-term outlook: bearish
Short-term outlook: mixed
MT outlook: mixed
LT outlook: mixed
Trading position (short-term; our opinion): No positions are justified from the risk/reward perspective at the moment. We will keep you informed should anything change, or should we see a confirmation/invalidation of the above.
USD/CHF
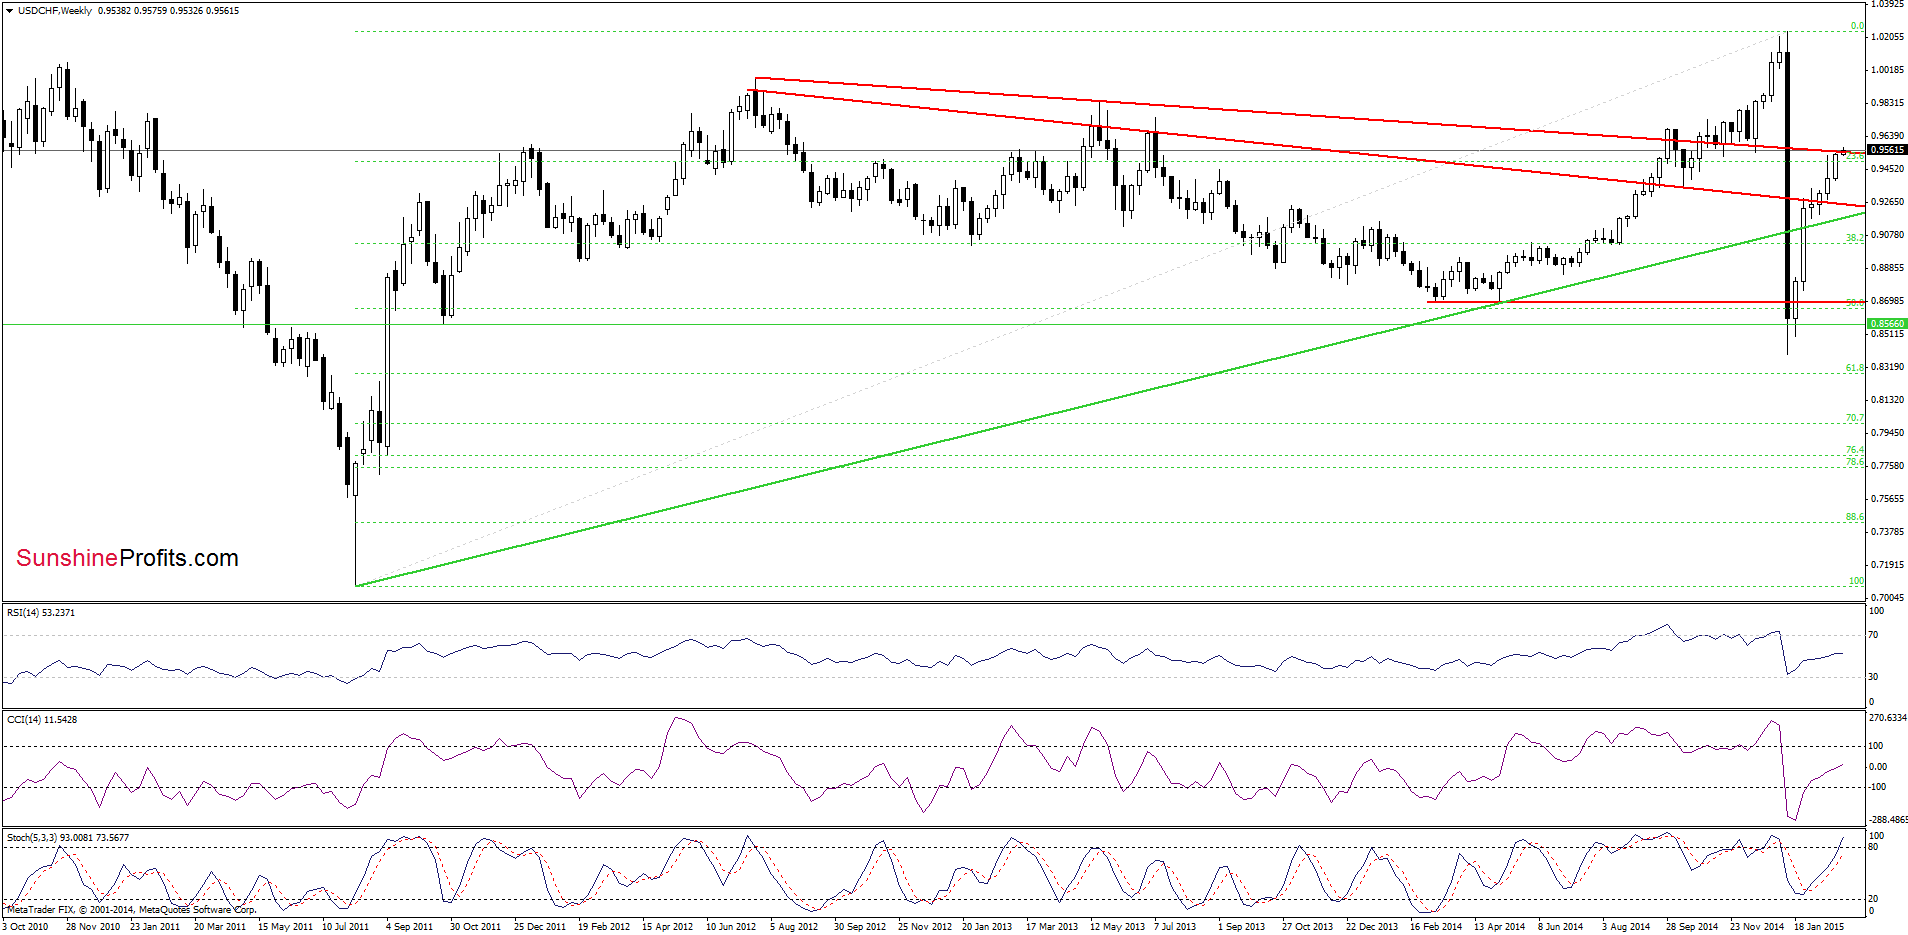
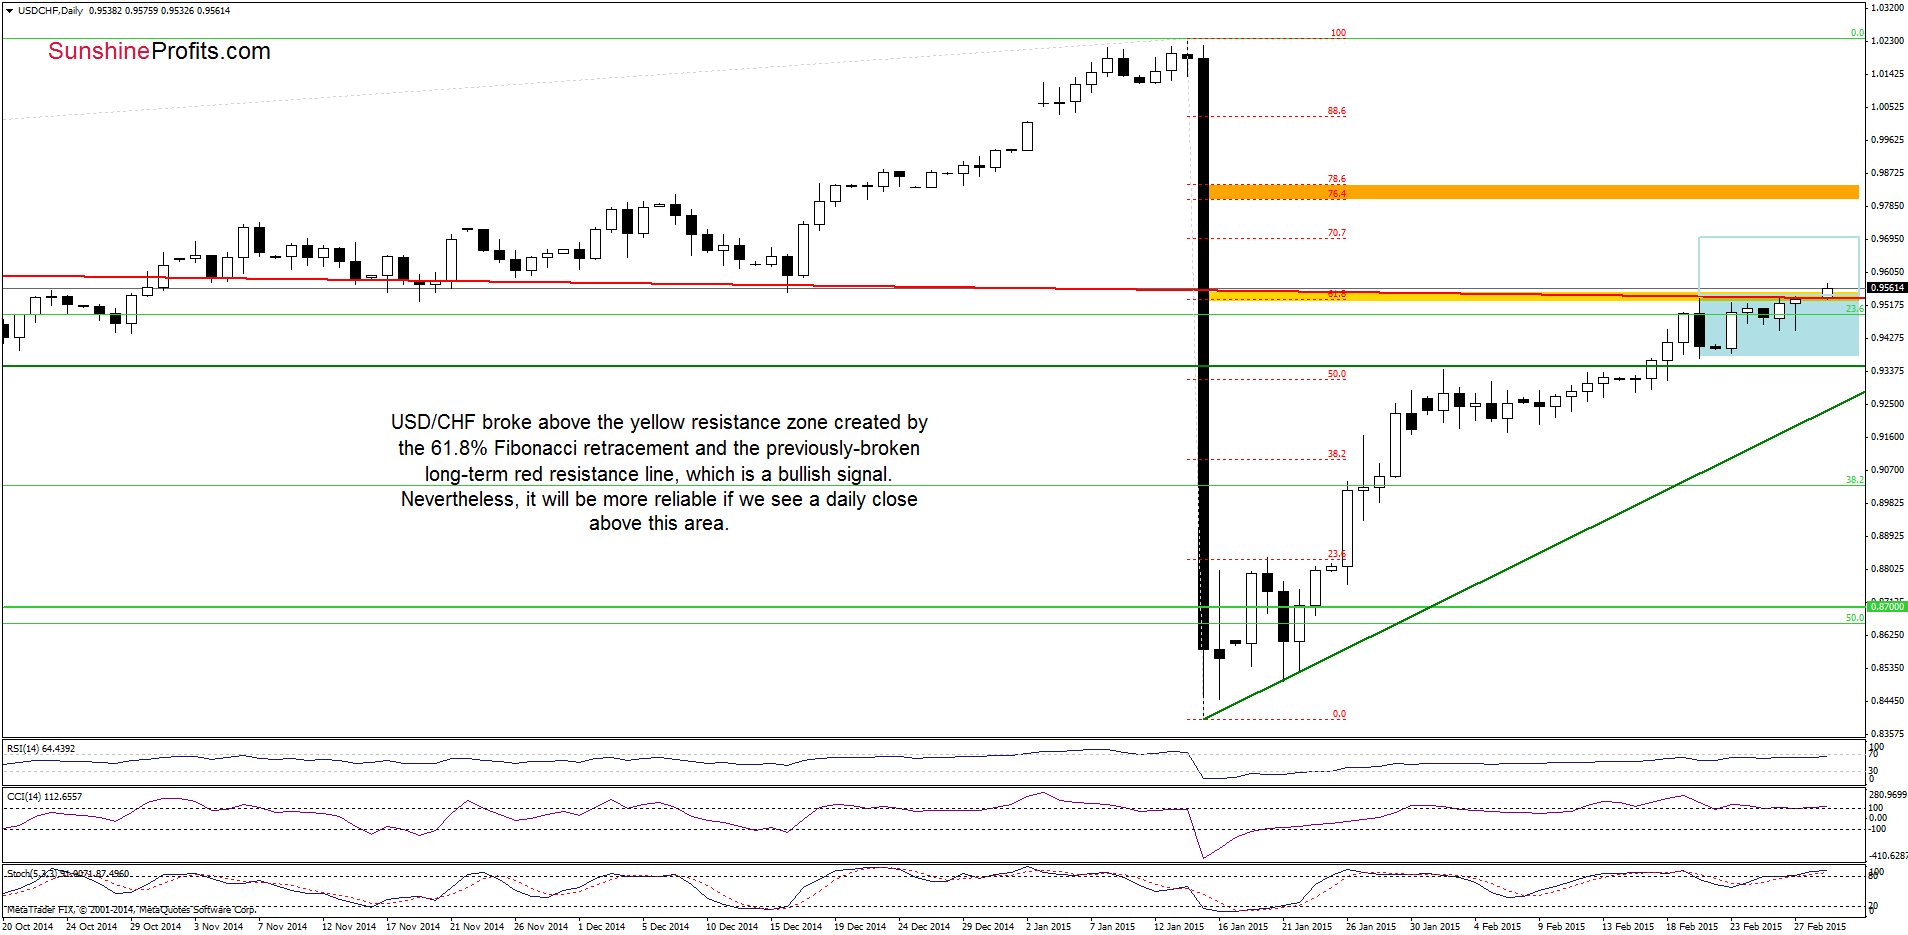
Looking at the above charts, we see that USD/CHF broke not only above the upper line of the consolidation, but also climbed above the yellow resistance zone created by the 61.8% Fibonacci retracement and the previously-broken long-term resistance line. This is a bullish signal, which suggests further improvement and an increase to around 0.9700, where the size of the upswing will correspond to the height of the formation and where the 70.7% Fibonacci retracement is. Nevertheless, we should keep in mind that there is a negative divergence between the CCI and the exchange rate, while the Stochastic Oscillator is overbought, which suggests that the space for further rally might be limited. Please note that today’s breakout will be more reliable if we see a daily close above the yellow zone.
Very short-term outlook: mixed with bullish bias
Short-term outlook: mixed
MT outlook: mixed
LT outlook: bearish
Trading position (short-term; our opinion): No positions are justified from the risk/reward perspective at the moment. We will keep you informed should anything change, or should we see a confirmation/invalidation of the above.
Thank you.
Nadia Simmons
Forex & Oil Trading Strategist
Przemyslaw Radomski, CFA
Founder, Editor-in-chief
Gold & Silver Trading Alerts
Forex Trading Alerts
Oil Investment Updates
Oil Trading Alerts

