
Although USD Index moved higher after upbeat manufacturing data, the index reversed later in the day, which moved away the USD/CHF pair from its major resistance. Does it mean that the rally is over?
In our opinion, the following forex trading positions are justified - summary:
- EUR/USD: long (stop loss order at 1.1056)
- GBP/USD: none
- USD/JPY: none
- USD/CAD: short (stop loss order at 1.2876)
- USD/CHF: none
- AUD/USD: none
EUR/USD
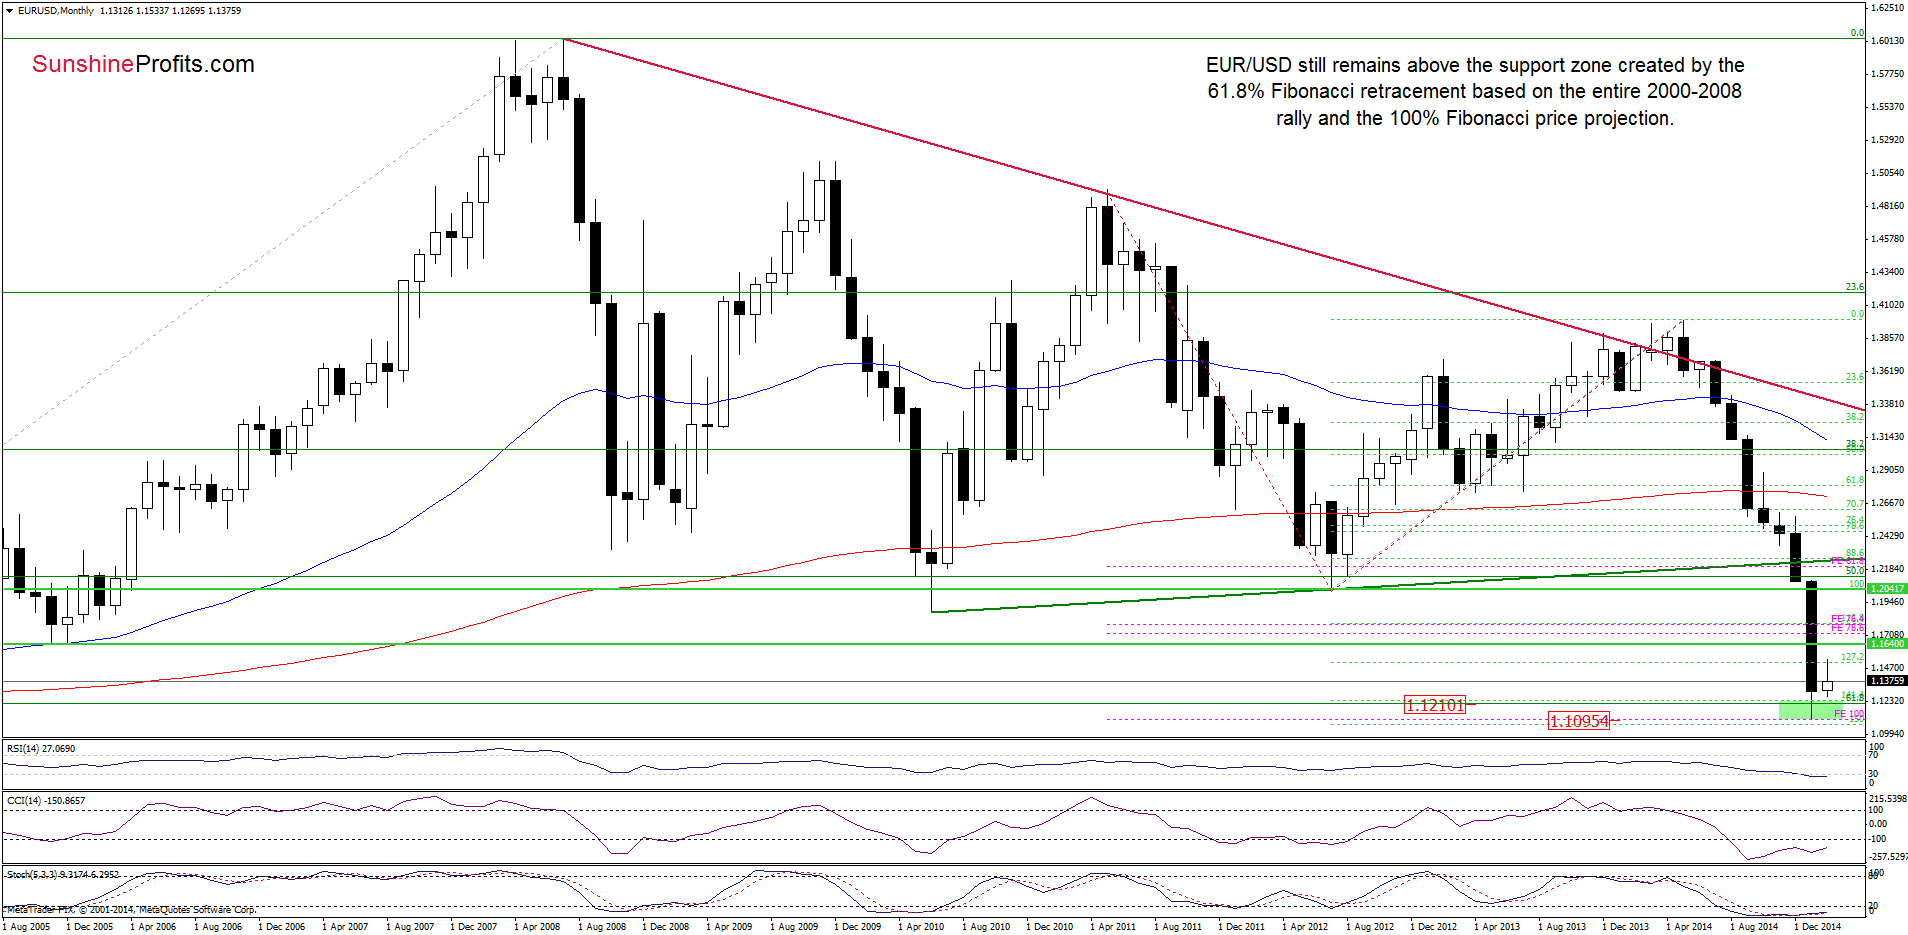
The medium-term hasn’t changed much as EUR/USD still remains above the support zone created by the 61.8% Fibonacci retracement (based on the entire 2000-2008 rally) and the 100% Fibonacci price projection, which means that an invalidation of the breakdown below these levels and its positive impact on the exchange rate are still in effect.
Once we know the above, let’s focus on the very short-term changes.
In our previous Forex Trading Alert, we wrote the following:
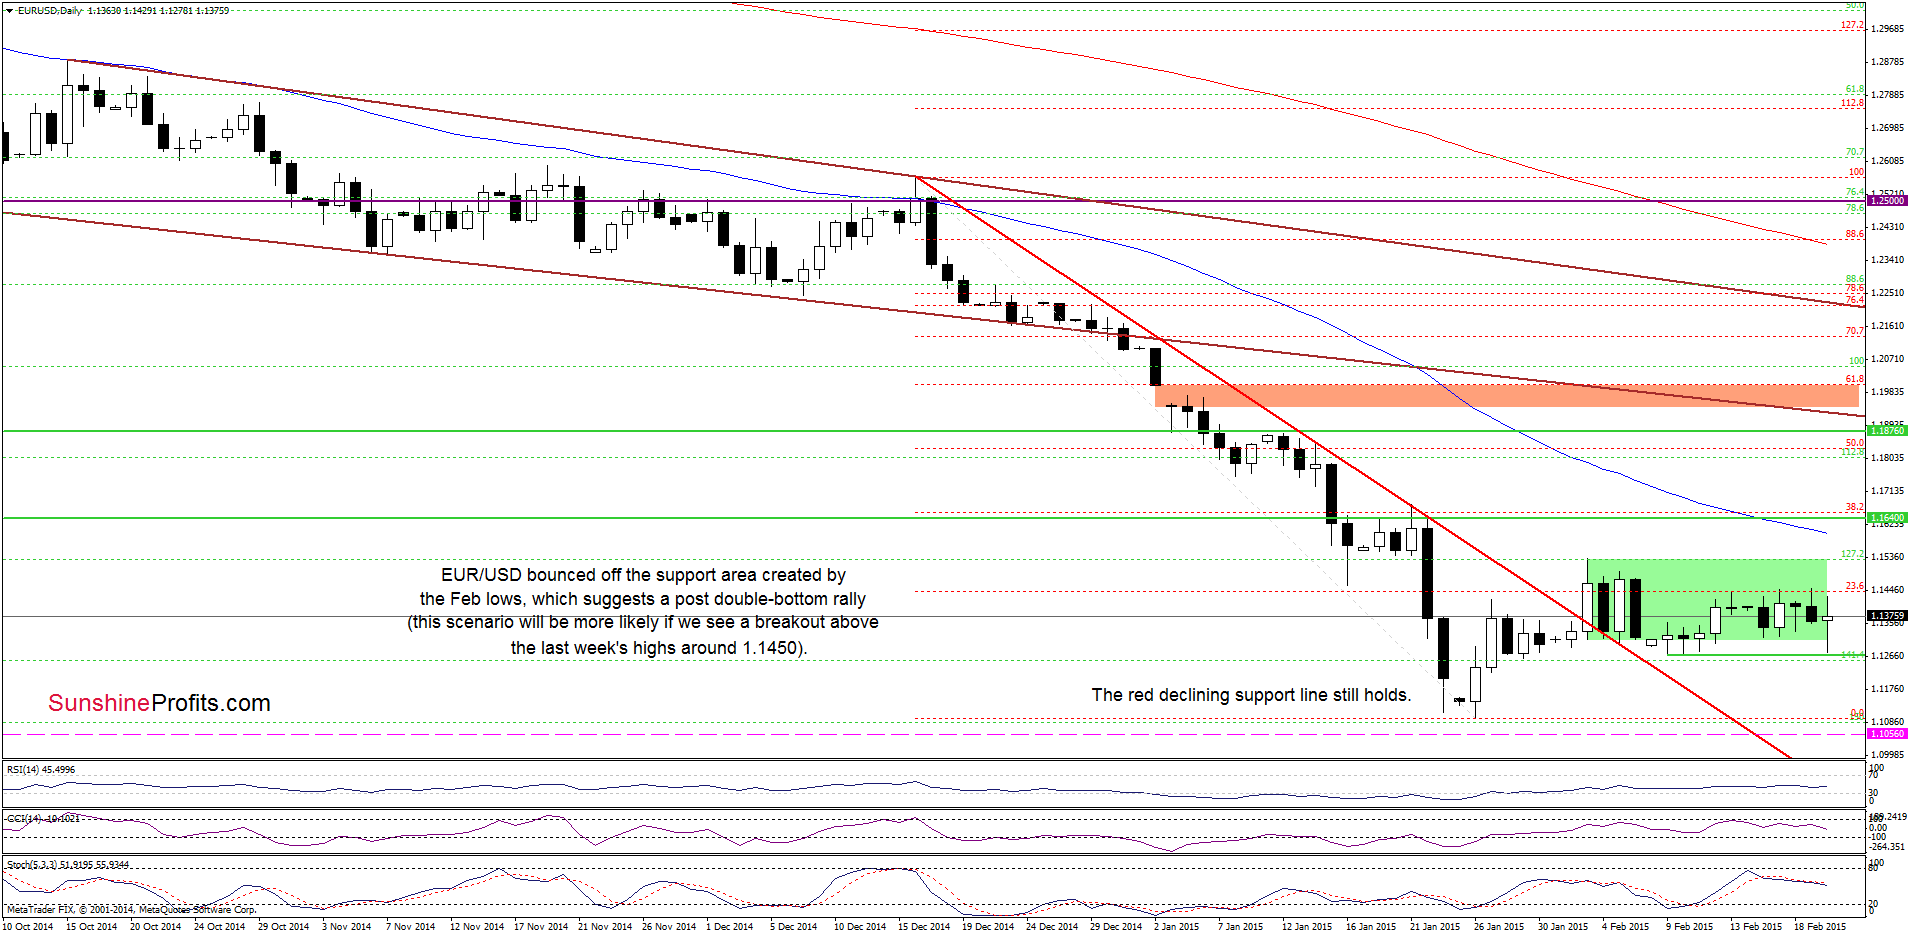
(…) the exchange rate dropped to the last week’s lows. Back then, despite several attempts, currency bears didn’t manage to push the pair lower, which suggests that we could see a similar rebound in the coming days.
From today’s point of view, we see that the above-mentioned support area withstood the selling pressure and EUR/USD rebounded, invalidating earlier breakdown below the lower border of the consolidation. This is a bullish signal, which suggests that we could see a post double-bottom rally in the coming days. Nevertheless, in our opinion, this scenario will be more likely if we see a breakout above the last week’s highs around 1.450.
Very short-term outlook: bullish
Short-term outlook: mixed
MT outlook: mixed
LT outlook: mixed
Trading position (short-term): Long positions with a stop loss order at 1.1056 are justified from the risk/reward perspective. We will keep you informed should anything change, or should we see a confirmation/invalidation of the above.
USD/CHF
On Wednesday, we wrote:
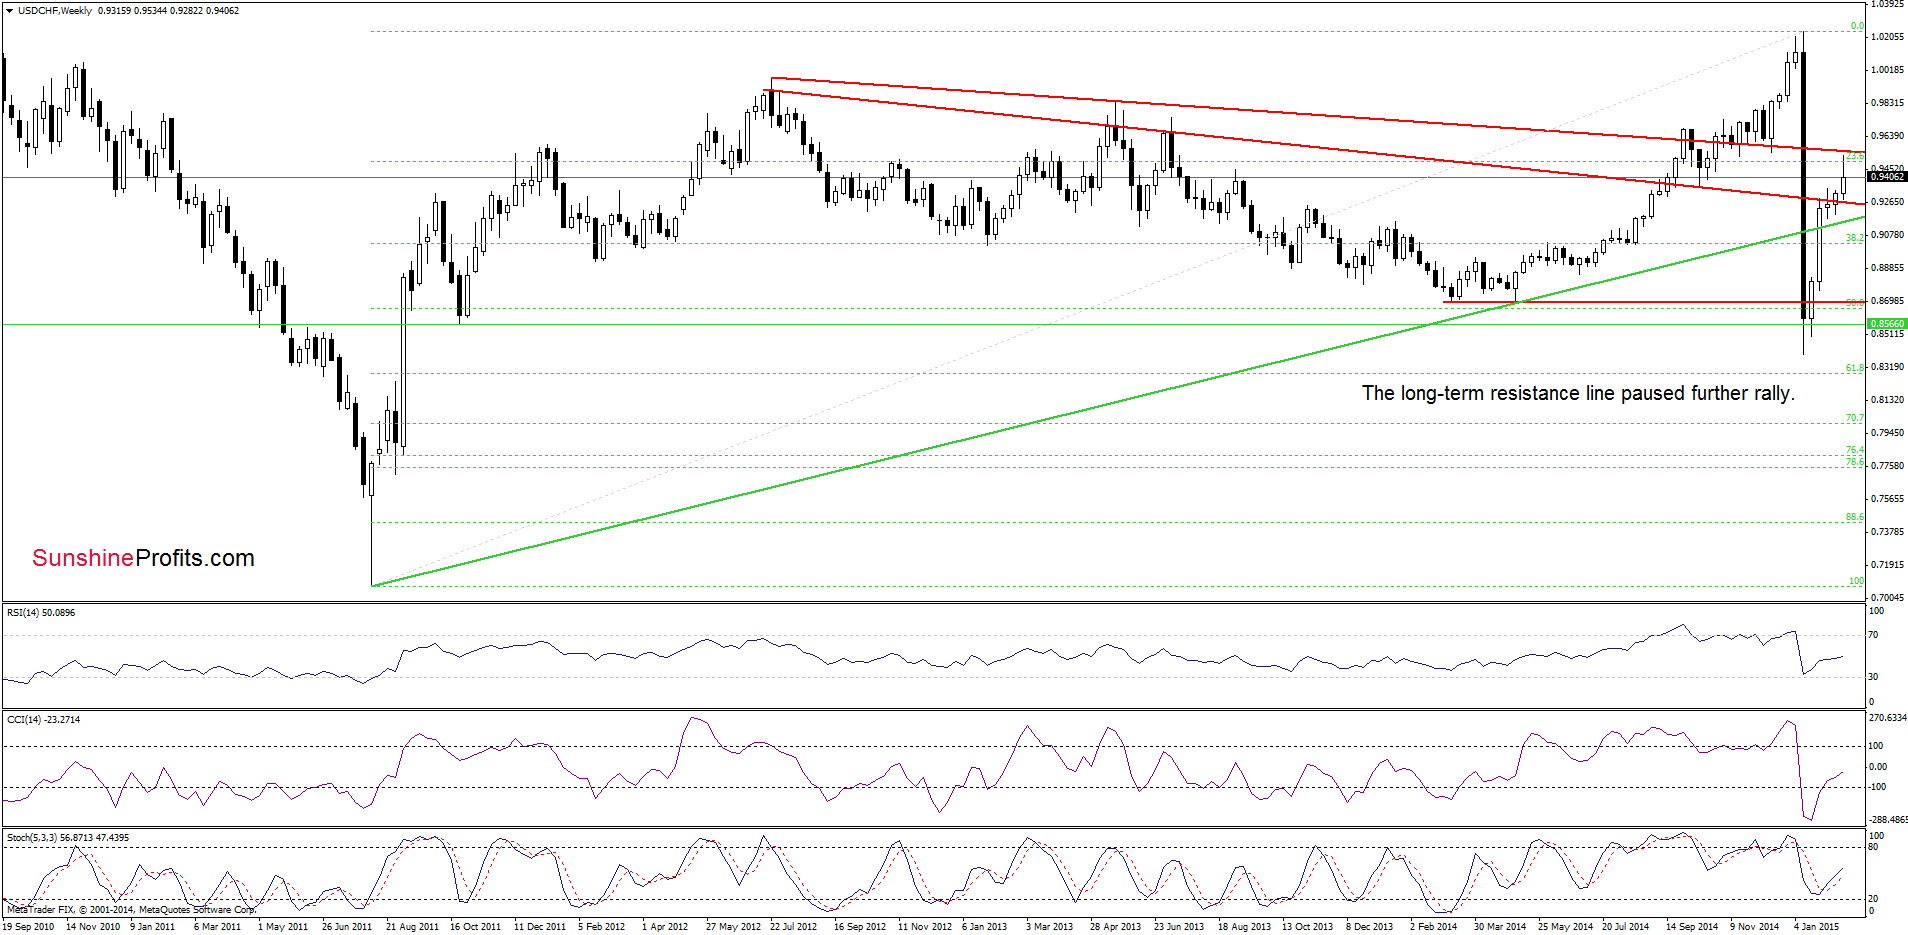
(…) the previously-broken long-term red declining resistance line (…) will pause or even stop further rally. This scenario is currently reinforced by the position of the indicators (the CCI and Stochastic Oscillator are overbought, which suggests that they could generate sell signals in the coming days, encouraging currency bears to act). Nevertheless, as long as there are no sell signals, higher values of the exchange rate are still ahead us.
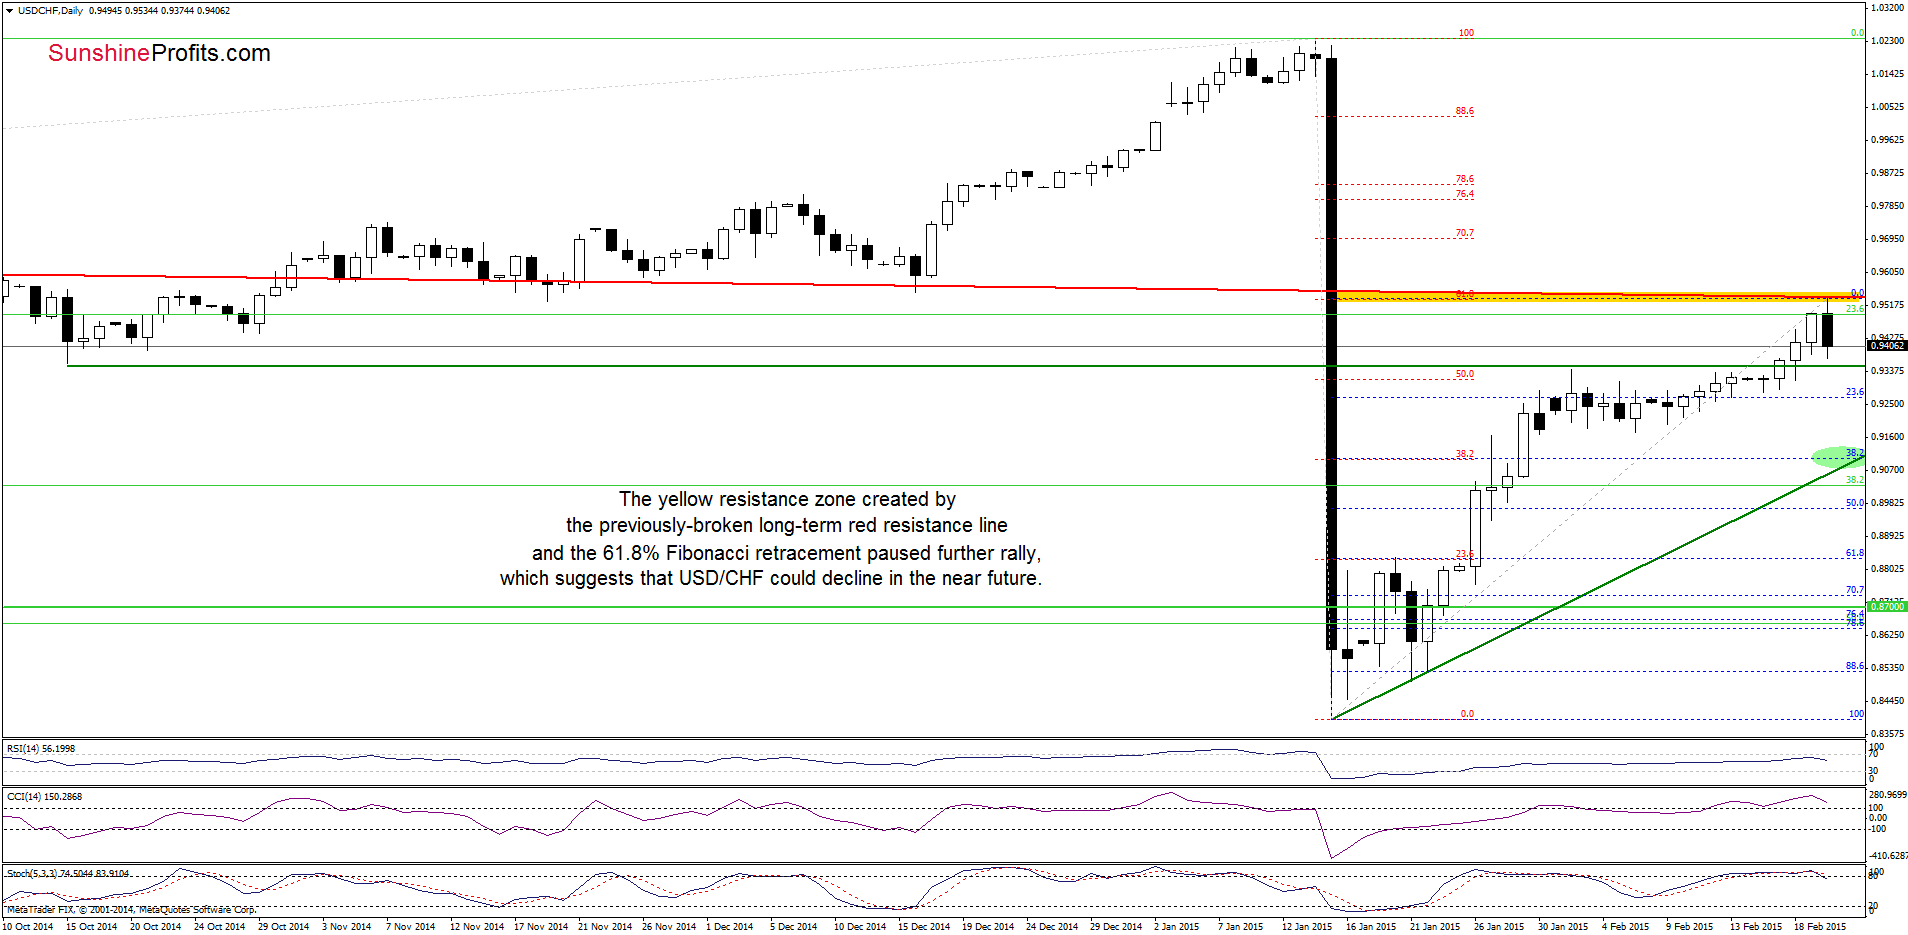
Looking at the charts, we see that the situation developed in line with the above-mentioned scenario as USD/CHF declined after an increase to the yellow resistance zone (created by the long-term red declining resistance line and the 61.8% Fibonacci retracement). Taking this fact into account, and combining with the current position of the indicators, we think that further deterioration is just around the corner. If this is the case, and the exchange rate moves lower from here, the initial downside target would be around 0.9252, where the previously-broken long-term red line (in terms of weekly closing prices) is. However, if this support is broken, the pair might drop even to around 0.9103-0.9152, where the long-term green support line (marked on the weekly chart) and the 38.2% Fibonacci retracement (based on the entire recent rally) are.
Very short-term outlook: mixed with bearish bias
Short-term outlook: mixed
MT outlook: mixed
LT outlook: bearish
Trading position (short-term; our opinion): No positions are justified from the risk/reward perspective at the moment. We will keep you informed should anything change, or should we see a confirmation/invalidation of the above.
AUD/USD
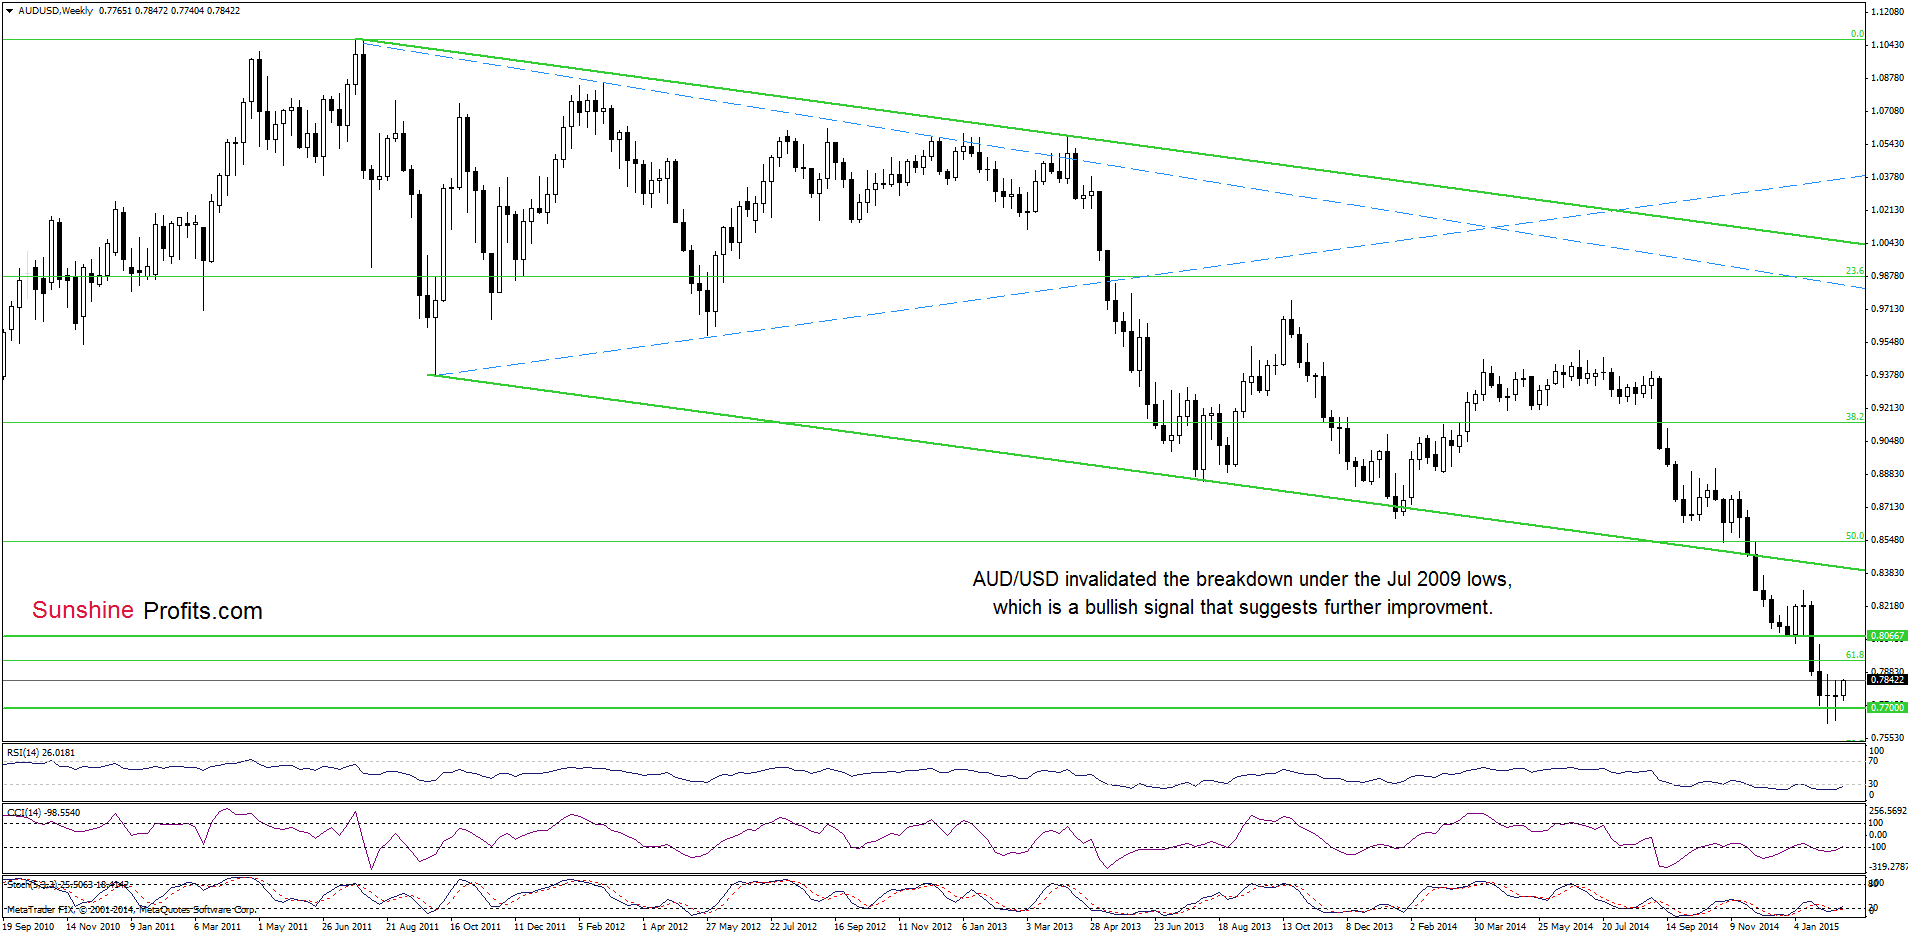
The situation in the medium term hasn’t changed much as an invalidation of the breakdown below the Jul 2009 lows and its potential positive impact on future moves is still in effect.
Having said that, let’s take a closer look at the daily chart.
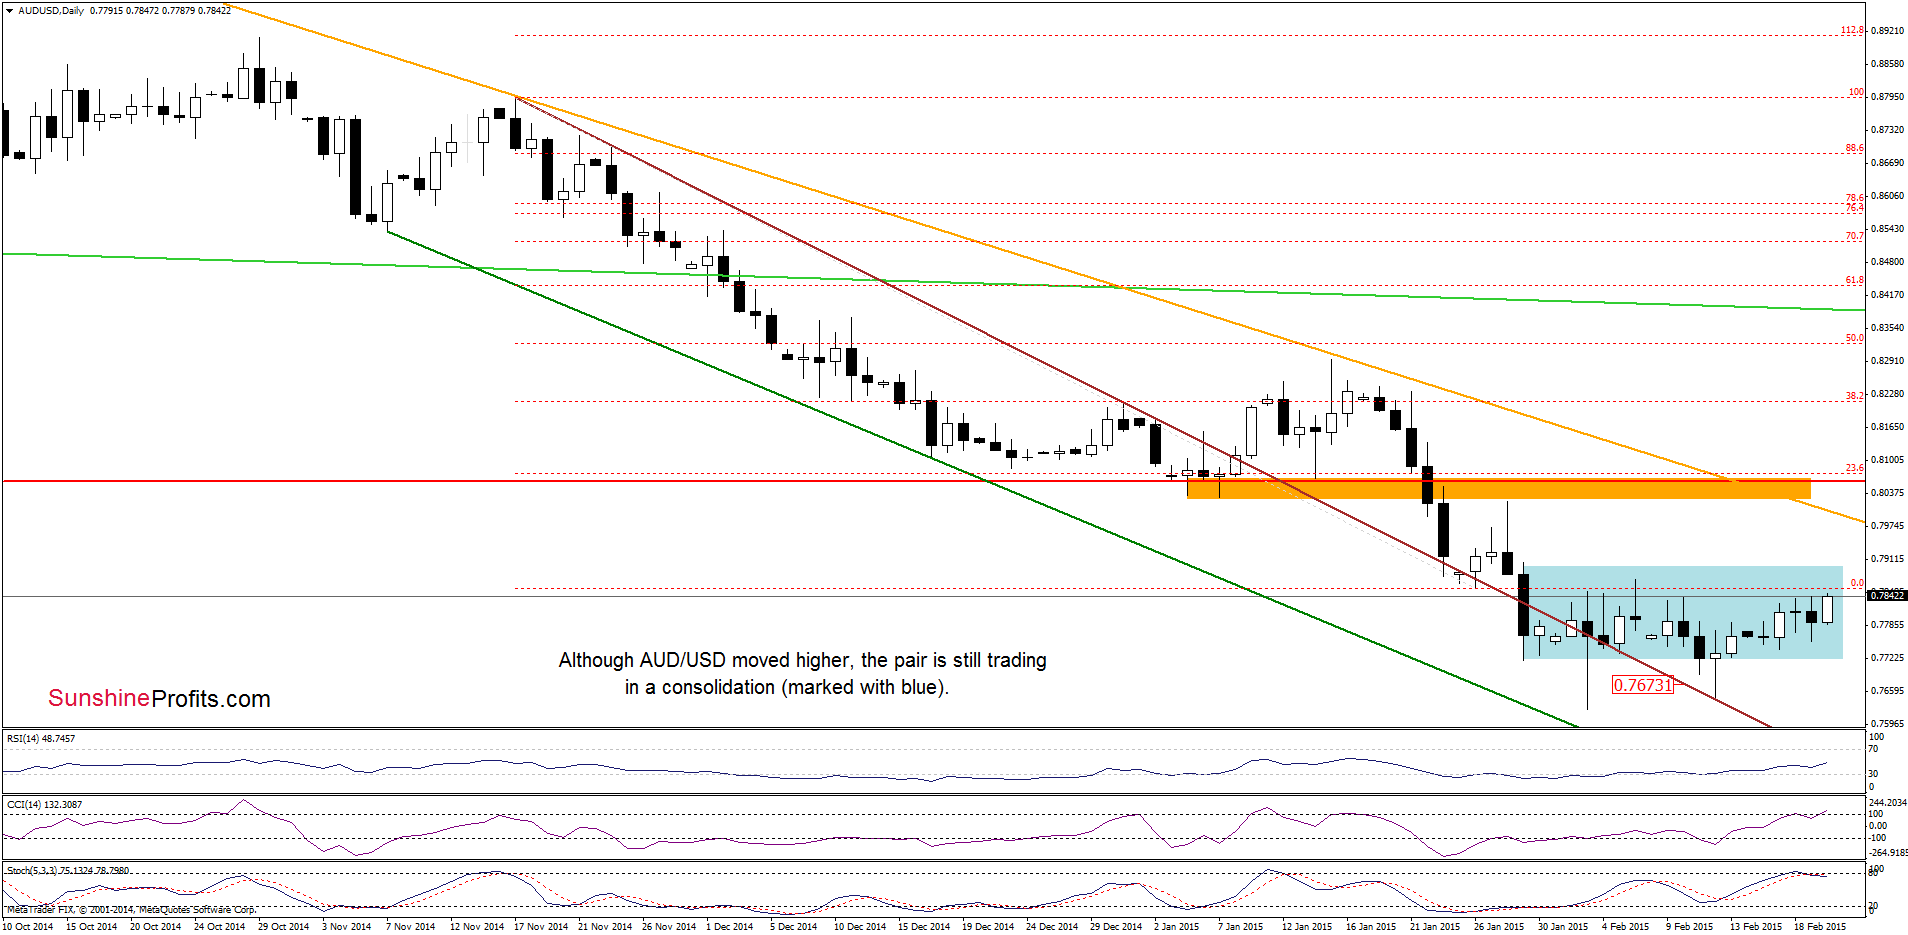
On the above chart, we see that although the pair moved higher on Friday, the situation in the very short-term also hasn’t changed much as the exchange rate is still trading in the consolidation. If the pair extends gains, the initial upside target would be the upper border of the formation. Nevertheless, taking into account the current position of the indicators (the CCI is overbought, while Stochastic Oscillator generated a sell signal), it seems that lower values of the exchange rate and a test of the lower border of the formation (around 0.7718) in the coming week are likely.
Very short-term outlook: mixed
Short-term outlook: mixed
MT outlook: mixed
LT outlook: mixed
Trading position (short-term; our opinion): No positions are justified from the risk/reward perspective at the moment. We will keep you informed should anything change, or should we see a confirmation/invalidation of the above.
Thank you.
Nadia Simmons
Forex & Oil Trading Strategist
Forex Trading Alerts
Oil Investment Updates
Oil Trading Alerts

