
Earlier today, preliminary data showed that the U.S. manufacturing PMI rose to 54.3 in February from 53.9 in the previous month, beating expectations for a fall to 53.6. Thanks to this upbeat report USD Index moved higher and approached the level of 95. Did this increase change the major currency pairs’ outlooks?
In our opinion the following forex trading positions are justified - summary:
- EUR/USD: long (stop loss order at 1.1056)
- GBP/USD: none
- USD/JPY: none
- USD/CAD: short (stop loss order at 1.2876)
- USD/CHF: none
- AUD/USD: none
EUR/USD
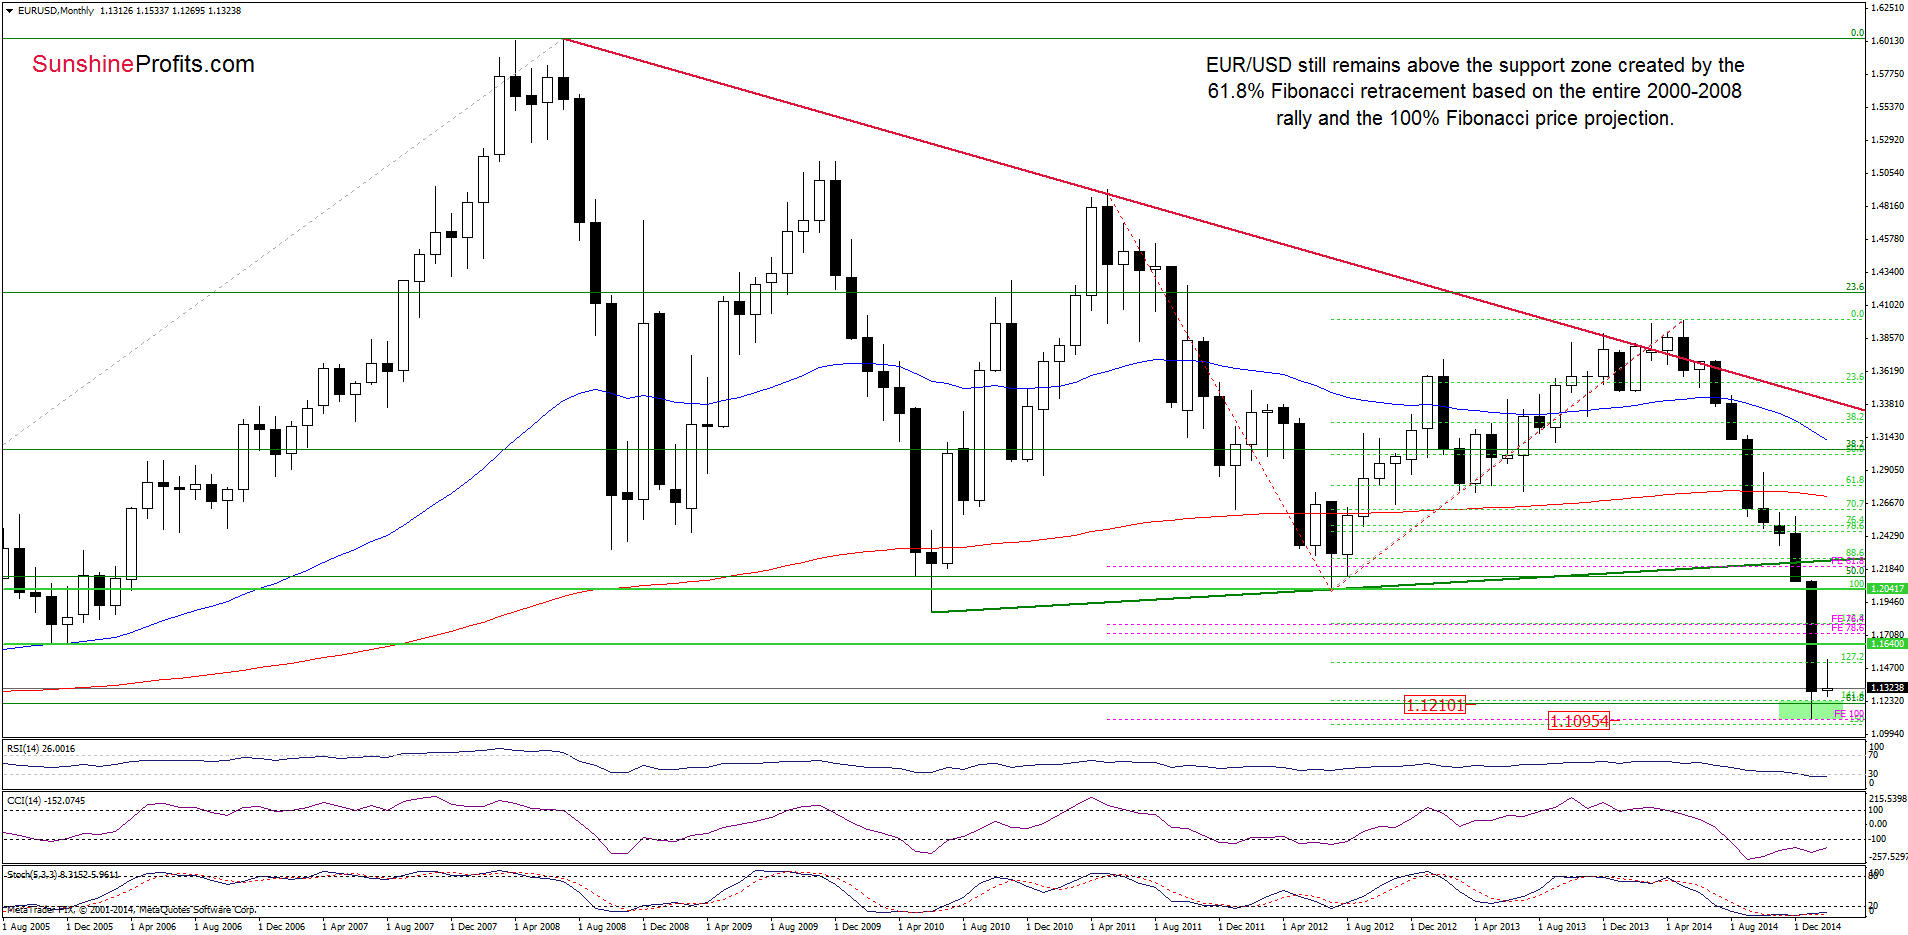
The situation in the medium term hasn’t changed much as EUR/USD still remains above the support zone created by the 61.8% Fibonacci retracement (based on the entire 2000-2008 rally) and the 100% Fibonacci price projection, which means that an invalidation of the breakdown below these levels and its positive impact on the exchange rate are still in effect.
Once we know the above, let’s focus on the very short-term changes.
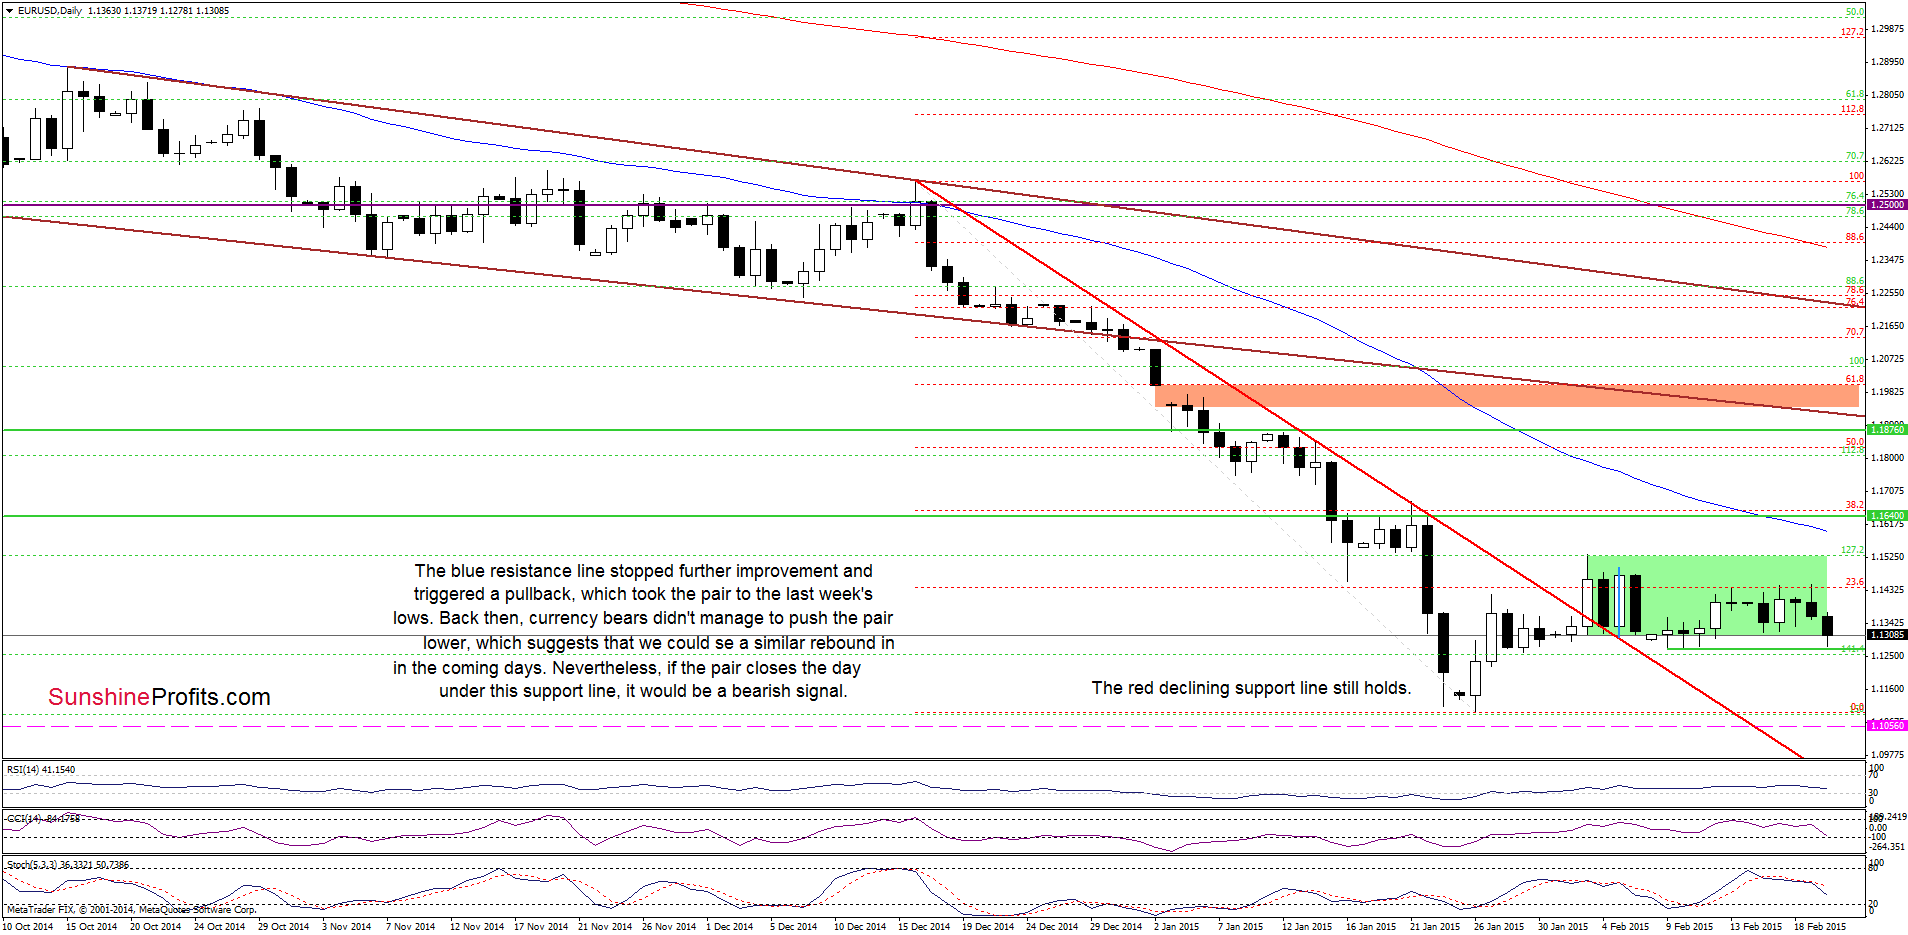
Looking at the above chart, we see that the situation n the very short term has deteriorated as EUR/USD extended losses and slipped below the lower border of the consolidation. With today’s downswing, the exchange rate dropped to the last week’s lows. Back then, despite several attempts, currency bears didn’t manage to push the pair lower, which suggests that we could see a similar rebound in the coming days. Nevertheless, the current position of the daily indicators suggests that the worst might not be behind currency bulls. If this is the case, and the pair closes the day under this support line, it would be a negative signal, which could trigger further deterioration. Therefore, we think that today’s daily close will give us more valuable clues about future moves.
Very short-term outlook: bullish
Short-term outlook: mixed
MT outlook: mixed
LT outlook: mixed
Trading position (short-term): Long positions with a stop loss order at 1.1056 are justified from the risk/reward perspective at the moment. We will keep you informed should anything change, or should we see a confirmation/invalidation of the above.
GBP/USD
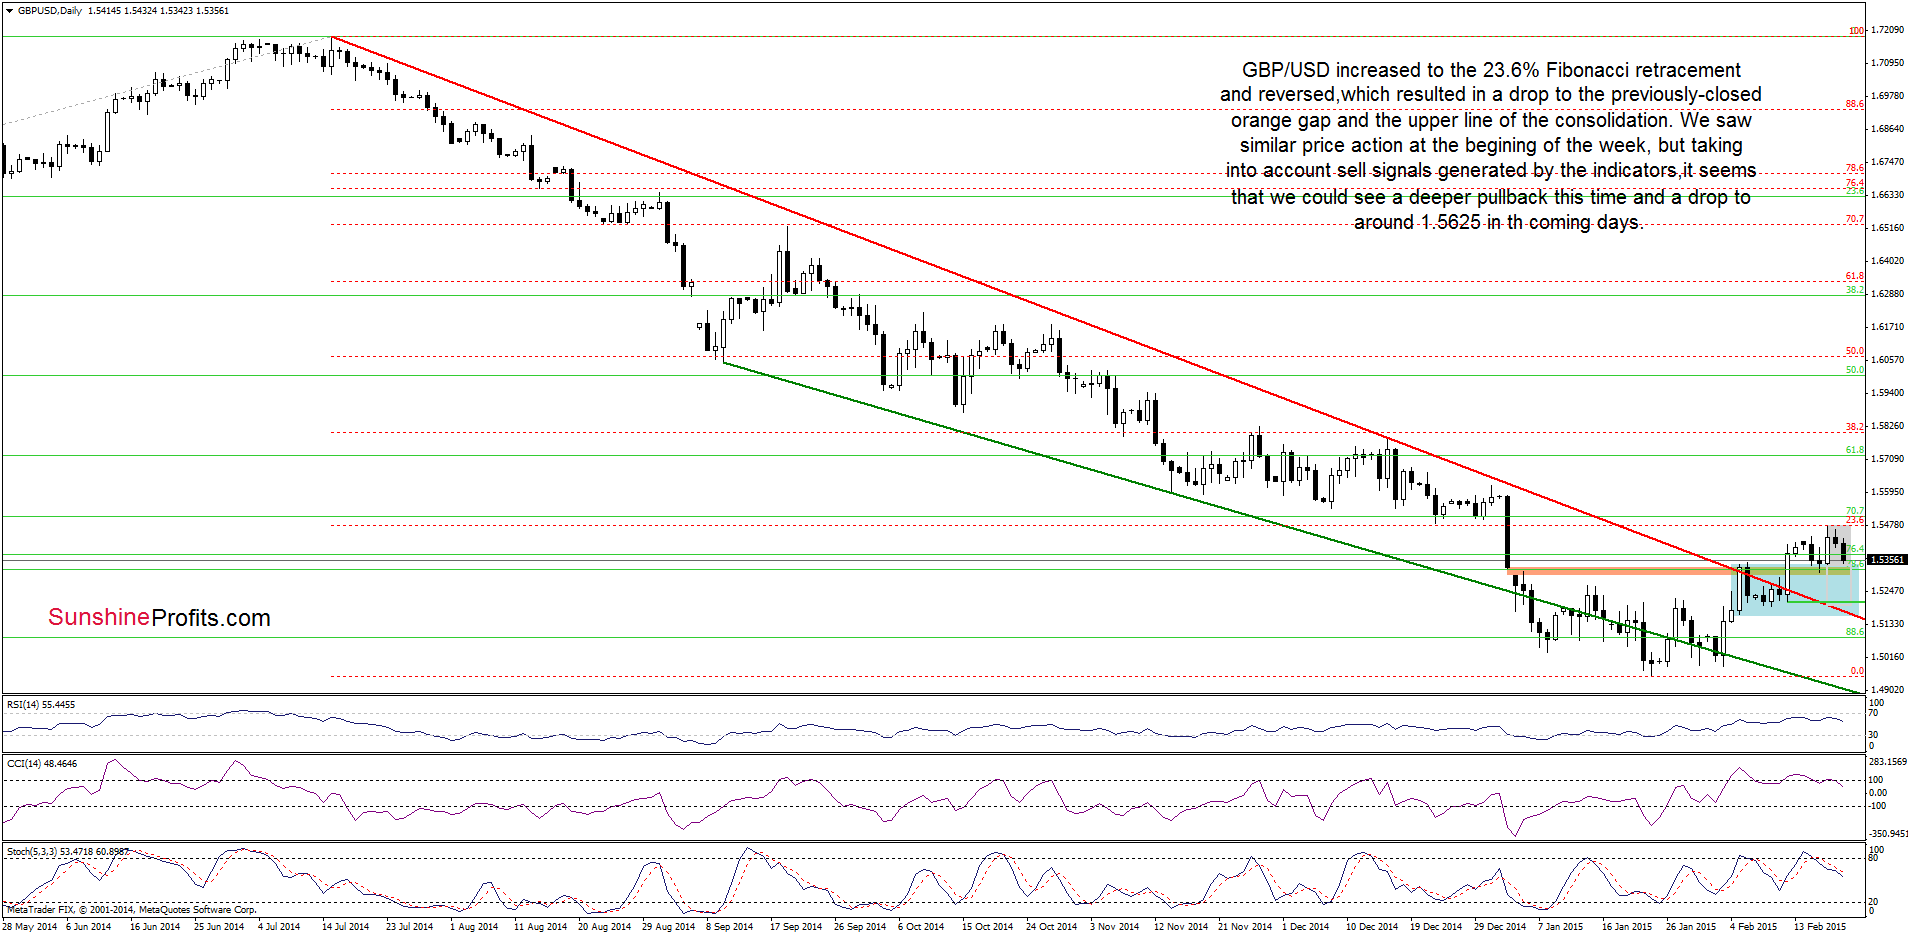
On Wednesday, GBP/USD rebounded sharply and reached the 23.6% Fibonacci retracement (based on the entire Jul-Jan decline). As you see on the above chart, this resistance triggered a pullback, which took the pair to the previously-closed orange gap – similarly to what we saw at the beginning of the week. Back then, after such drop, the pair rebounded, which suggests that we could see another rebound from here to the nearest resistance in the coming days. Nevertheless, we should keep in mind that this time the CCI and Stochastic Oscillator generated sell signals, which increases the probability of further declines. If this is the case, and the exchange rate slips under the Wednesday’s low of 1.5436, GBP/USD could drop to around 1.5208, where the Feb 12 low is.
How did this move affect the medium-term picture? Let’s take a look.
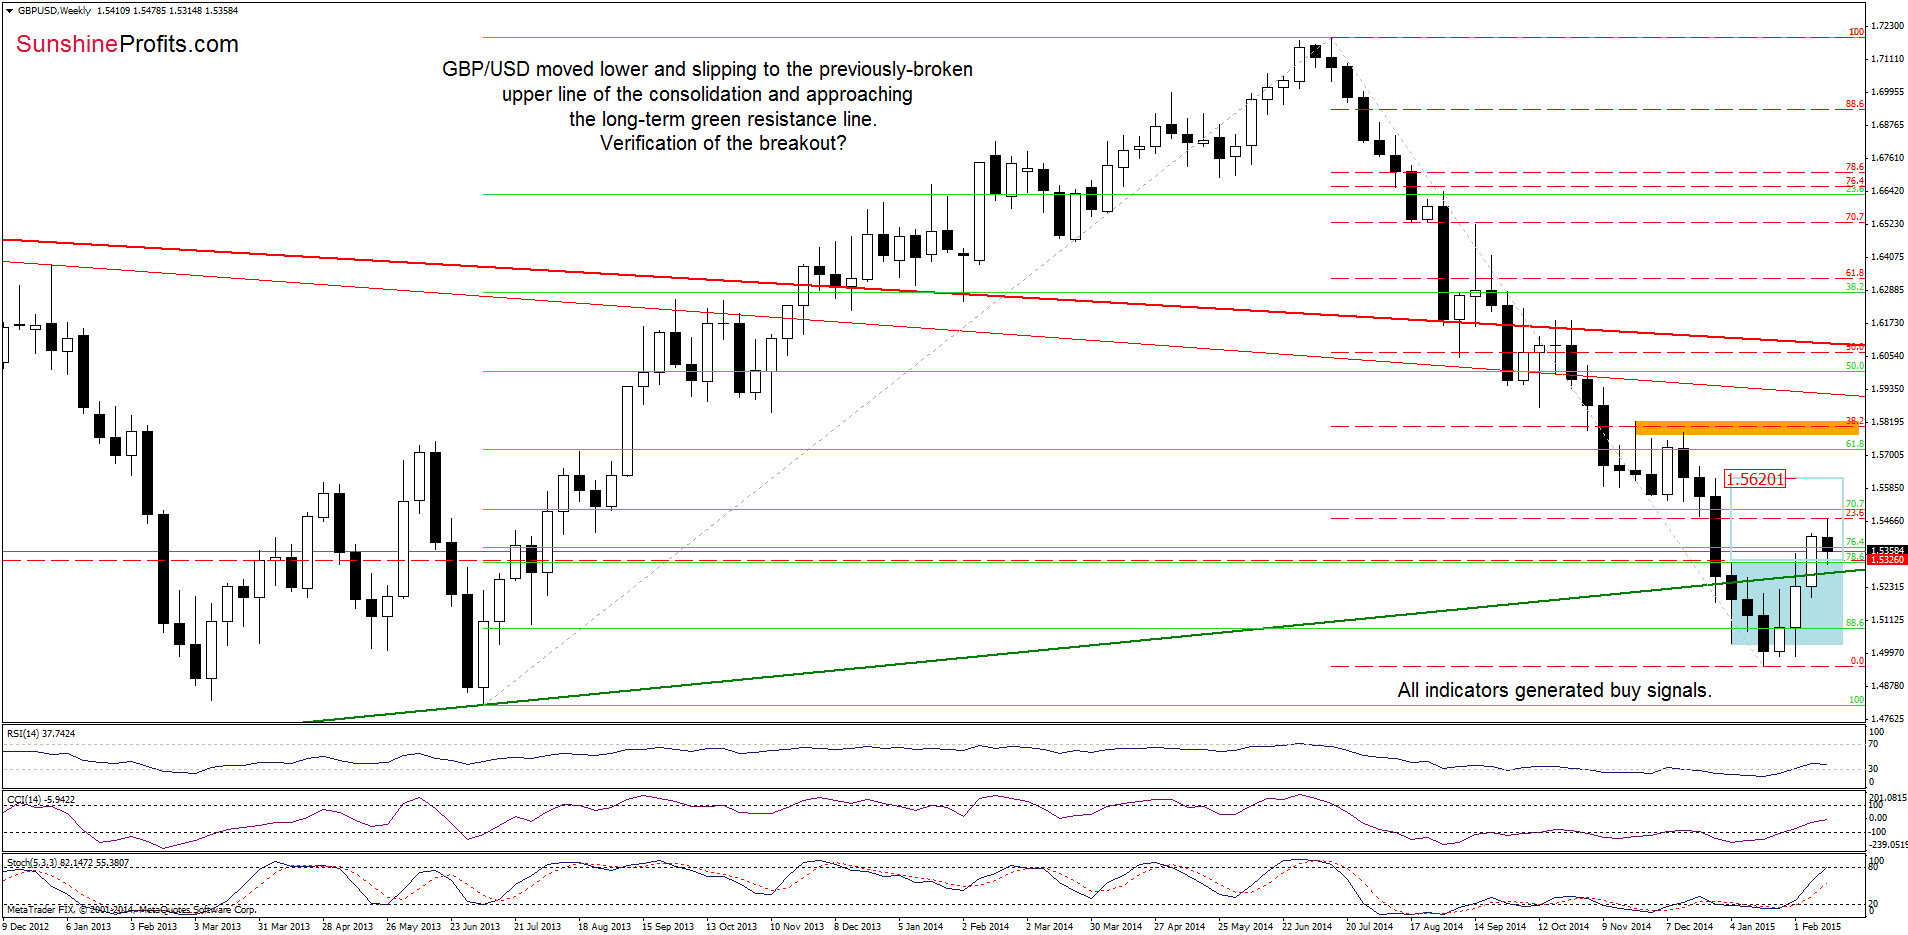
From this perspective, we see that the situation in the medium-term has deteriorated slightly as GBP/USD reversed and slipped to the previously-broken upper border of the consolidation, approaching the long-term green support line. Taking into account buy signals generated by the indicators and the importance of this area it seems that currency bulls will not give up without a fight, which might translate to a rebound from here. If this is the case, it would be a bullish signal, which will be seen as a verification of earlier breakout (it will be even more positive if the pair closes the week above these levels) that could trigger further improvement and an increase even to around 1.5620, where the size of an upswing will correspond to the height of the consolidation and where the Dec 28 high is.
Very short-term outlook: mixed
Short-term outlook: mixed with bullish bias
MT outlook: mixed
LT outlook: mixed
Trading position (short-term): In our opinion, no positions are justified from the risk/reward perspective at the moment. We will keep you informed should anything change, or should we see a confirmation/invalidation of the above.
USD/JPY
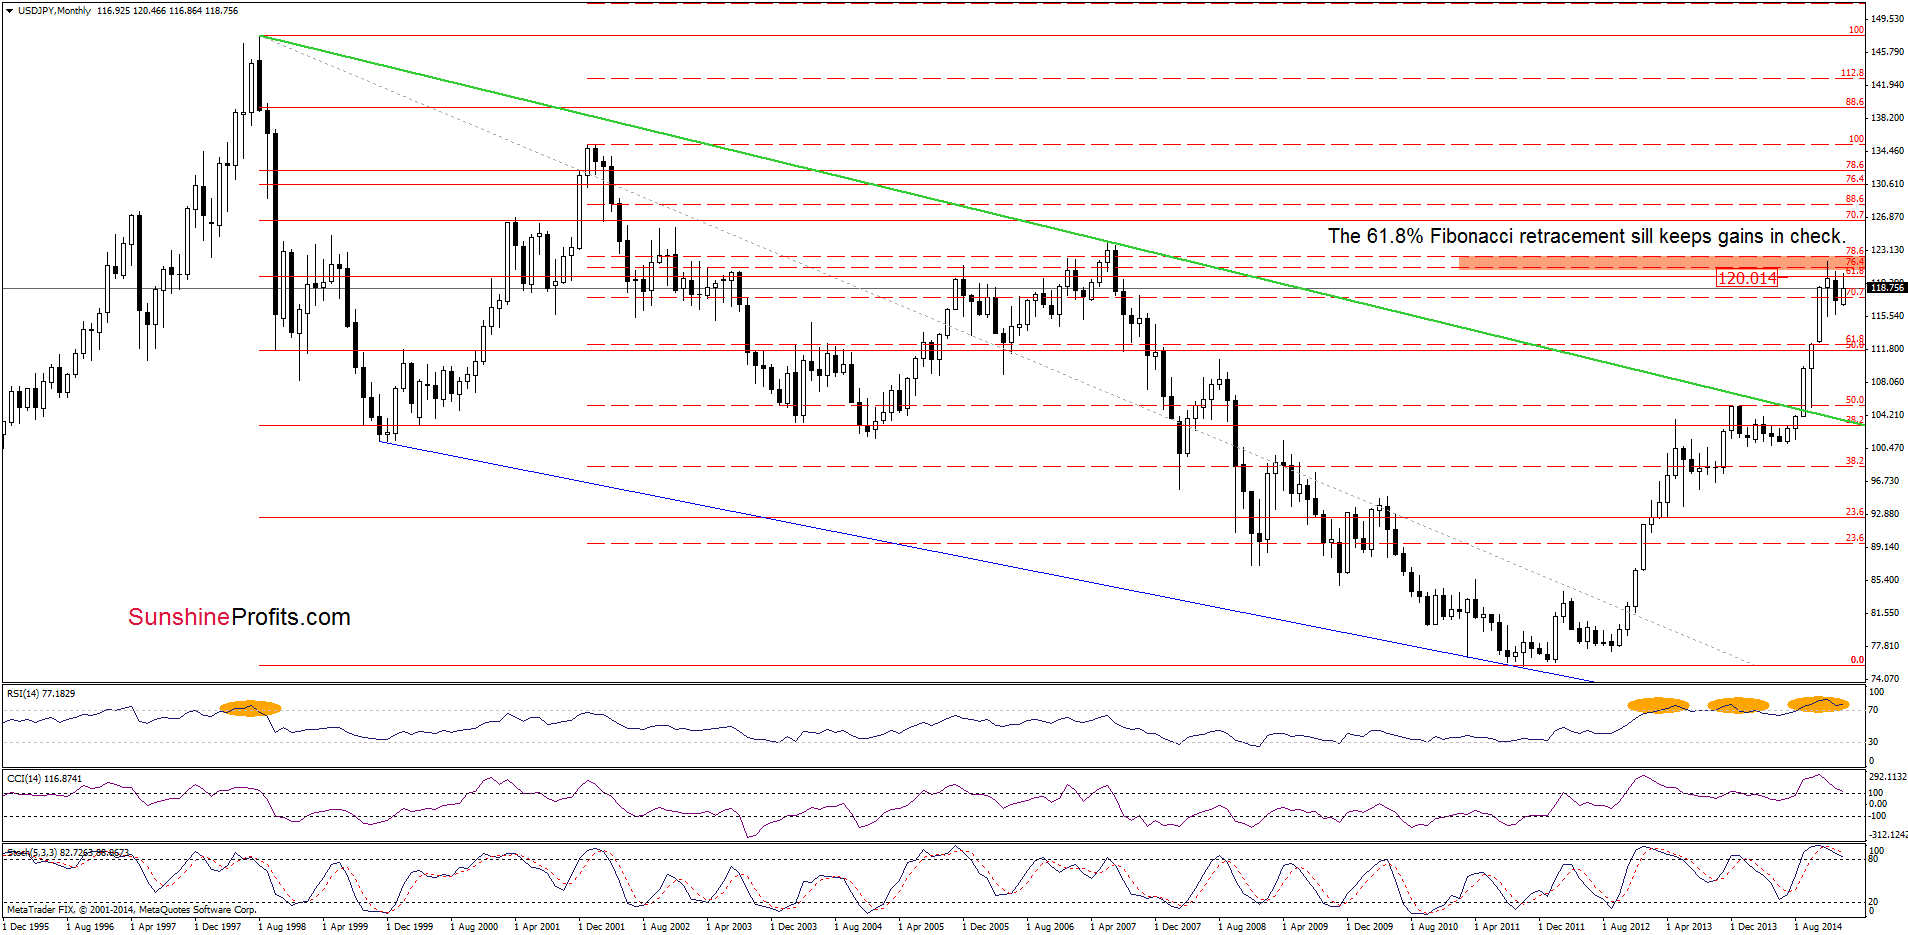
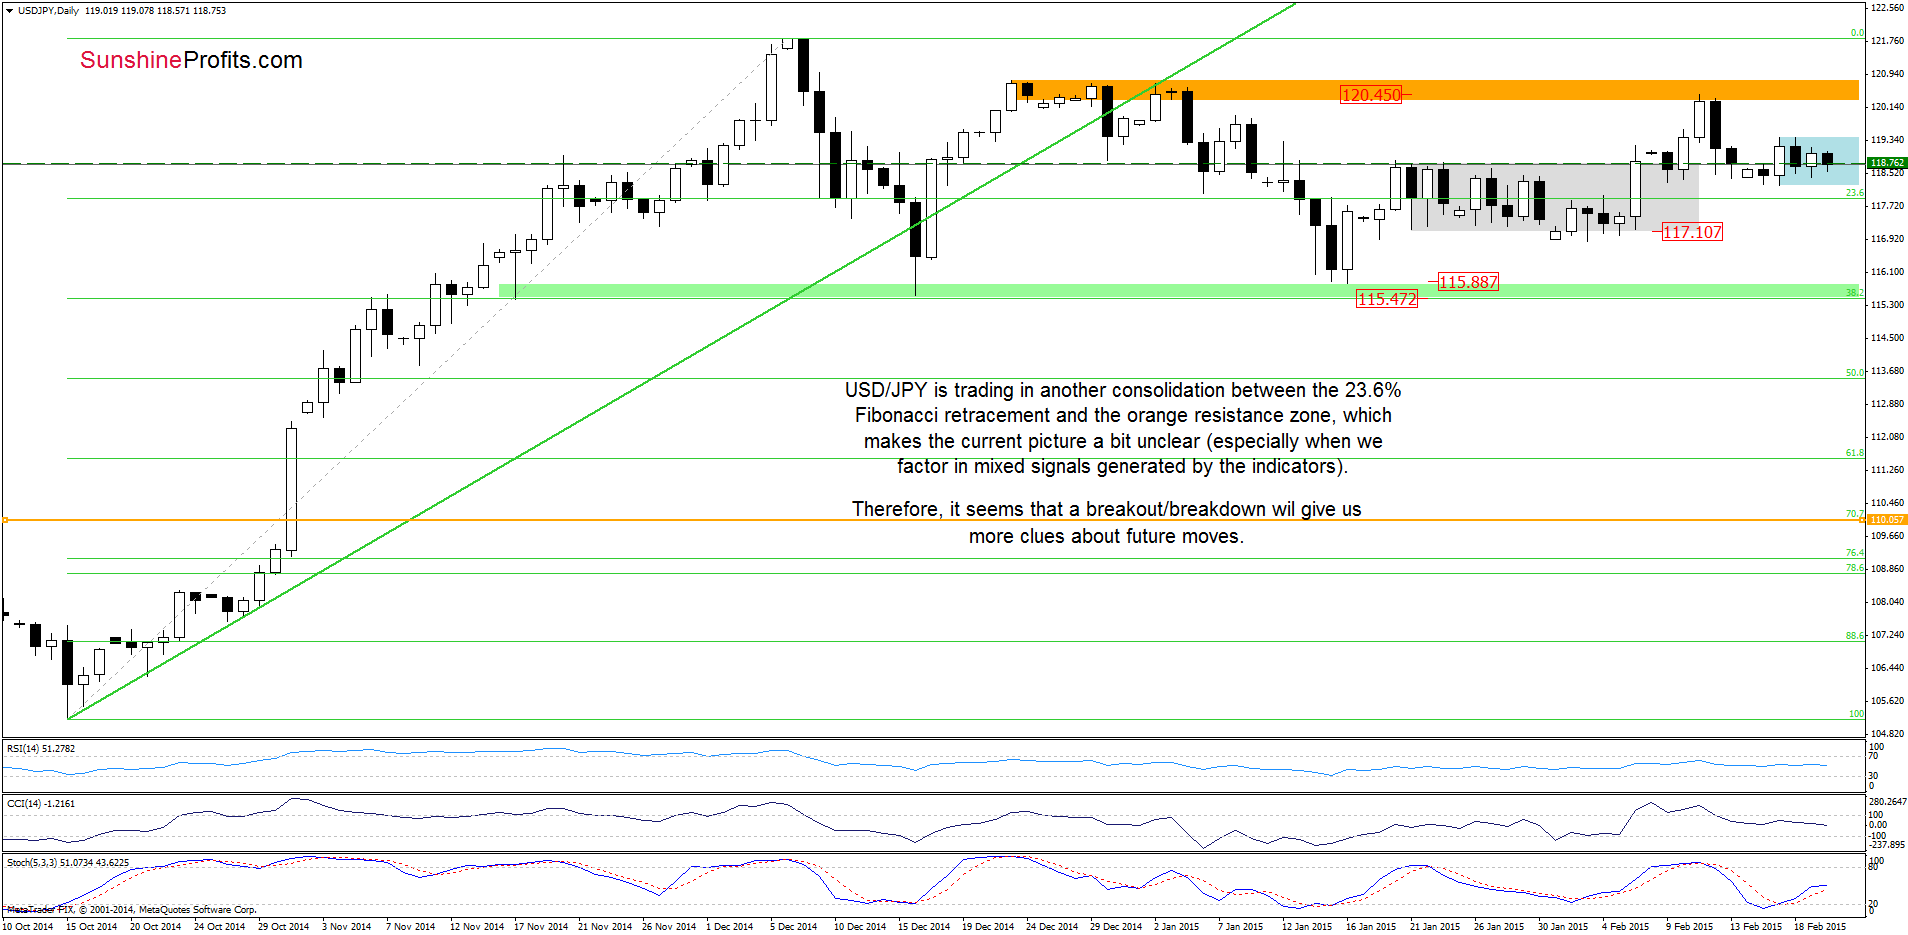
On the daily chart, we see that the situation hasn’t changed much since our last commentary on this currency pair was posted because USD/JPY is trading in a narrow range between the 23.6% Fibonacci retracement and the orange resistance zone (reinforced by the 61.8% Fibonacci retracement seen on the monthly chart). This makes the very short-term situation a bit unclear – especially when we factor in mixed signals generated by the indicators. Therefore, it seems to us that a breakout/breakdown will give us more clues about future moves and indicate the direction of the next bigger move. Until this time, waiting on the sidelines for a profitable opportunity is the best choice.
Very short-term outlook: mixed
Short-term outlook: mixed
MT outlook: mixed
LT outlook: bullish
Trading position (short-term; our opinion): No positions are justified from the risk/reward perspective at the moment. We will keep you informed should anything change, or should we see a confirmation/invalidation of the above.
USD/CAD
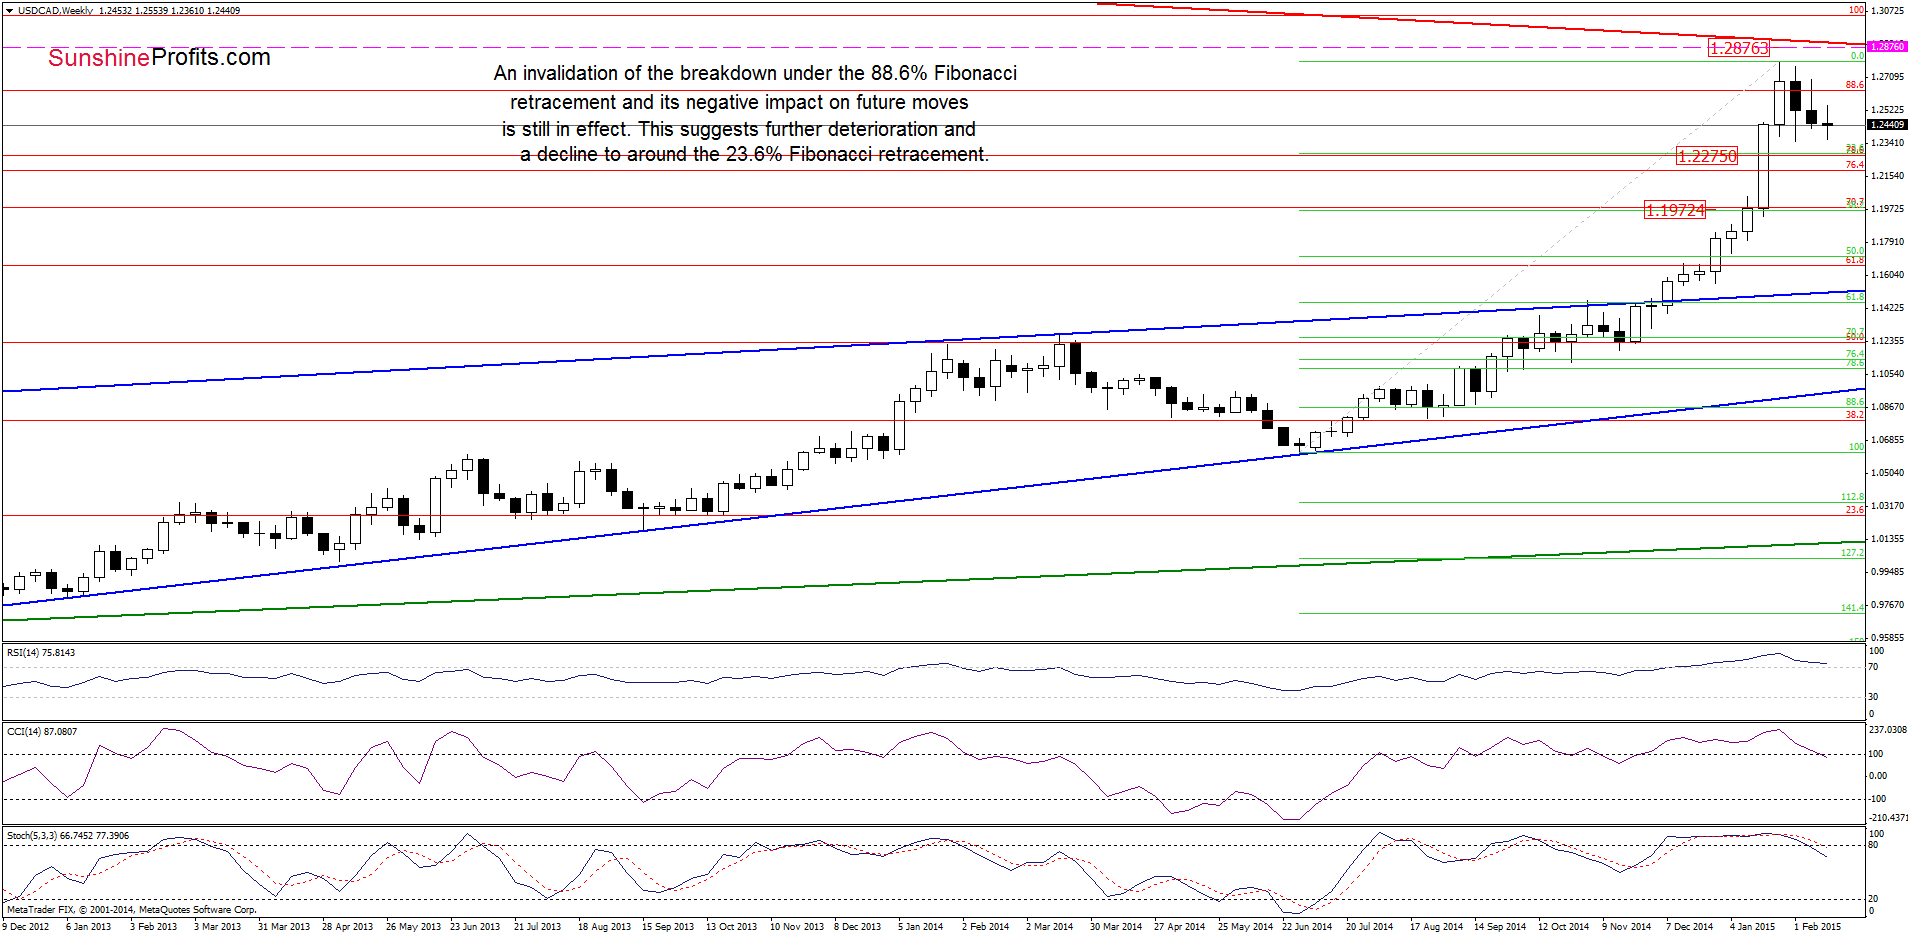
The situation in the medium-term has deteriorated slightly as USD/CAD extended decline below the 88.6% Fibonacci retracement and the long-term red declining resistance line. This is a bearish sign which suggests a drop to the 23.6% (around 1.2275) or even 38.2% (at 1.1973) Fibonacci retracement based on the entire Jun-Jan rally in the coming week.
What can we infer from the daily chart? Let’s check.
Quoting our previous commentary on this currency pair:
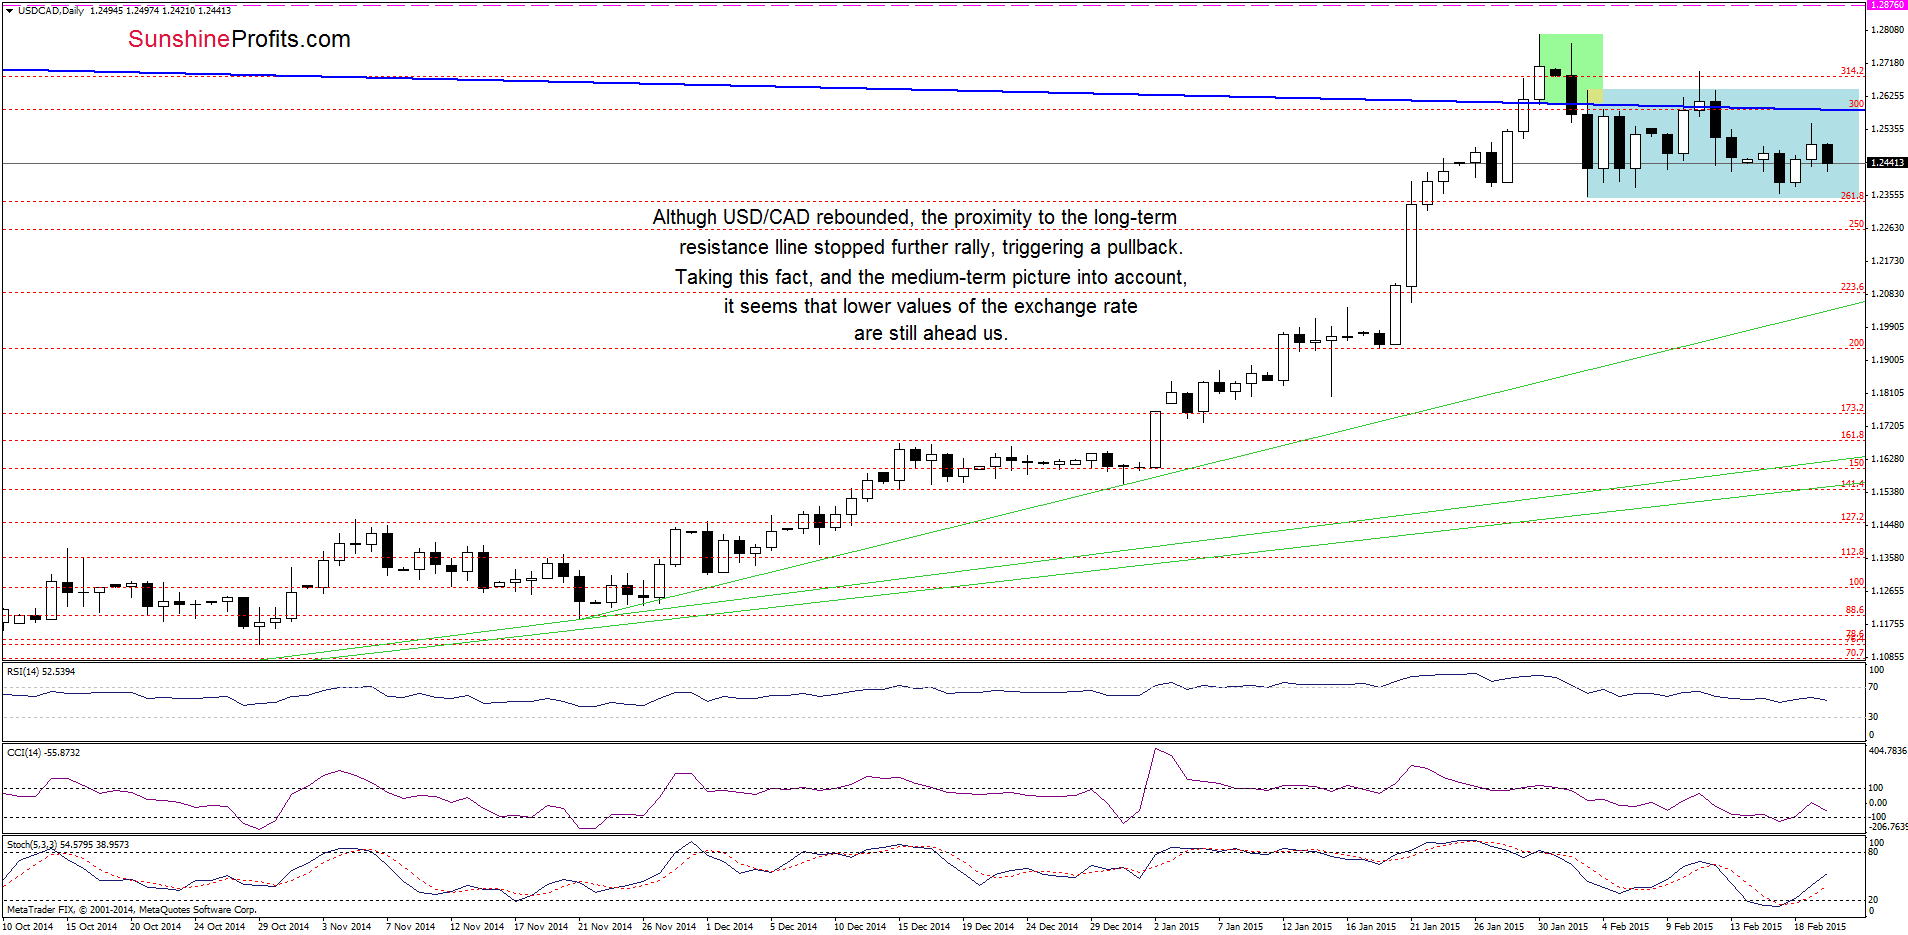
(…) the exchange rate could rebound from here as the support level based on the Feb 3 still holds
As you see on the daily chart, the situation developed in line with the above-mentioned scenario and USD/CAD moved higher in the recent days. Despite this small increase, the proximity to the blue long-term resistance line stopped further rally, triggering a pullback earlier today. Therefore, we think that as long as this key resistance line is in play, further rally is questionable and another test of the recent lows is likely.
Very short-term outlook: bearish
Short-term outlook: mixed with bearish bias
MT outlook: mixed
LT outlook: mixed
Trading position (short-term; our opinion): Short positions with a stop loss order at 1.2876 are justified from the risk/reward perspective at the moment. We will keep you informed should anything change, or should we see a confirmation/invalidation of the above.
USD/CHF
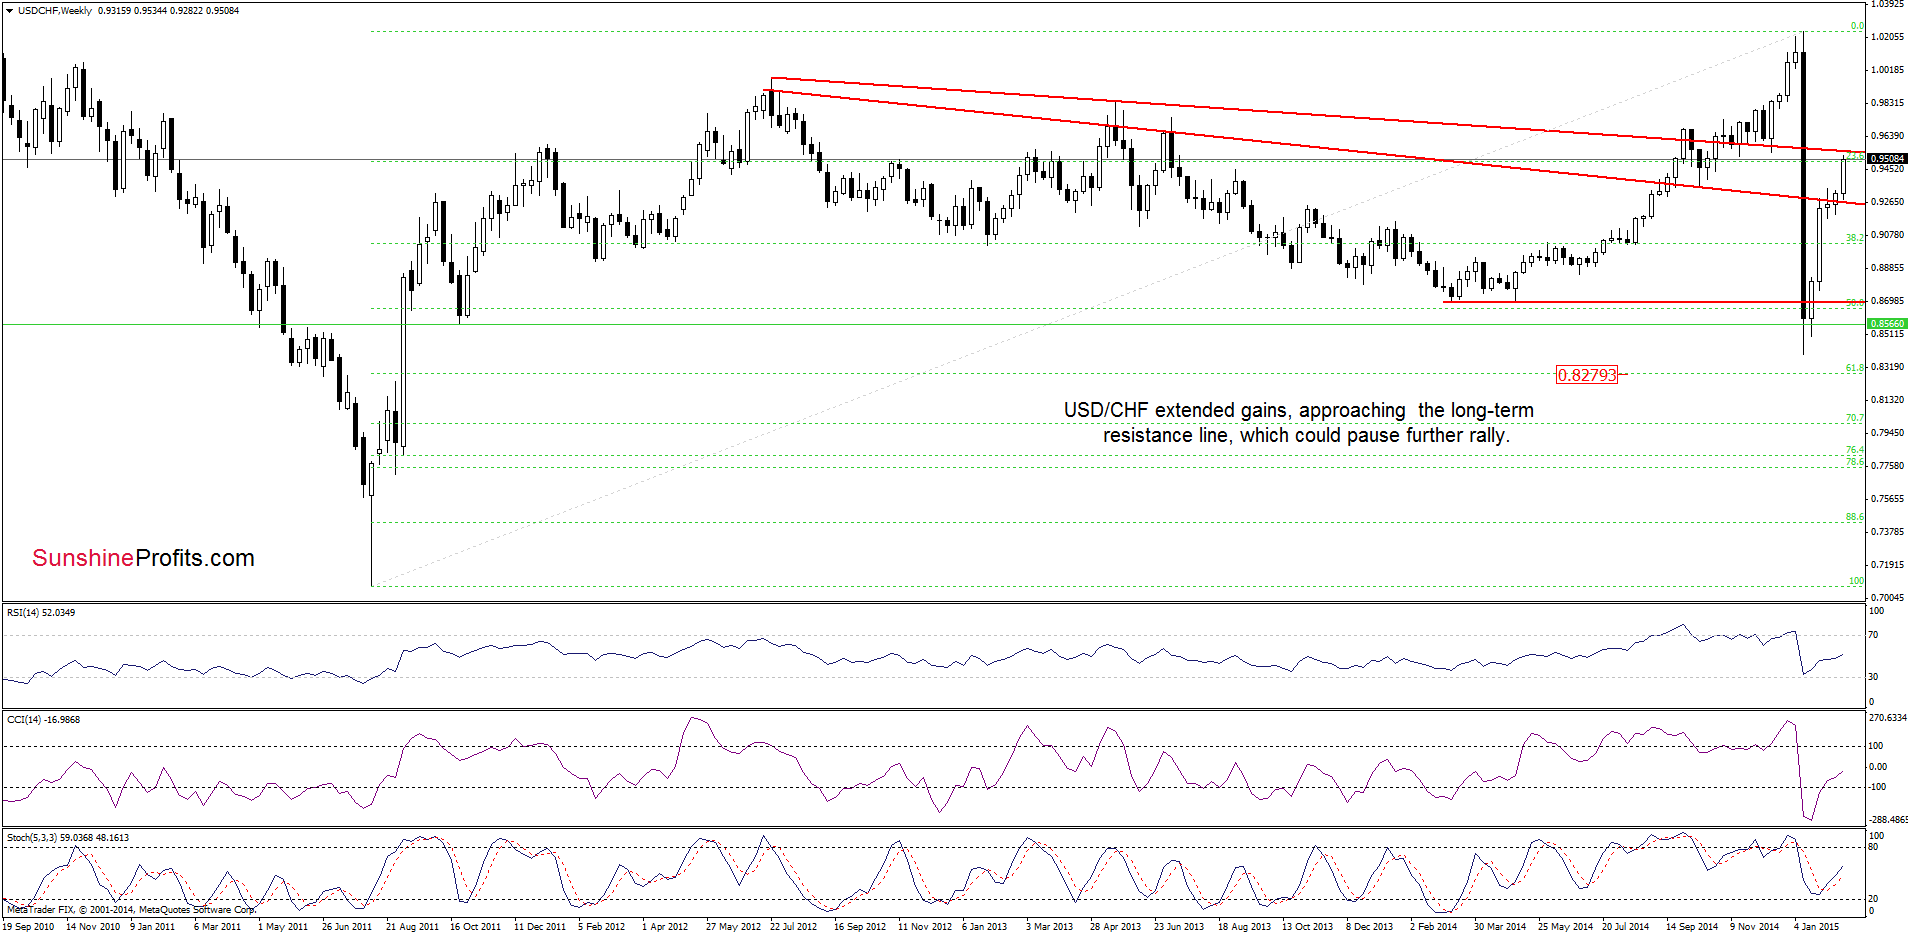
The medium-term picture has improved once again as USD/CHF extended gains and approached the long-term resistance line.
How did this increase influence the very short-term picture? Let’s zoom in our picture and find out.
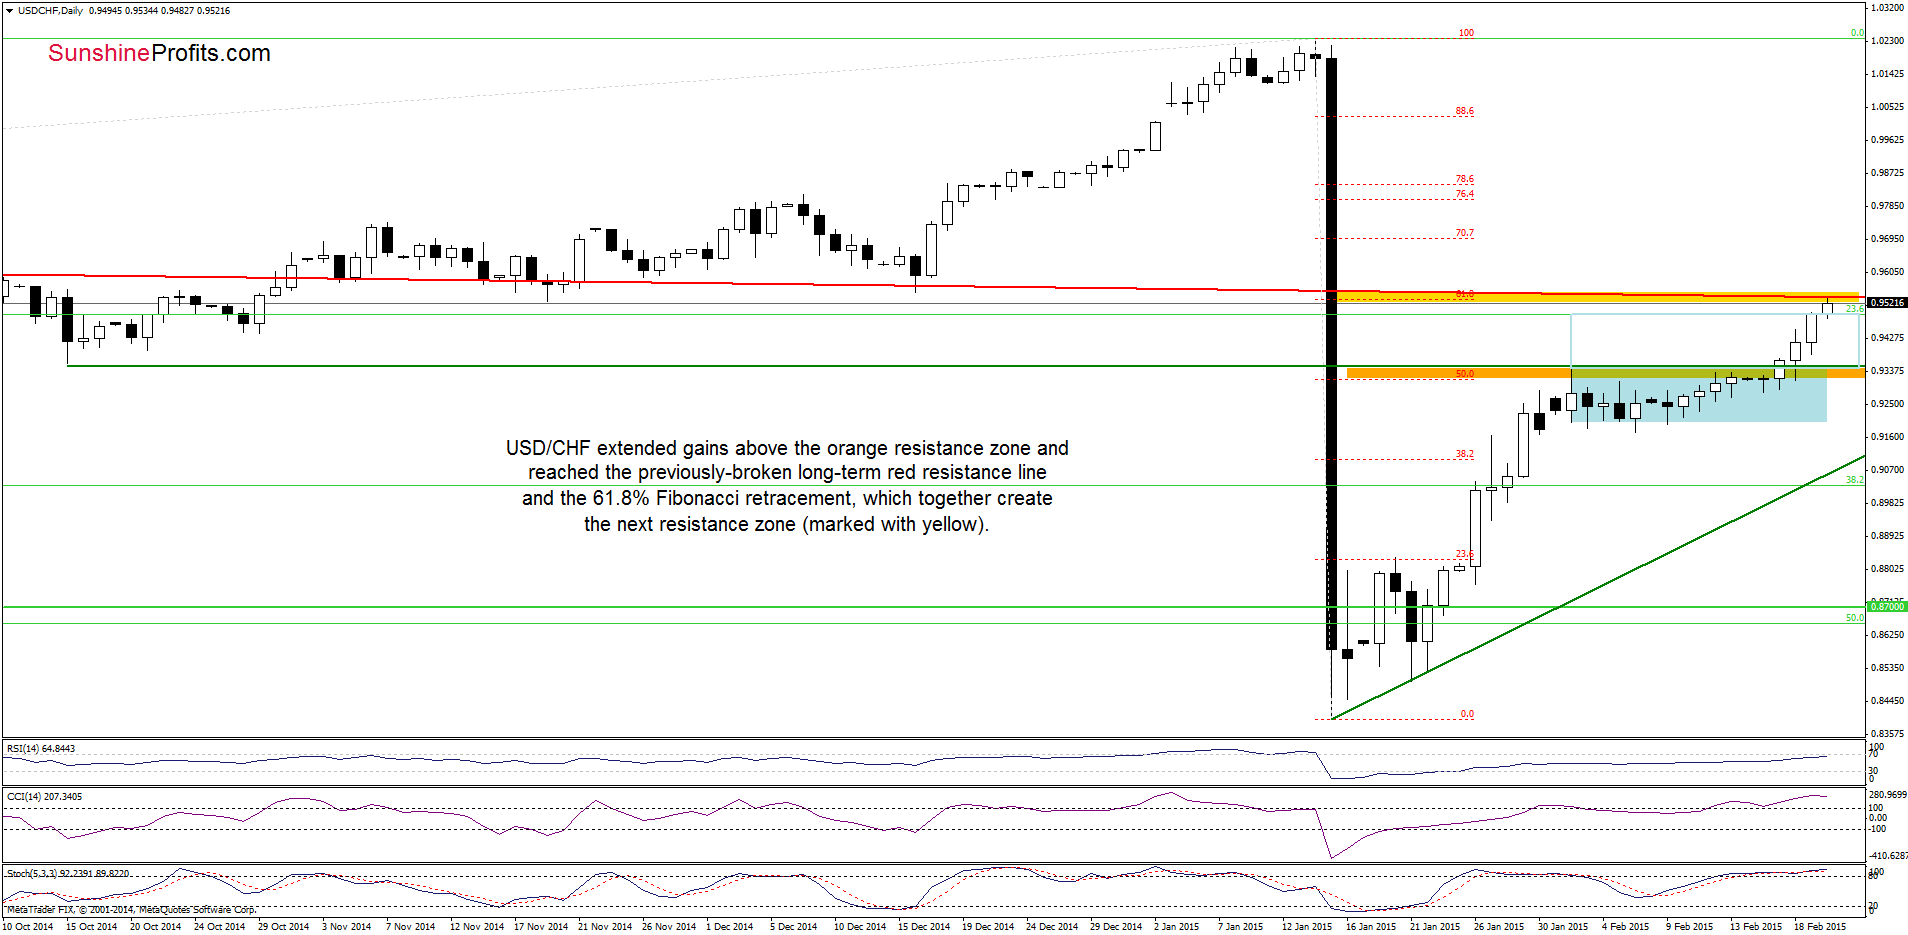
Looking at the above chart, we see that USD/CHF reached our next upside target (the previously-broken long-term red declining resistance line) earlier today. As you see on the daily chart, in this area is also the 61.8% Fibonacci retracement, which reinforces the yellow resistance zone. Taking this fact into account, we believe that what we wrote on Wednesday is up-to-date:
(…) the previously-broken long-term red declining resistance line, which will pause or even stop further rally. This scenario is currently reinforced by the position of the indicators (the CCI and Stochastic Oscillator are overbought, which suggests that they could generate sell signals in the coming days, encouraging currency bears to act). Nevertheless, as long as there are no sell signals, higher values of the exchange rate are still ahead us.
Very short-term outlook: mixed
Short-term outlook: mixed
MT outlook: mixed
LT outlook: bearish
Trading position (short-term; our opinion): No positions are justified from the risk/reward perspective at the moment. We will keep you informed should anything change, or should we see a confirmation/invalidation of the above.
AUD/USD
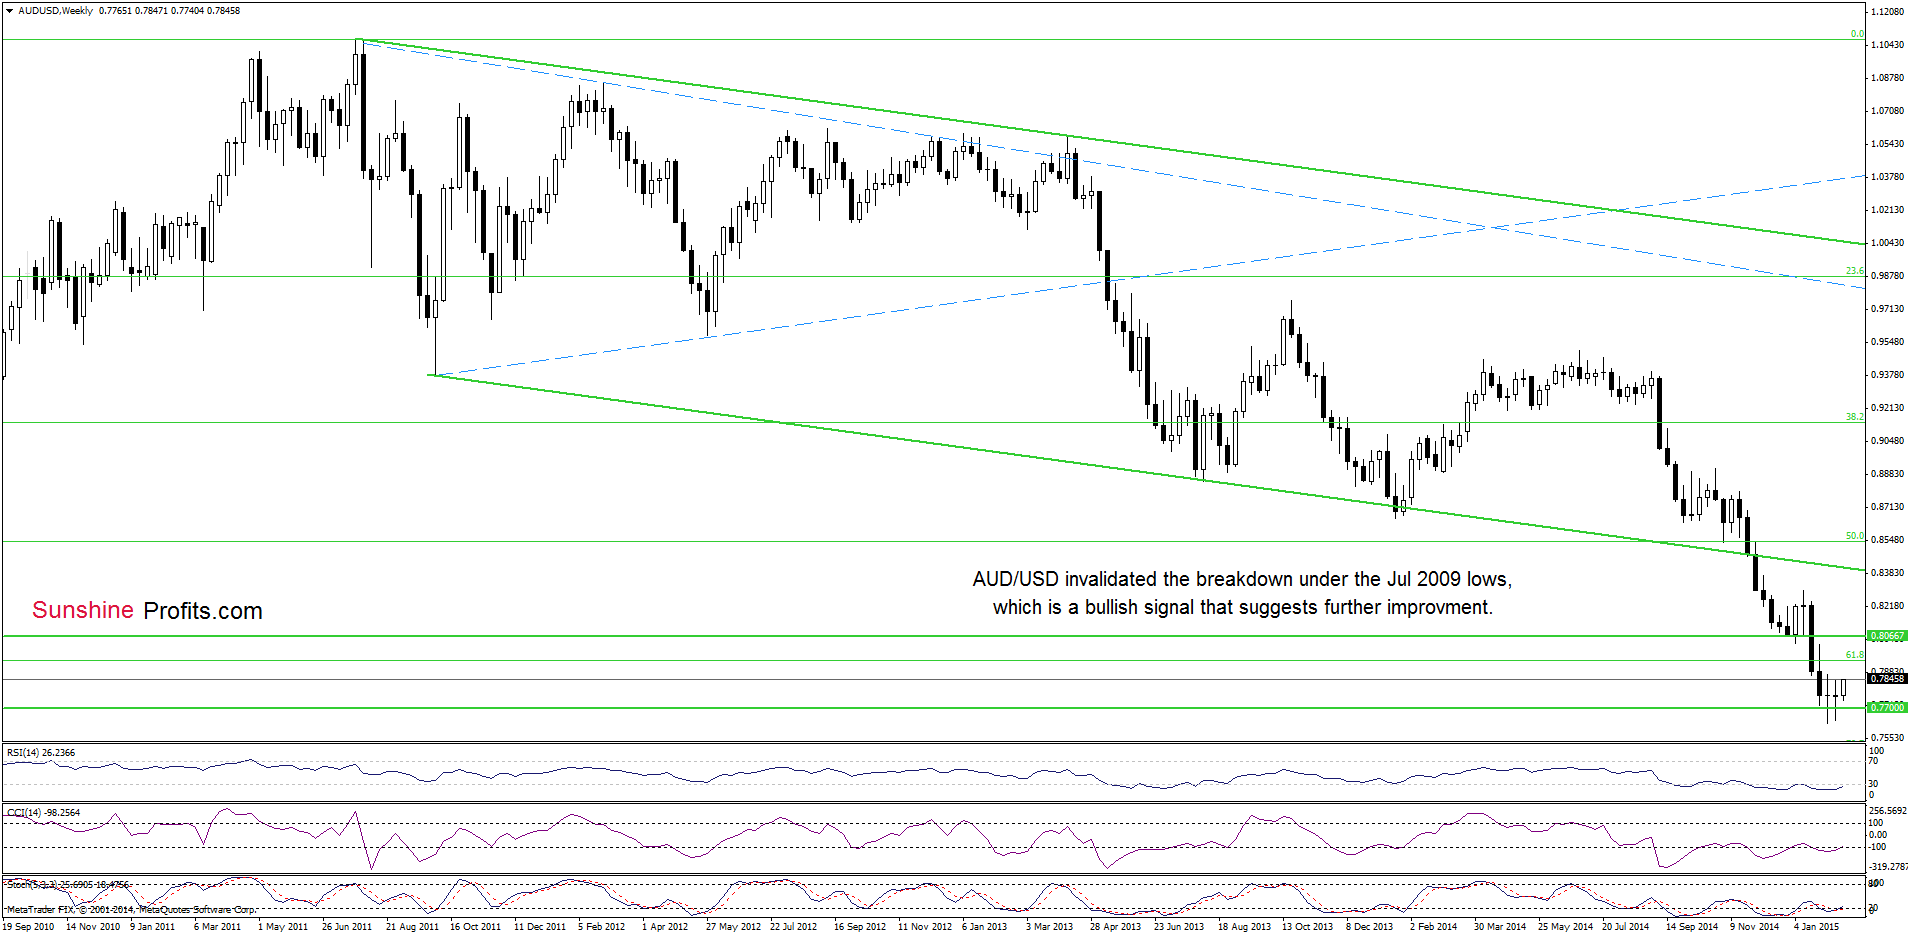
The situation in the medium term hasn’t changed much as an invalidation of the breakdown below the Jul 2009 lows and its potential positive impact on future moves is still in effect.
Having said that, let’s take a closer look at the daily chart.
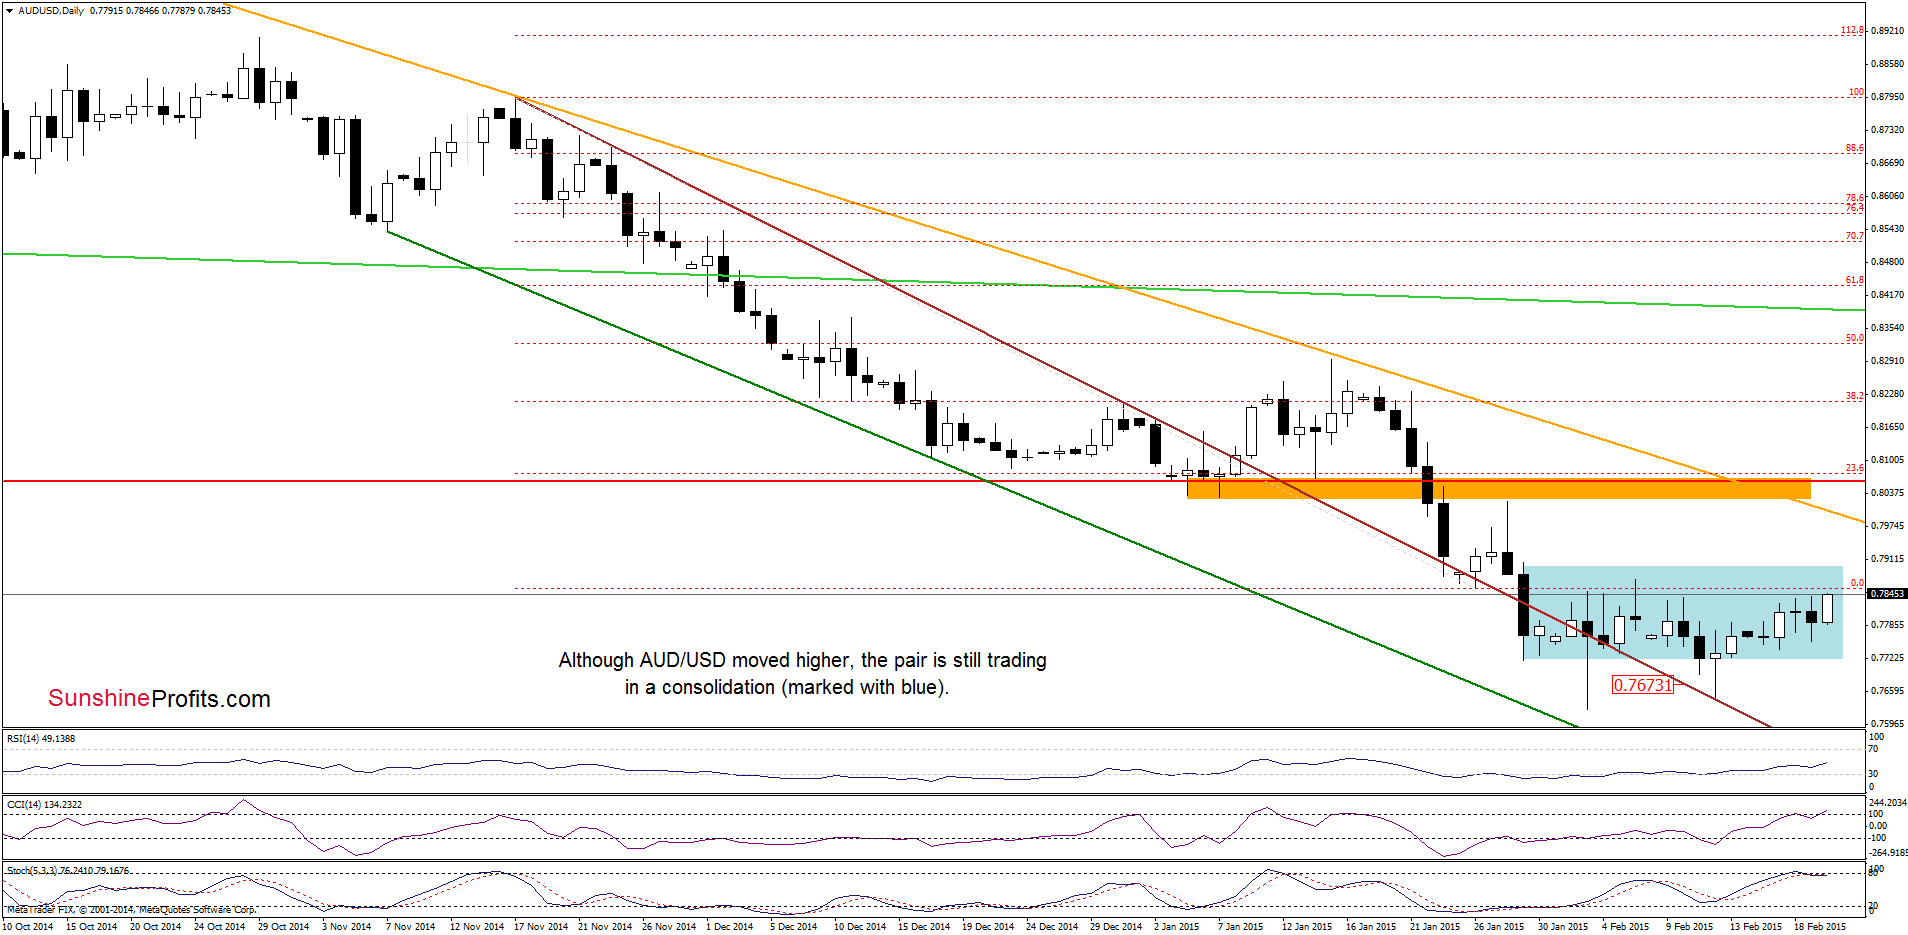
On the above chart, we see that although the pair moved little higher earlier today, the situation in the very short-term also hasn’t changed much as the exchange rate is still trading in the consolidation. If the pair extends gains, the initial upside target would be the upper border of the formation. Nevertheless, taking into account the current position of the indicators (the CCI is overbought, while Stochastic Oscillator generated sell signals), it seems that the pair will reverse and test of the lower border of the formation (around 0.7718) in the coming week.
Very short-term outlook: mixed with bearish bias
Short-term outlook: mixed
MT outlook: mixed
LT outlook: mixed
Trading position (short-term; our opinion): No positions are justified from the risk/reward perspective at the moment. We will keep you informed should anything change, or should we see a confirmation/invalidation of the above.
Thank you.
Nadia Simmons
Forex & Oil Trading Strategist
Przemyslaw Radomski, CFA
Founder, Editor-in-chief
Gold & Silver Trading Alerts
Forex Trading Alerts
Oil Investment Updates
Oil Trading Alerts

