
Earlier today, the USD Index moved lower once again as yesterday’s disappointing data continued to weigh. How did these circumstances affect the major currency pairs’ outlooks?
In our opinion the following forex trading positions are justified - summary:
- EUR/USD: long (stop loss order at 1.1056)
- GBP/USD: none
- USD/JPY: none
- USD/CAD: short (stop loss order at 1.2876)
- USD/CHF: none
- AUD/USD: none
EUR/USD
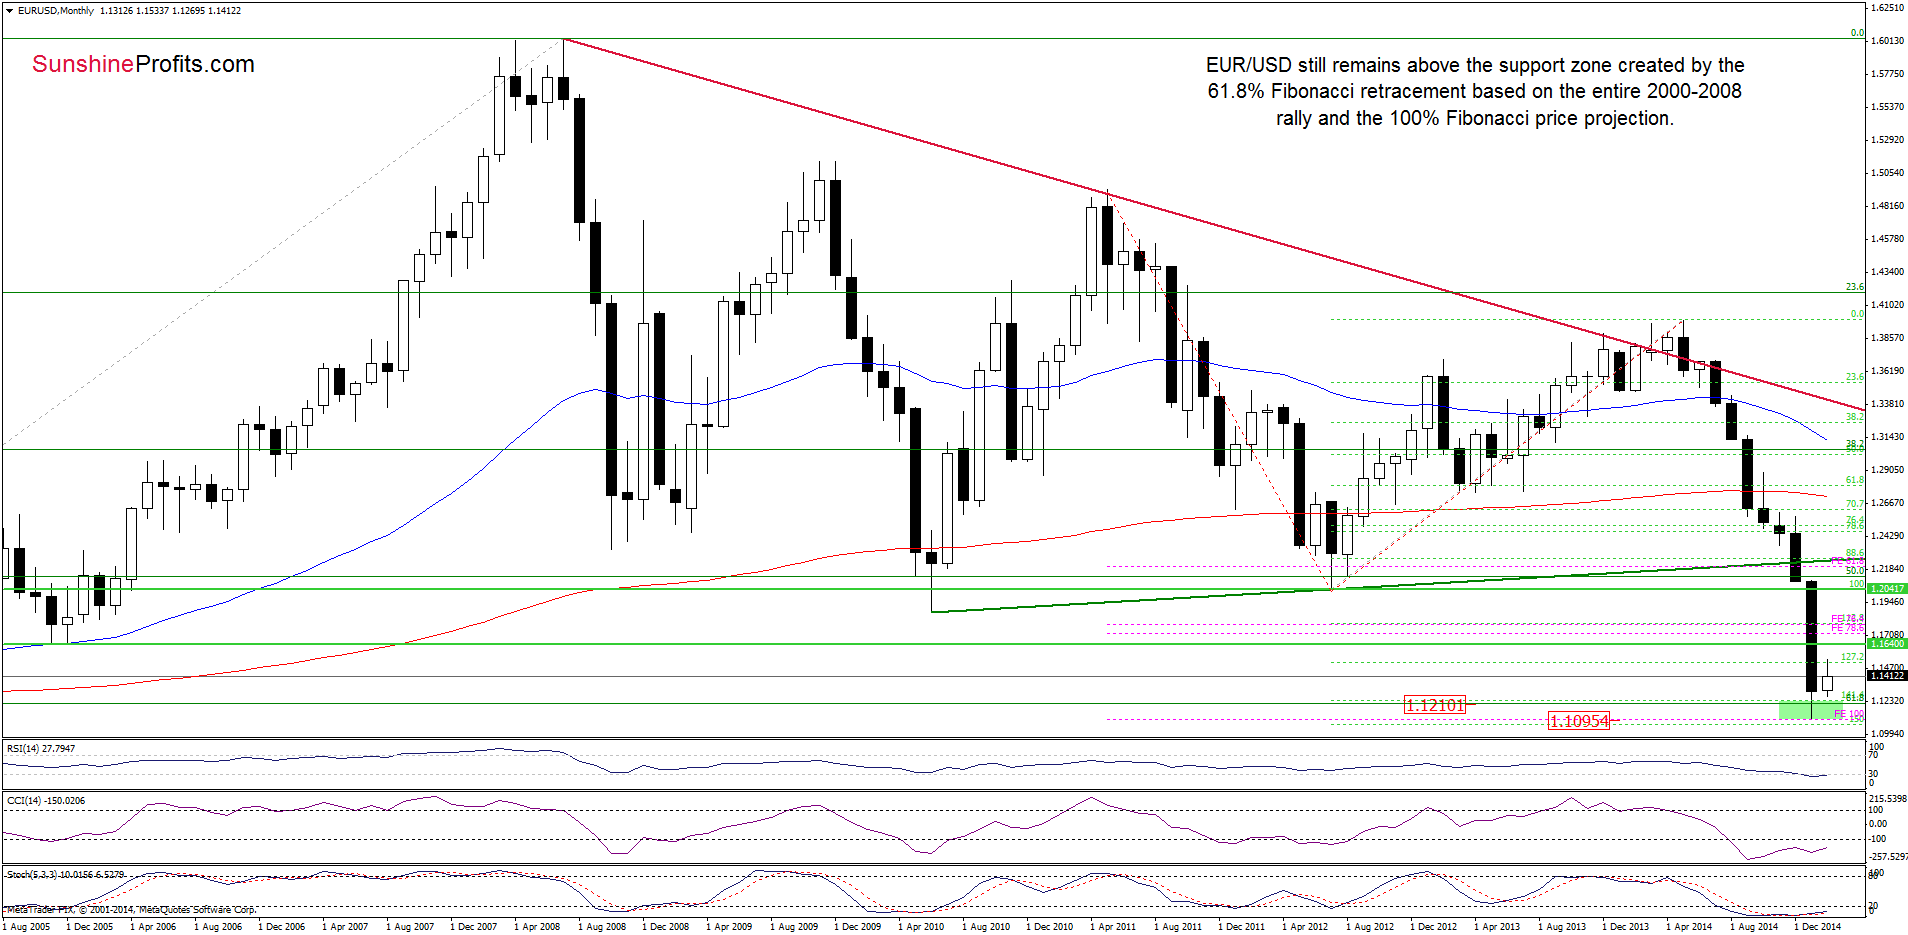
EUR/USD still remains above the support zone created by the 61.8% Fibonacci retracement (based on the entire 2000-2008 rally) and the 100% Fibonacci price projection, which means that an invalidation of the breakdown below these levels and its positive impact on the exchange rate are still in effect.
Having said that, let’s focus on the daily chart.
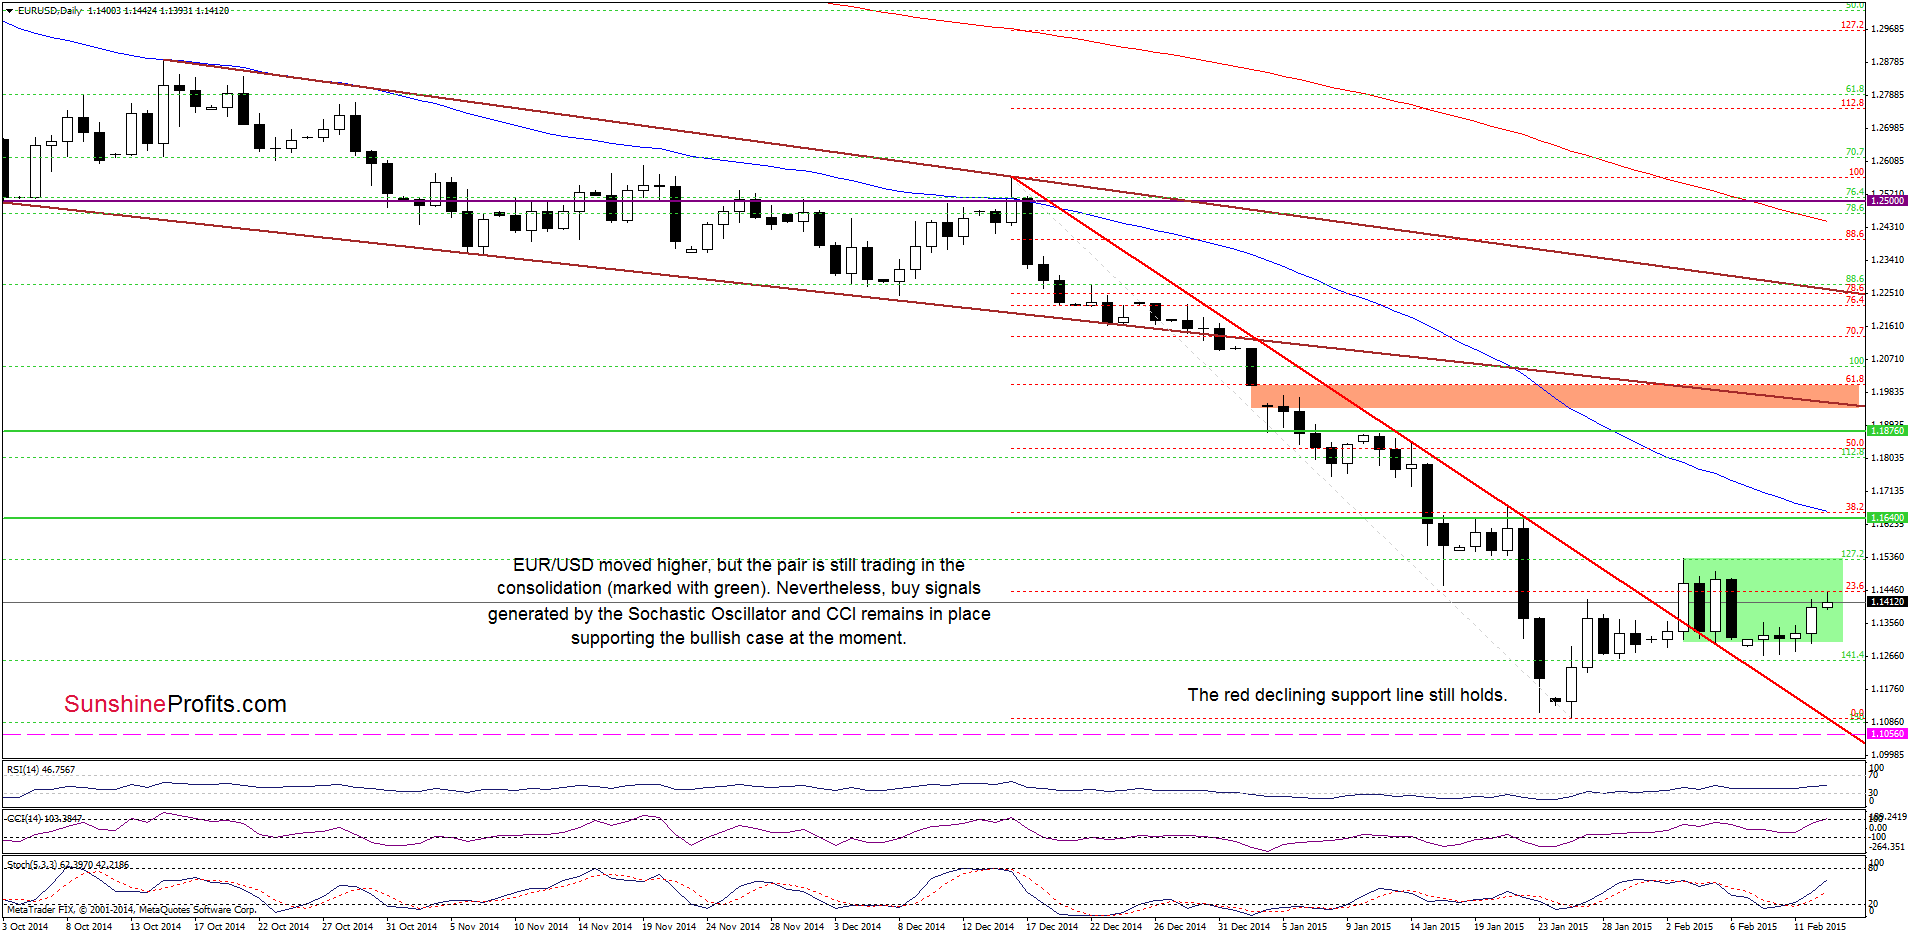
Looking at the above chart, we see that the situation has improved as EUR/USD extended gains after a comeback to the consolidation range. Taking this fact into account, and combining it with the buy signal generated by the Stochastic Oscillator and the medium-term picture, we think that higher values of the exchange rate are still ahead us. If this is the case, the initial upside target for currency bulls would be the upper border of the consolidation around 1.1533.
Very short-term outlook: bullish
Short-term outlook: mixed
MT outlook: mixed
LT outlook: mixed
Trading position (short-term): Long positions with a stop loss order at 1.1056 are justified from the risk/reward perspective at the moment. We will keep you informed should anything change, or should we see a confirmation/invalidation of the above.
GBP/USD
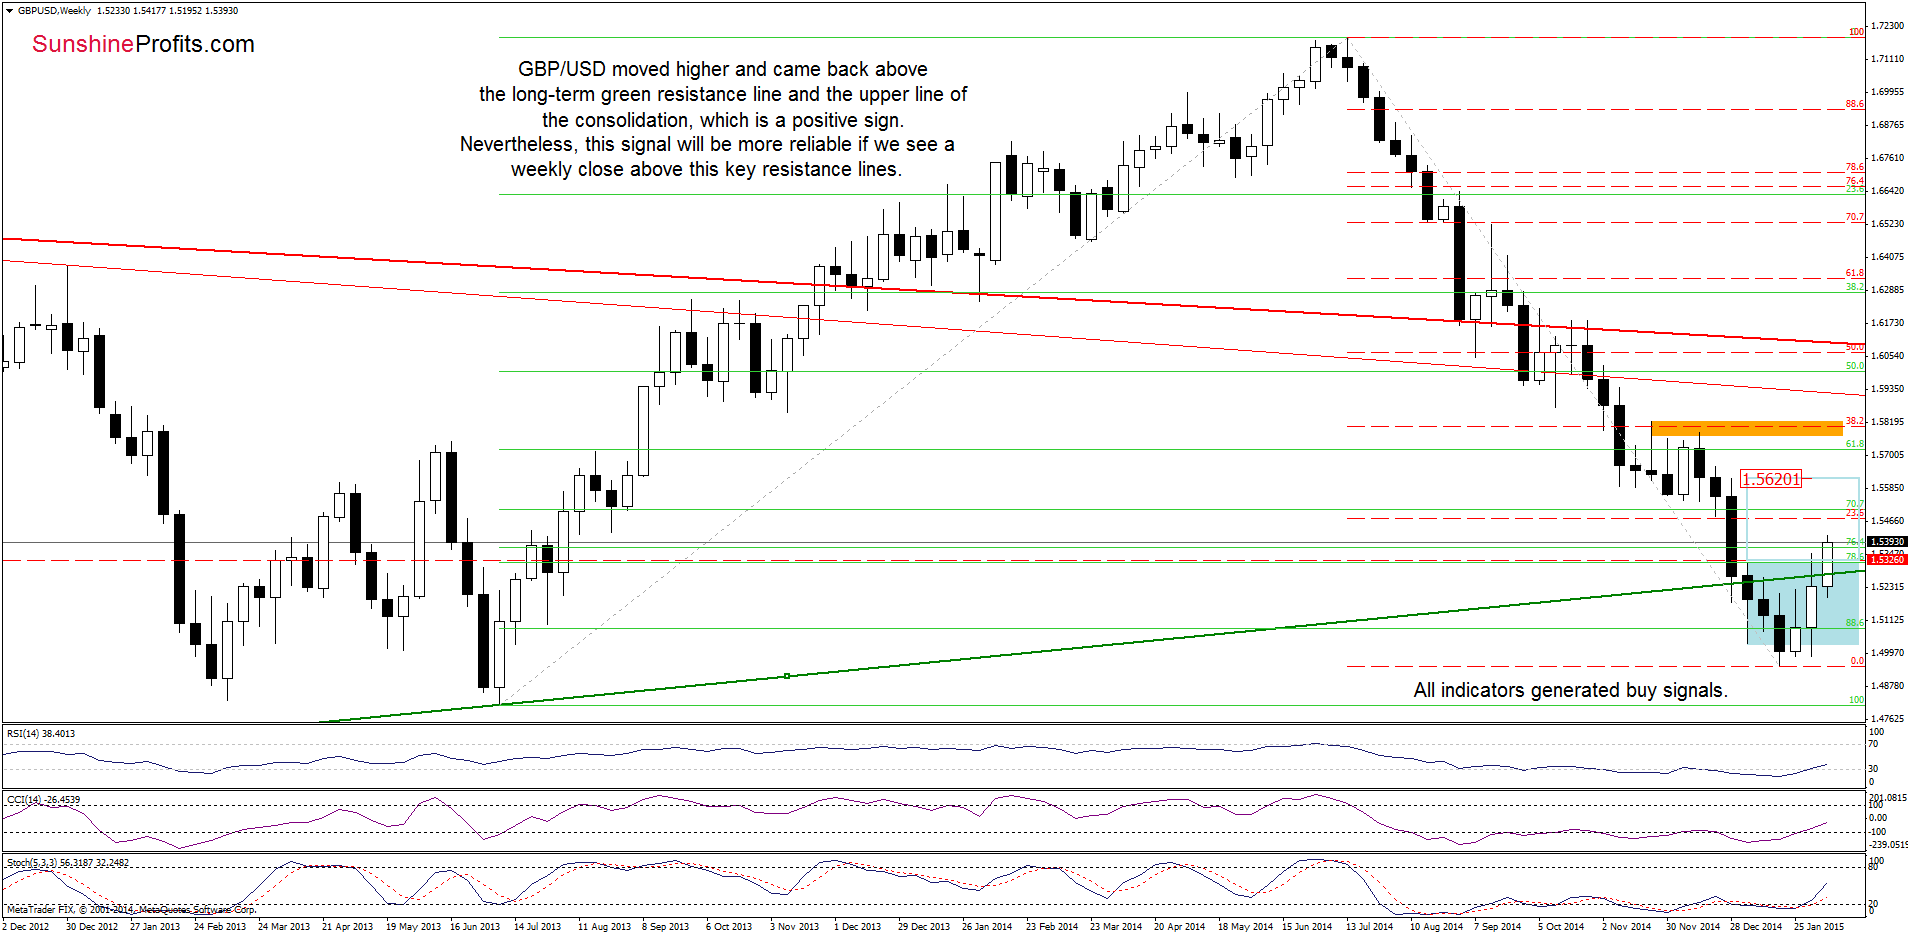
The situation in the medium-term has improved significantly as GBP/USD extended rally above the previously-broken long-term resistance line and climbed above the upper line of the consolidation (marked with blue). This is a positive signal, which suggests further improvement and an increase to around 1.5620, where the size of an upswing will correspond to the height of the consolidation and where the Dec 28 high is. Nevertheless, we think that this scenario will be more reliable if we see a weekly close above this key resistance lines.
How did this move affect the short-term picture? Let’s take a look.
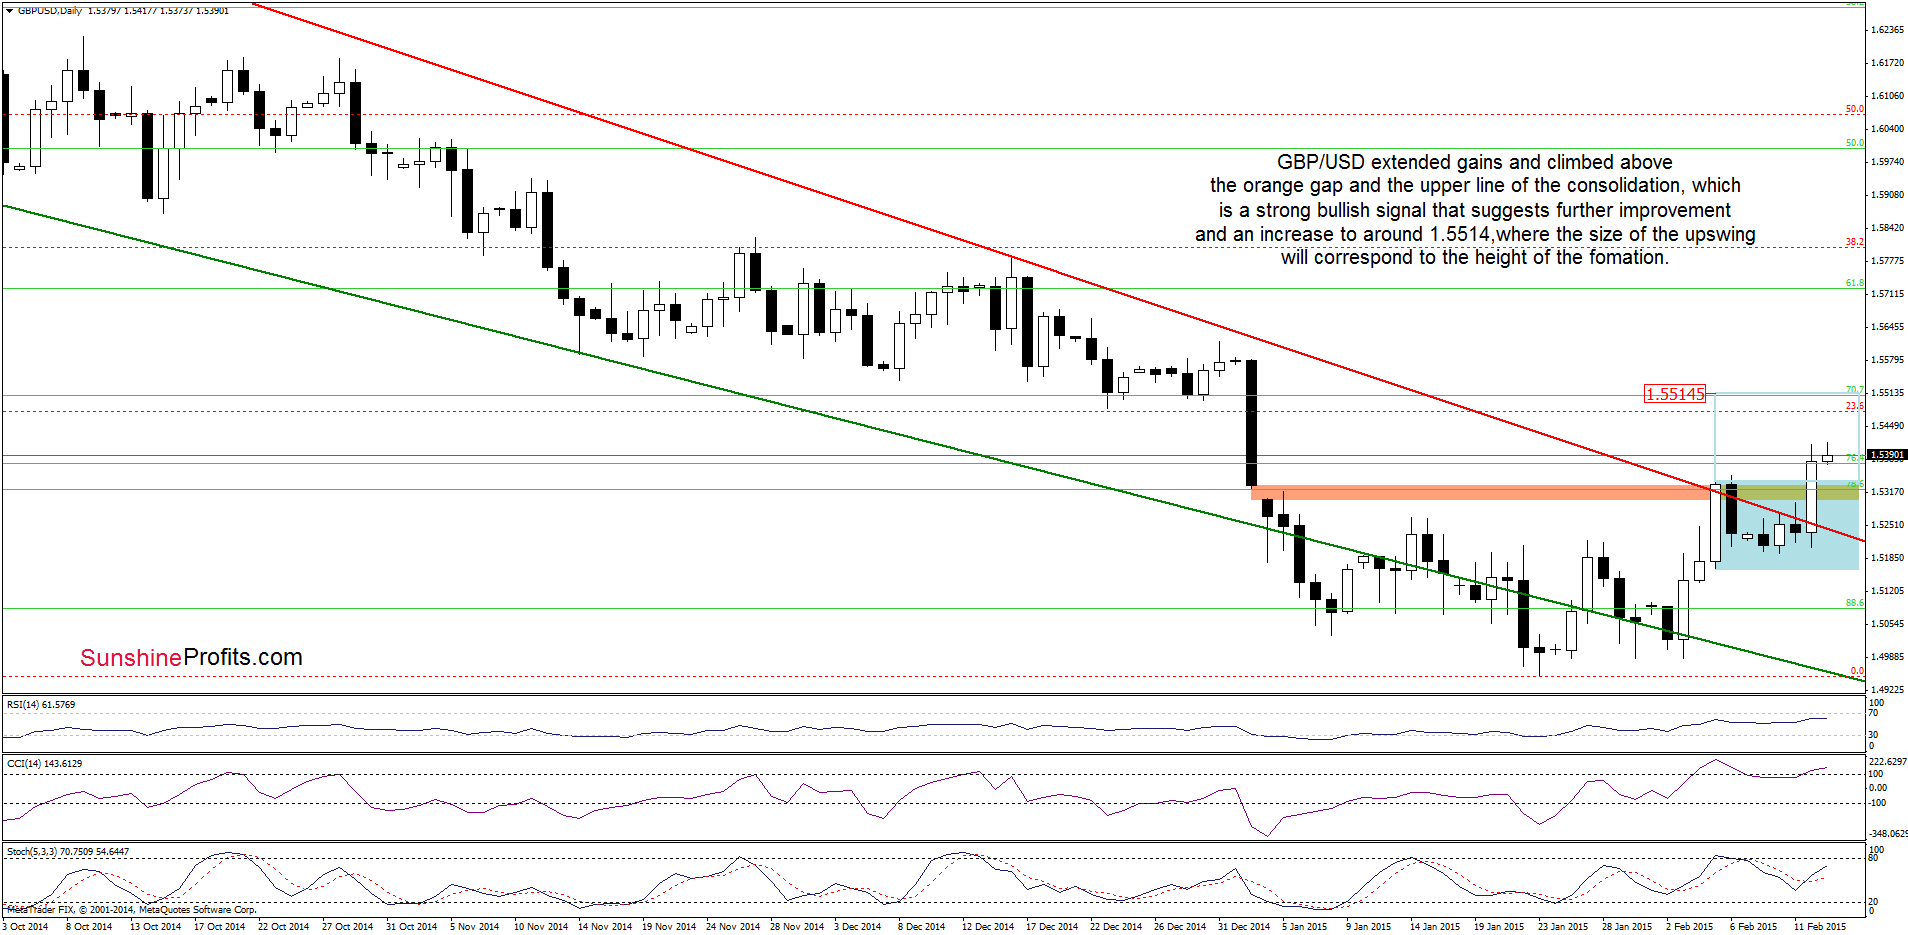
The first thing that catches the eye on the above chart is a successful breakout above the orange gap and the upper line of the consolidation. This is a bullish signal, which suggests further rally and an increase to at least 1.5514, where the size of the upswing will correspond to the height of the formation. At this point, it is worth noting that the buy signal generated by the Stochastic Oscillator supports the bullish case at the moment.
Very short-term outlook: bullish
Short-term outlook: mixed with bullish bias
MT outlook: mixed
LT outlook: mixed
Trading position (short-term): In our opinion, no positions are justified from the risk/reward perspective at the moment. We will keep you informed should anything change, or should we see a confirmation/invalidation of the above.
USD/JPY
Quoting our last commentary on this currency pair:
(…) we think that the next move will be to the downside. If this is the case, the initial downside target would be around 118.75.
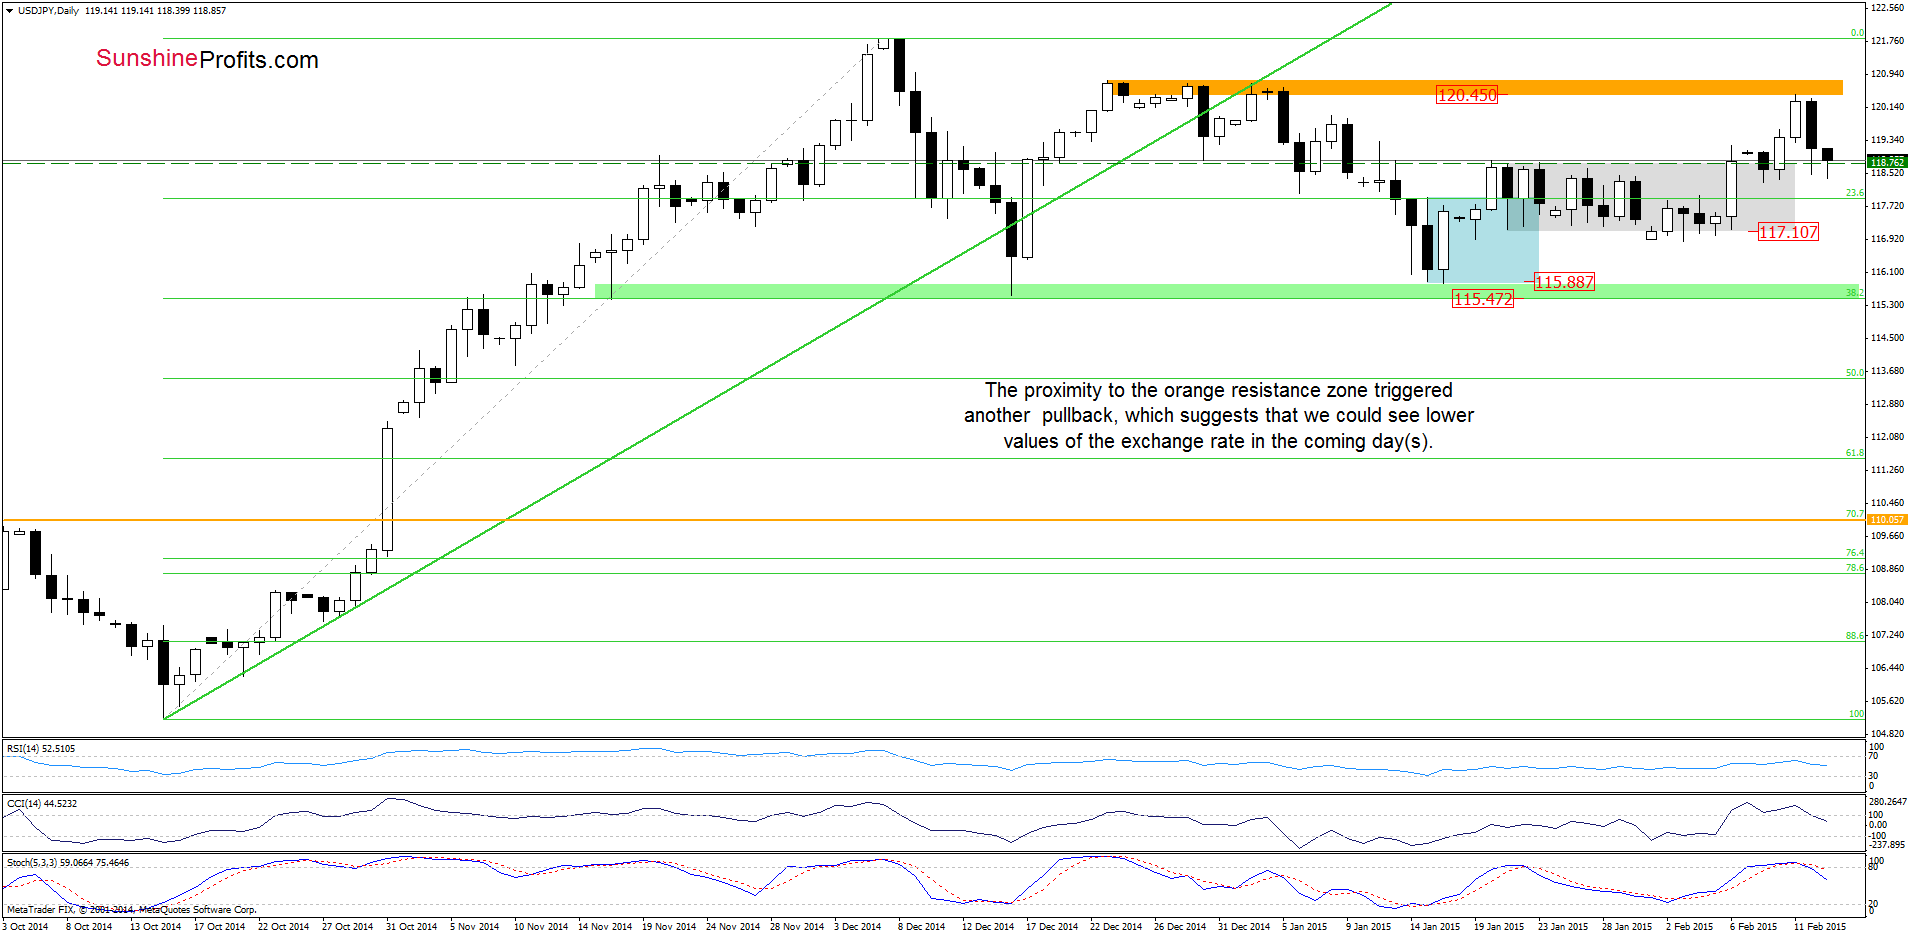
As you see on the daily chart, the situation developed in line with the above-mentioned scenario and USD/JPY reached our initial downside target. What’s next? Taking into account the fact that the exchange rate is still trading below the orange resistance zone, we believe that our yesterday’s commentary is up-to-date:
(…) the pair also approached the orange resistance zone created by the Dec and Jan highs, which triggered a pullback (…). In our opinion, as long as there is no breakout above this key resistance zone, further rally is not likely to be seen. The reason?
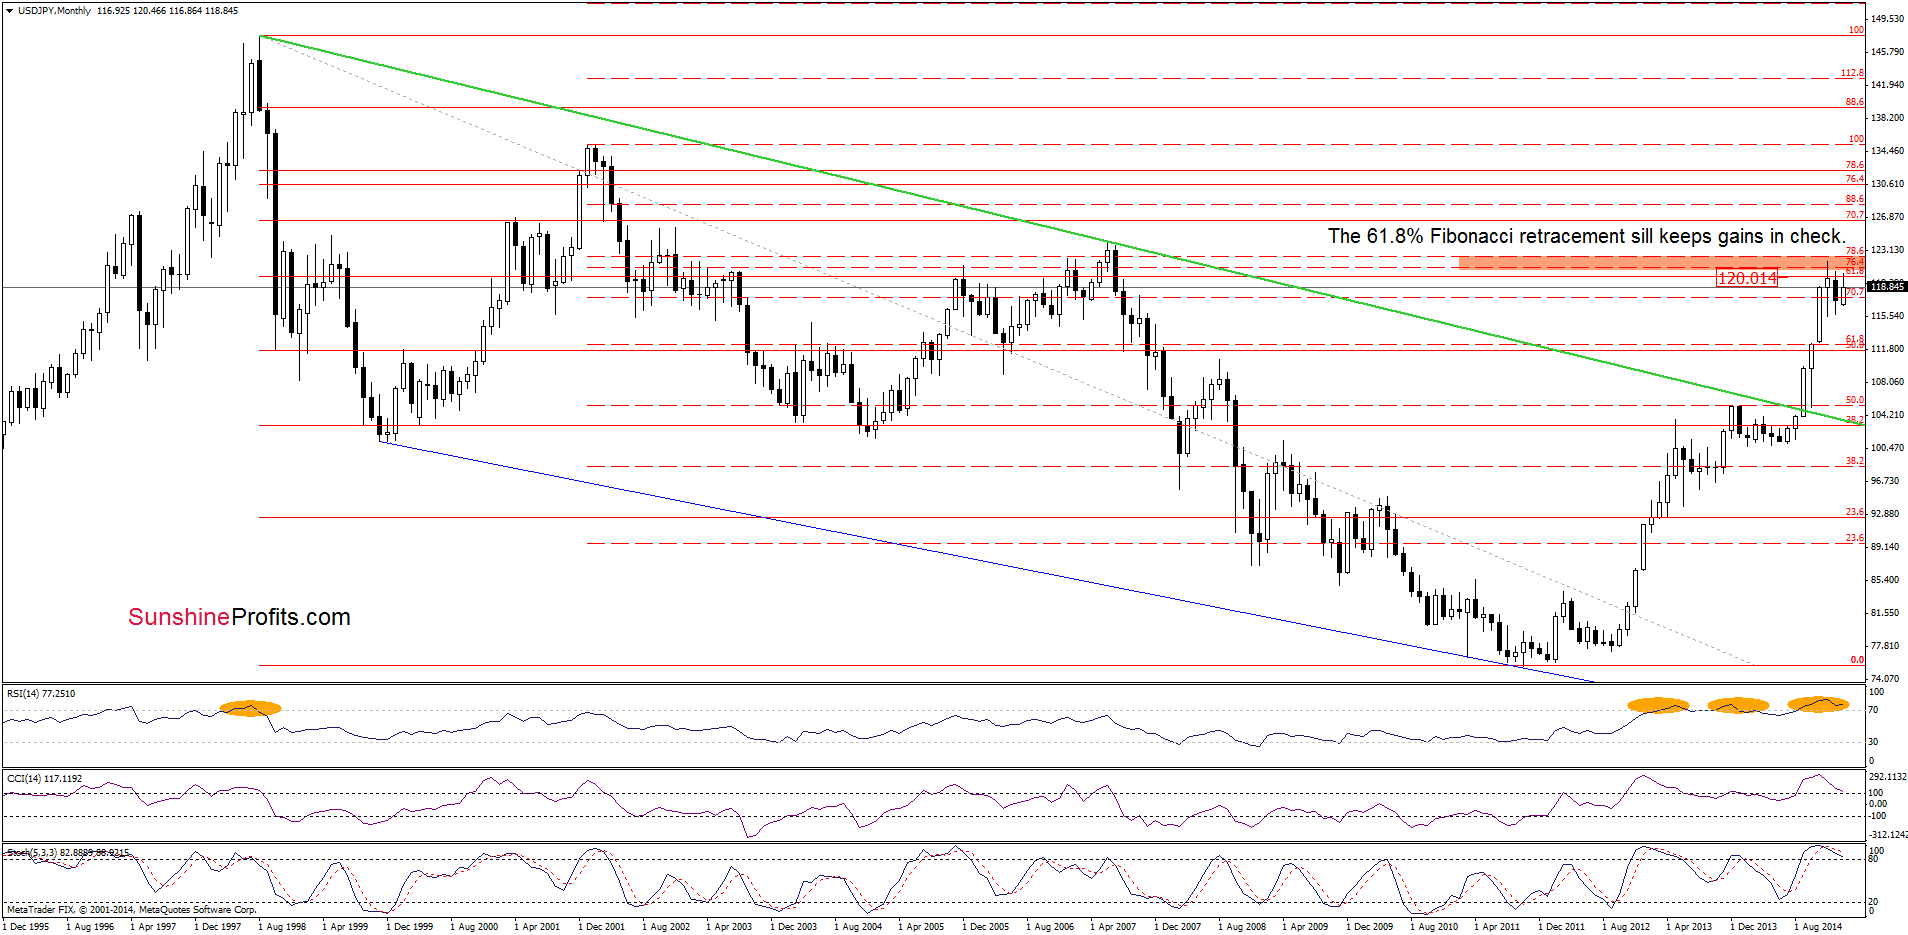
(…) the above-mentioned orange resistance zone is reinforced by the 61.8% Fibonacci retracement level based on the entire 1998-2011 declines. Therefore, as long as this resistance is in play, we won’t see higher values of the exchange rate and further deterioration is likely. Please not that this scenario is currently reinforced by the daily (and also monthly) CCI and Stochastic Oscillator
At this point, it is worth noting that the daily indicators generated sell signals, supporting the bearish case. Therefore, if the pair moves lower, next downside targets would be around 117.11 or even 115.47-115.88, where the bottoms of the previous consolidations are.
Very short-term outlook: mixed with bearish bias
Short-term outlook: mixed with bearish bias
MT outlook: mixed
LT outlook: bullish
Trading position (short-term; our opinion): No positions are justified from the risk/reward perspective at the moment. We will keep you informed should anything change, or should we see a confirmation/invalidation of the above.
USD/CAD
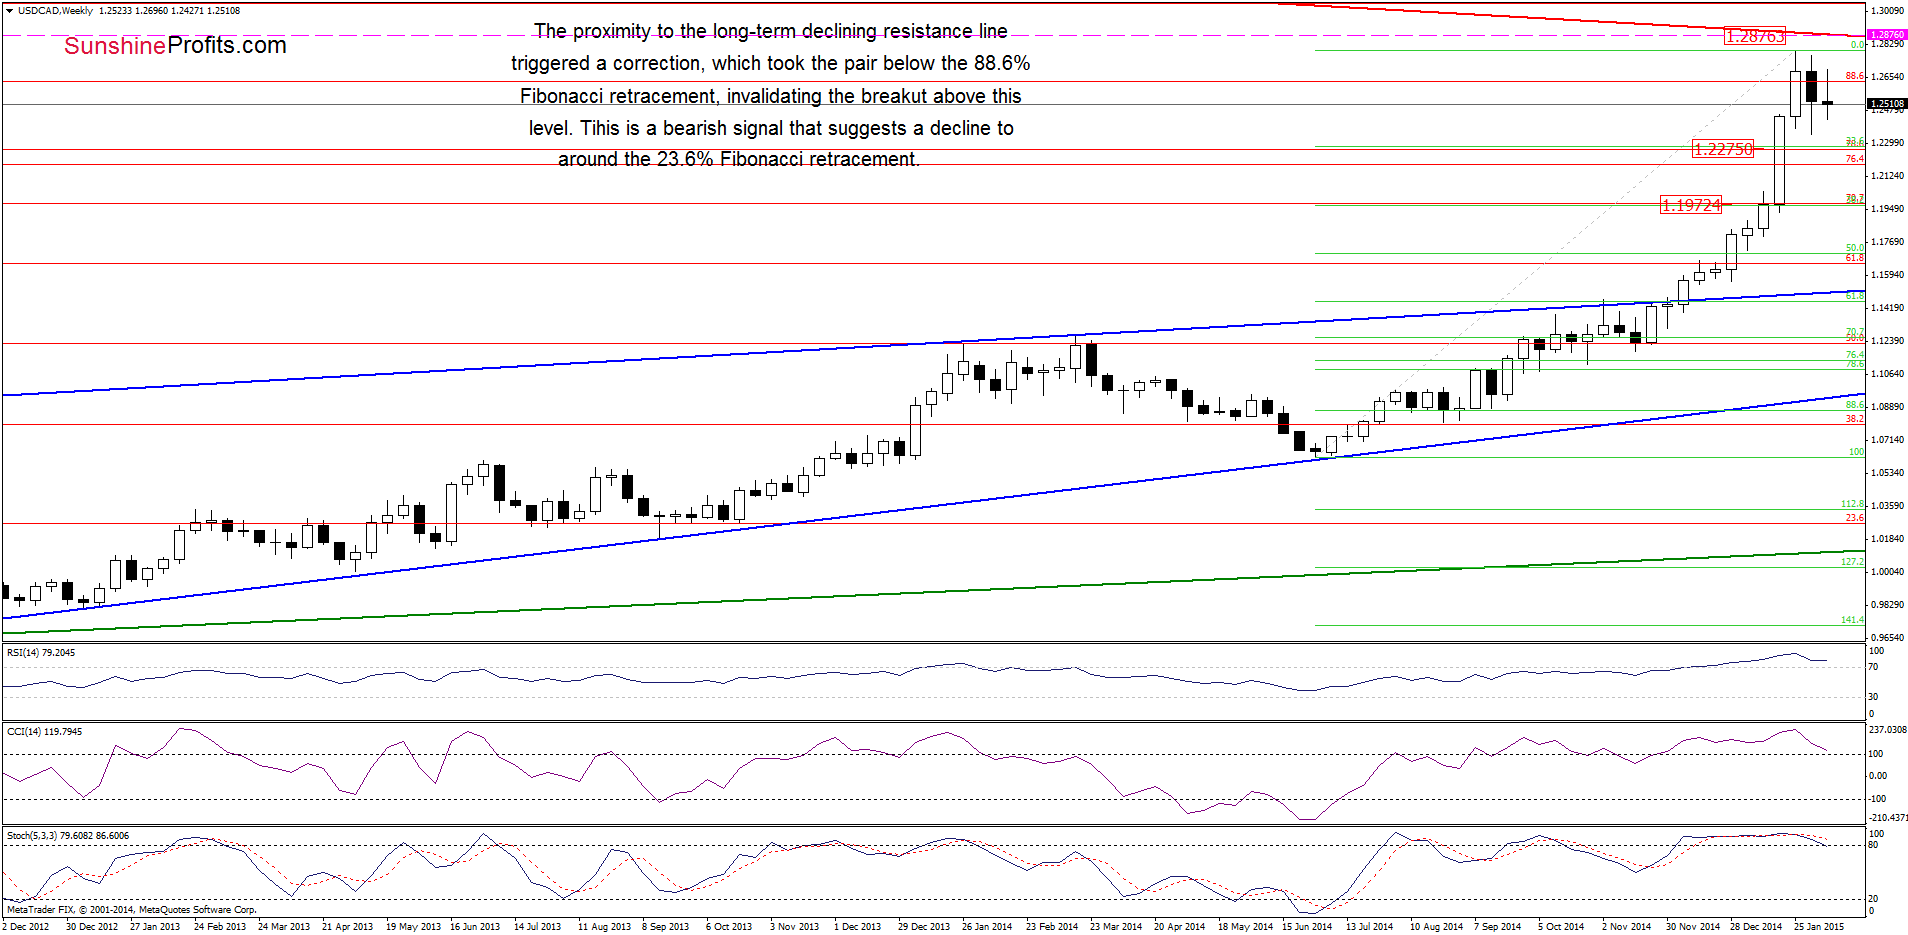
The situation in the medium-term hasn’t changed much as USD/CAD is still trading under the previously- broken 88.6% Fibonacci retracement and well below the long-term red declining resistance line. This is a bearish sign which suggests a drop to the 23.6% (around 1.2275) or even 38.2% (at 1.1973) Fibonacci retracement based on the entire Jun-Jan rally in the coming week.
What can we infer from the daily chart? Let’s check.
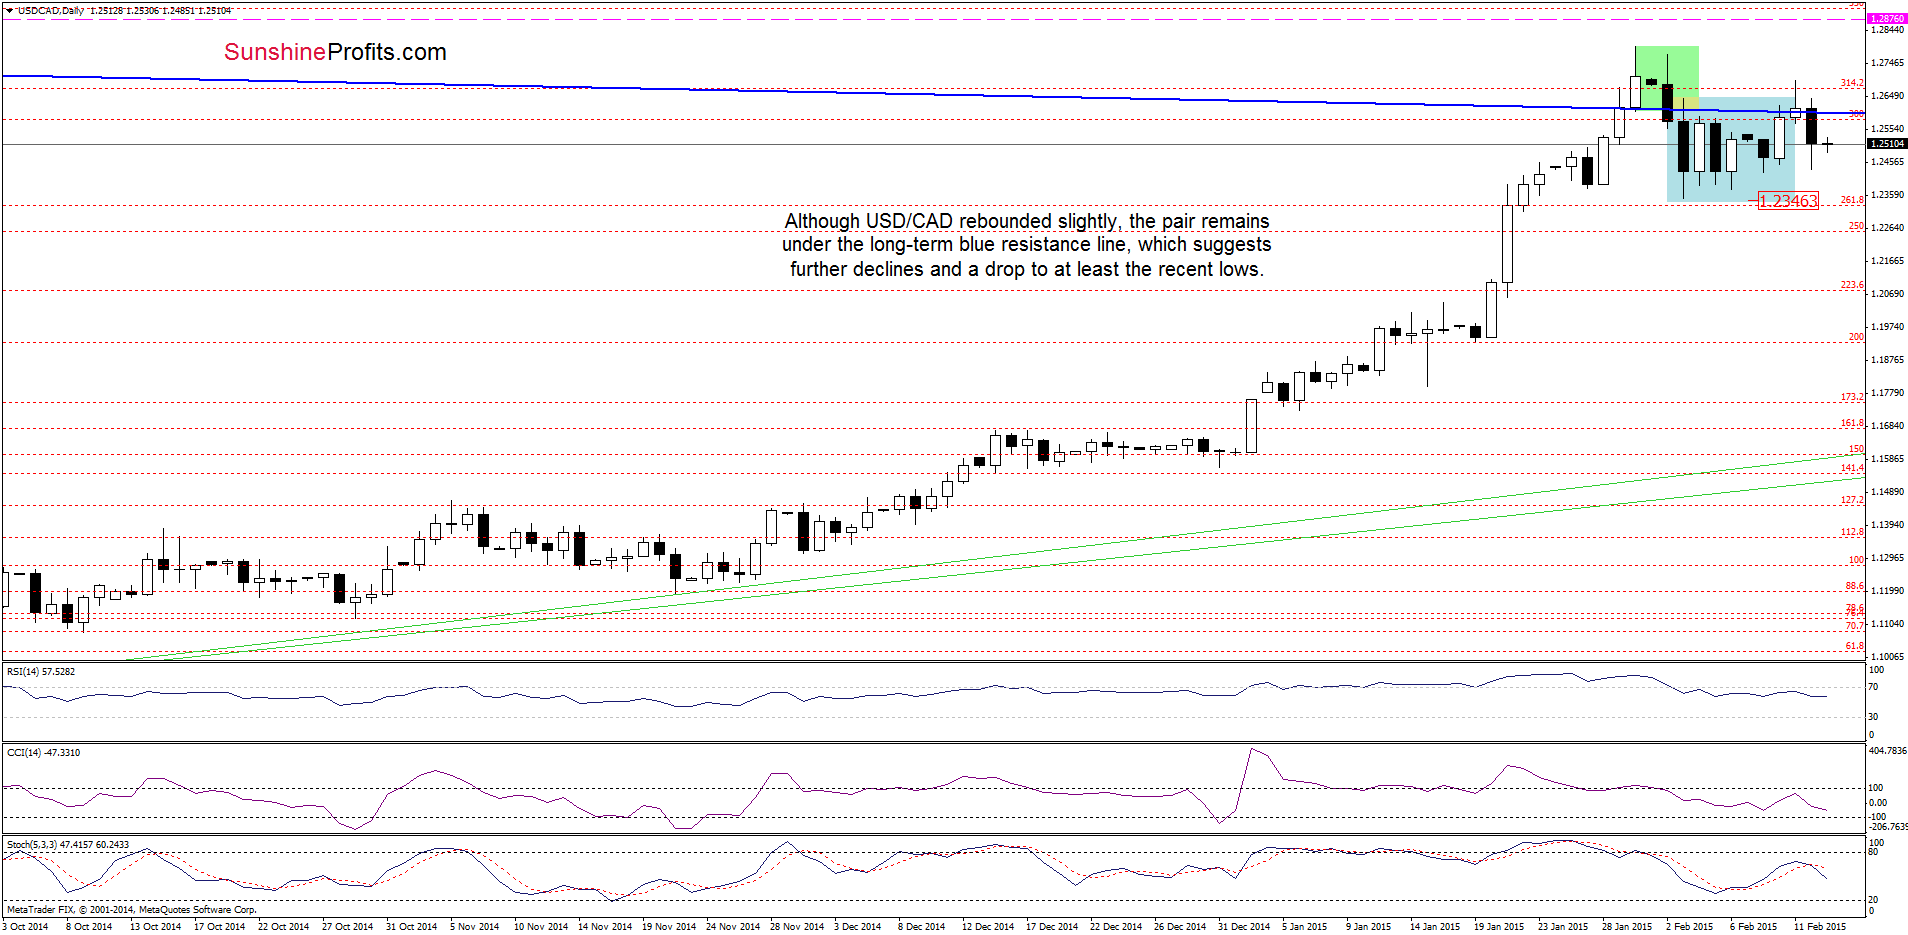
From this perspective, we see that although USD/CAD rebounded slightly, the pair is still trading under the long-term blue support/resistance line, which suggests further deterioration and a drop to at least the lower border of the consolidation (marked with blue) around 1.2350-1.2376. We think that this scenario will be even more likely if we see another daily close below the blue line.
Very short-term outlook: bearish
Short-term outlook: mixed with bearish bias
MT outlook: mixed
LT outlook: mixed
Trading position (short-term; our opinion): Short positions with a stop loss order at 1.2876 are justified from the risk/reward perspective at the moment. We will keep you informed should anything change, or should we see a confirmation/invalidation of the above.
USD/CHF
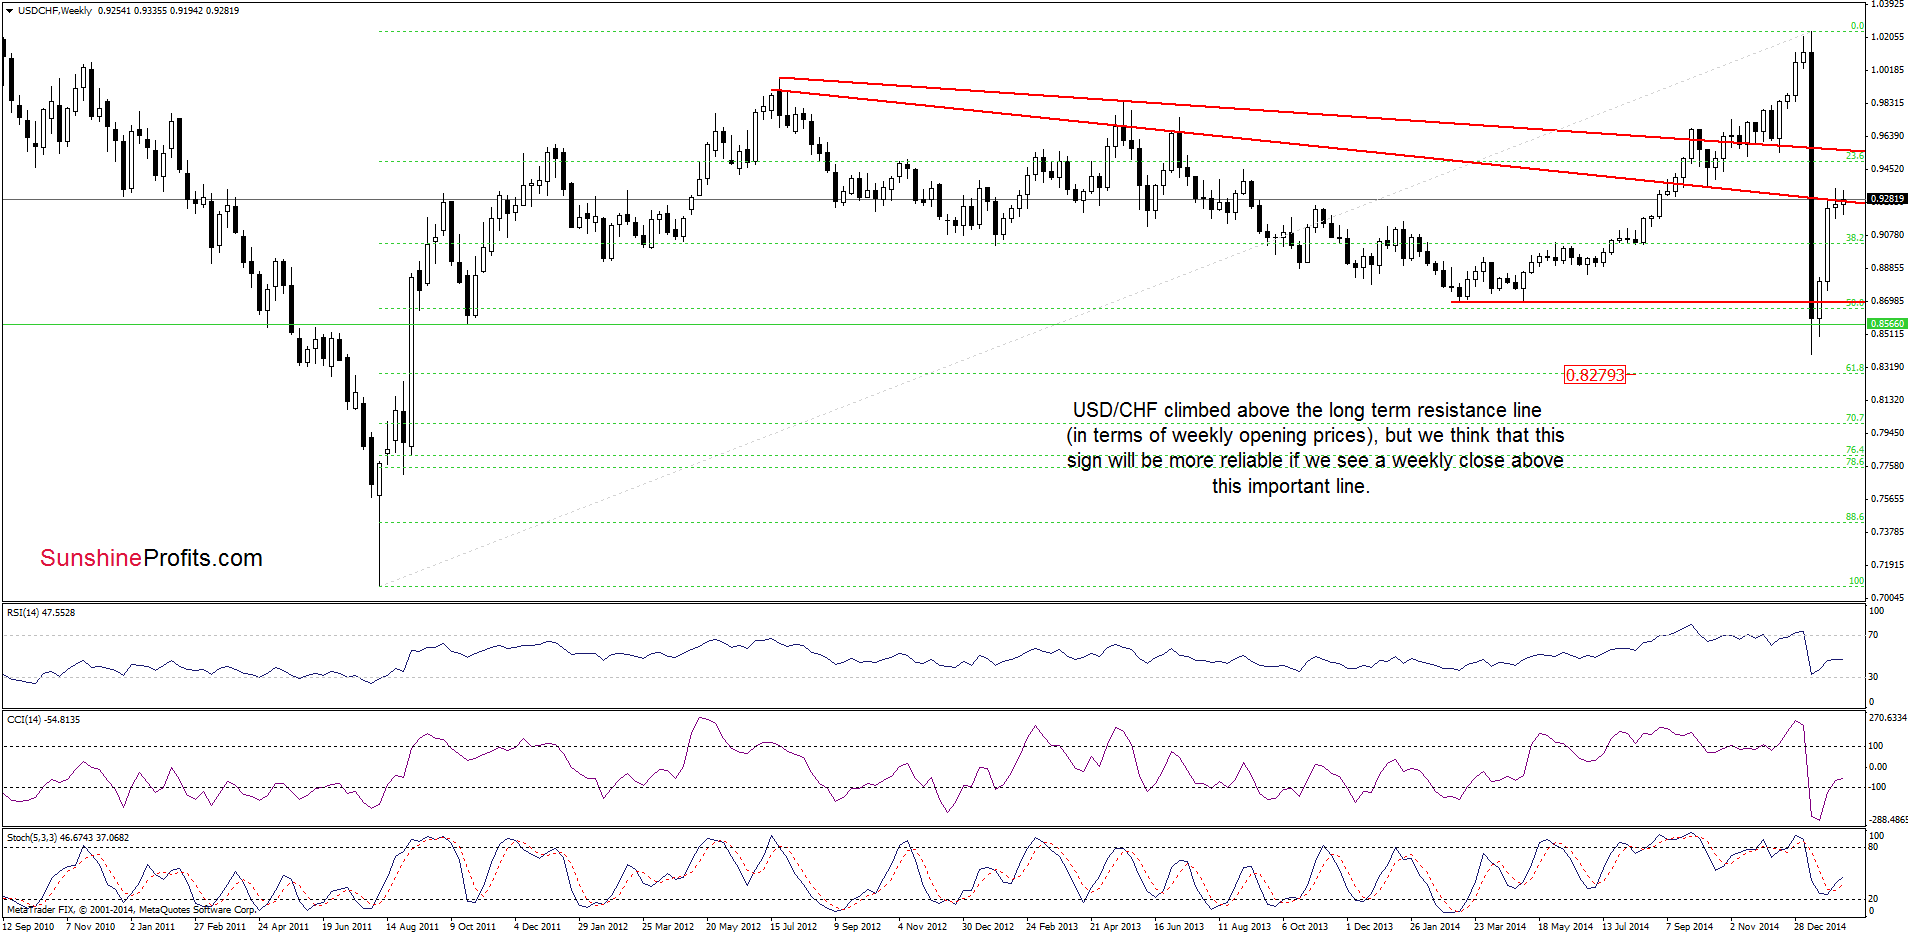
On the above chart, we see that the situation in the medium term has improved slightly as USD/CHF climbed above the long-term resistance line (in terms of weekly opening prices). Although this is a positive sign, the current increase above this important line is barely visible, which suggests that the breakout will be more reliable if we see a weekly close above this resistance. Meantime, let’s check the situation in the very short term.
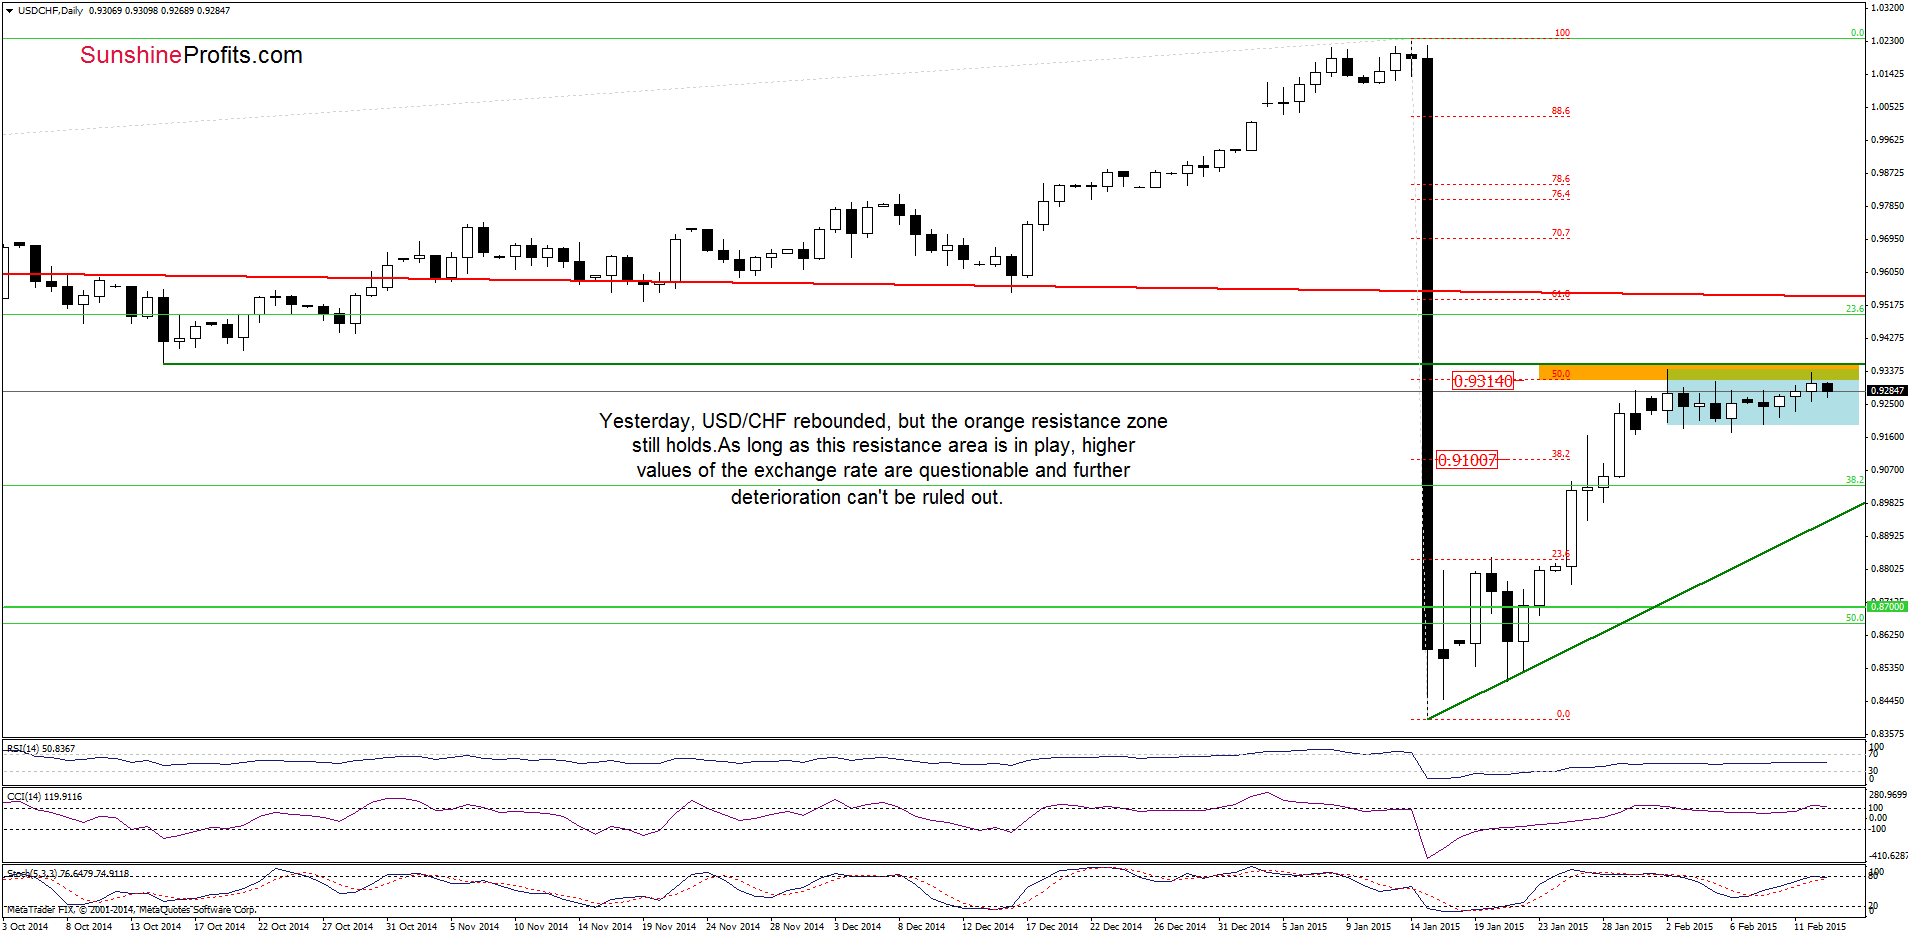
Looking at the daily chart, we see that the situation hasn’t changed much as USD/CHF still remains in a consolidation under the orange resistance zone (created by the 50% Fibonacci retracement and the Oct 2014 low). Therefore, what we wrote on Wednesday is still valid:
(…) we believe that as long as there is no breakout above these levels, higher values of the exchange rate are questionable and further deterioration can’t be ruled out (…)
Finishing today’s commentary on this currency pair, please note that the daily CCI and Stochastic Oscillator are overbought, which increases the probability of another pullback in the coming days.
Very short-term outlook: mixed with bearish bias
Short-term outlook: mixed
MT outlook: mixed
LT outlook: bearish
Trading position (short-term; our opinion): No positions are justified from the risk/reward perspective at the moment. We will keep you informed should anything change, or should we see a confirmation/invalidation of the above.
AUD/USD
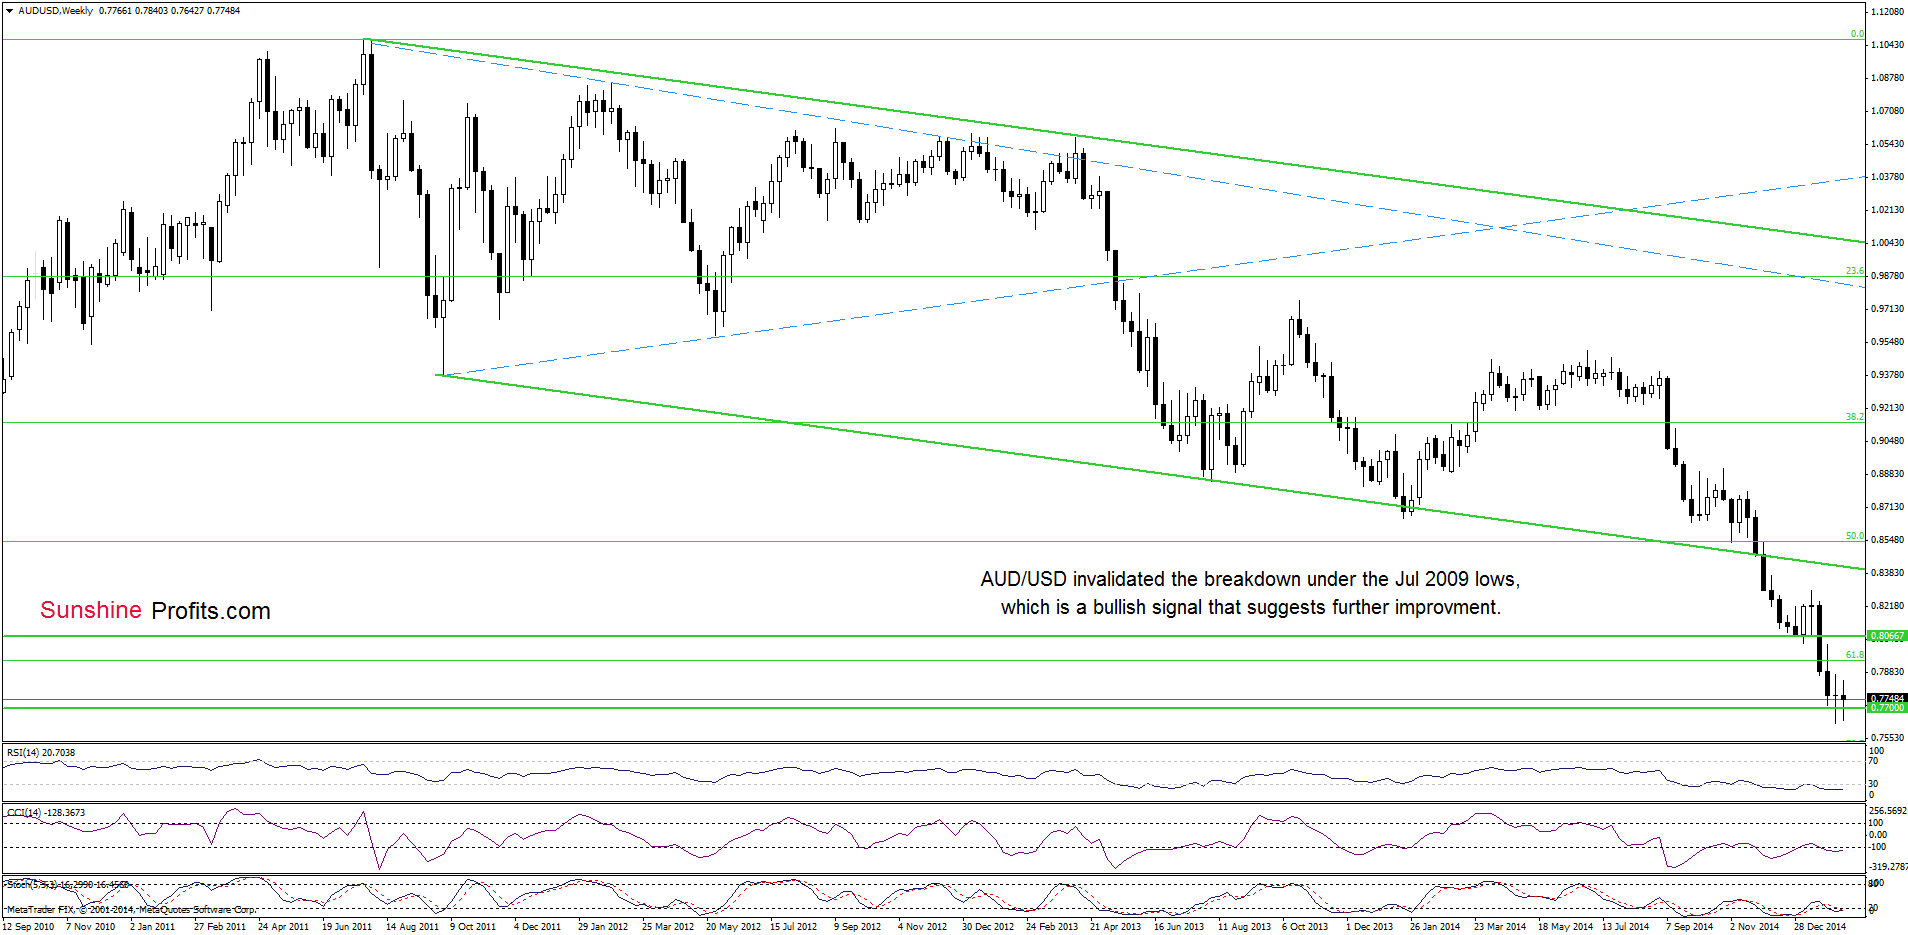
As you see on the weekly chart, an invalidation of the breakdown below the Jul 2009 lows and its potential positive impact on future moves is still in effect.
Having said that, let’s take a closer look at the daily chart.
Quoting our Tuesday’s Forex Trading Alert:
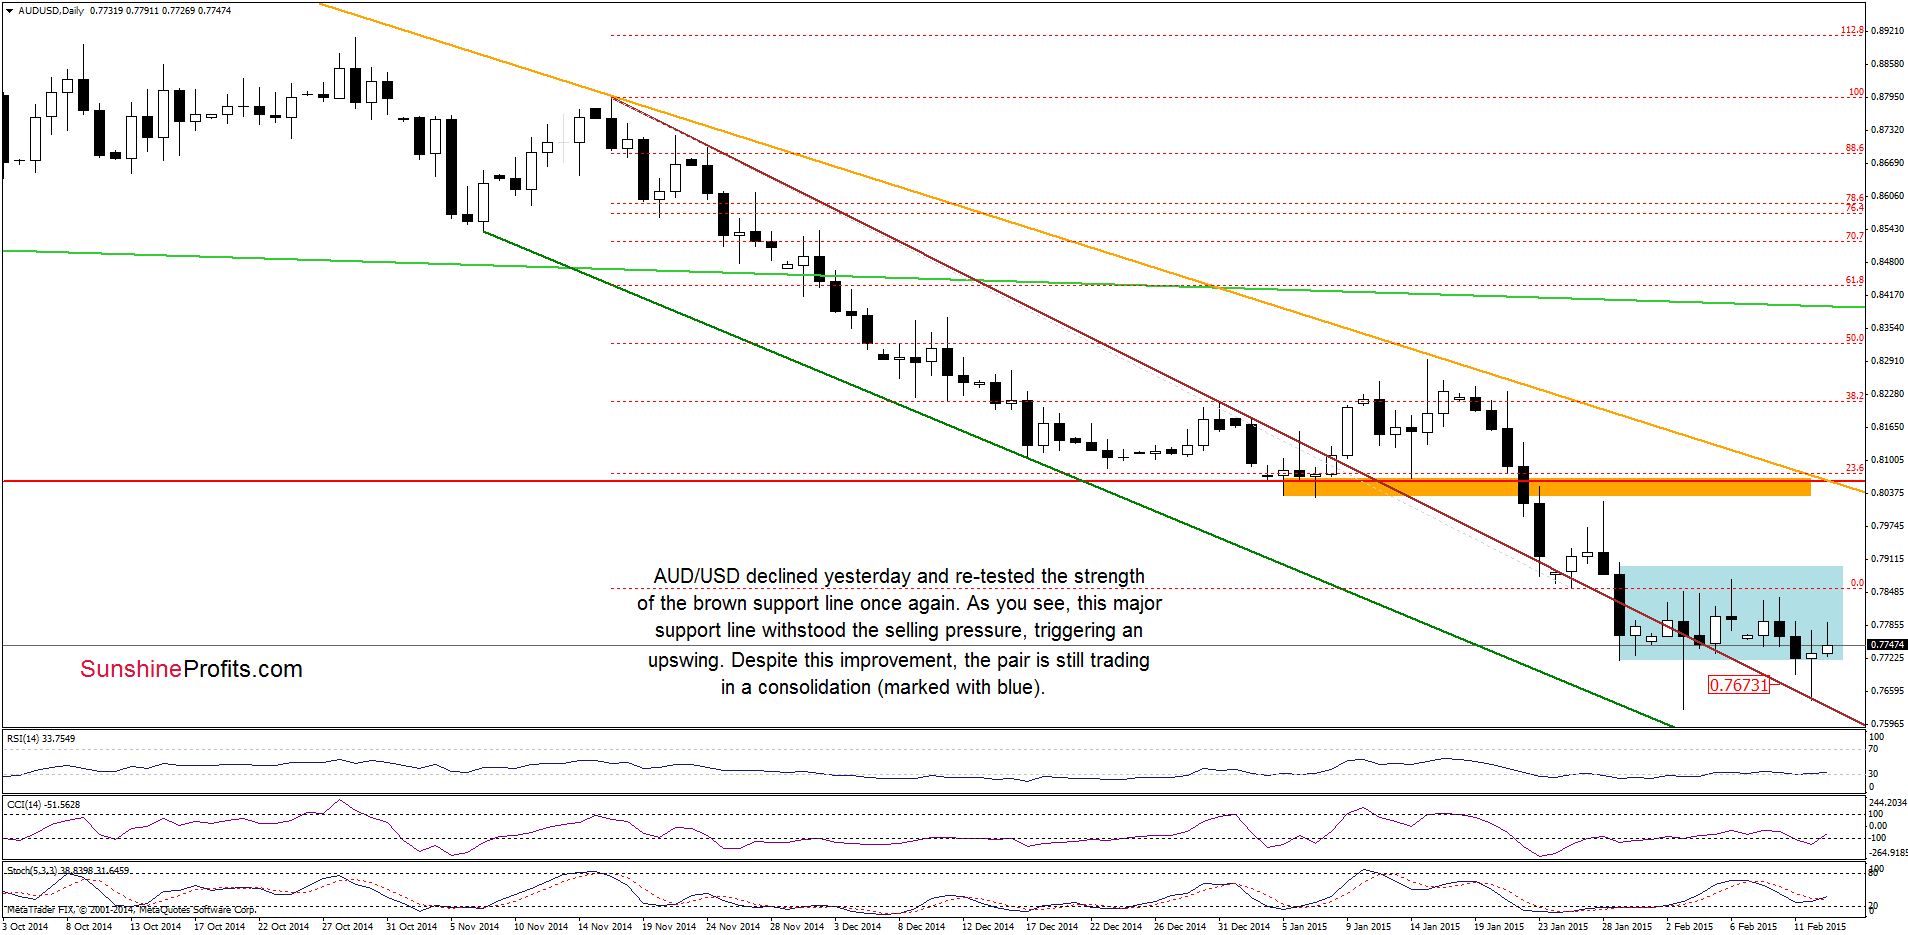
(…) if the exchange rate moves lower from here, AUD/USD will test the strength of the brown support line (…) once again. (…) Taking into account sell signal generated by the Stochastic Oscillator, it seems to us that we’ll see lower values of the exchange rate in the near future.
From today’s point of view, we see that currency bears push the pair lower as we expected and AUD/USD reached our downside target. As you see, this major support withstood the selling pressure and triggered an upswing. Despite this improvement, the pair is still trading in a consolidation. However, taking the above into account, and combining it with buy signals we think that the exchange rate will move higher in the coming days. If this is the case, the initial upside target would be the upper line of the formation around 0.7905.
Very short-term outlook: mixed with bullish bias
Short-term outlook: mixed
MT outlook: mixed
LT outlook: mixed
Trading position (short-term; our opinion): No positions are justified from the risk/reward perspective at the moment. We will keep you informed should anything change, or should we see a confirmation/invalidation of the above.
Thank you.
Nadia Simmons
Forex & Oil Trading Strategist
Przemyslaw Radomski, CFA
Founder, Editor-in-chief
Gold & Silver Trading Alerts
Forex Trading Alerts
Oil Investment Updates
Oil Trading Alerts

