
Earlier today, the U.S. Commerce Department showed that retail sales dropped by 0.8% in Jan (missing expectations for a decline of 0.5%), while core retail sales (without automobile sales) decreased by 0.9% in December, disappointing forecasts for a 0.4% drop). On top of that, the U.S. Department of Labor reported that the number of initial jobless claims in the week ending February 7 increased by 25,000 missing analysts’ expectations for a 6,000 increase. In response to these disappointing numbers, the U.S. dollar moved lower against its Canadian counterpart, which resulted in a breakdown under the long-term support/resistance line. Will we see a sizable downward move?
In our opinion the following forex trading positions are justified - summary:
- EUR/USD: long (stop loss order at 1.1056)
- GBP/USD: none
- USD/JPY: none
- USD/CAD: short (stop loss order at 1.2876)
- USD/CHF: none
- AUD/USD: none
EUR/USD
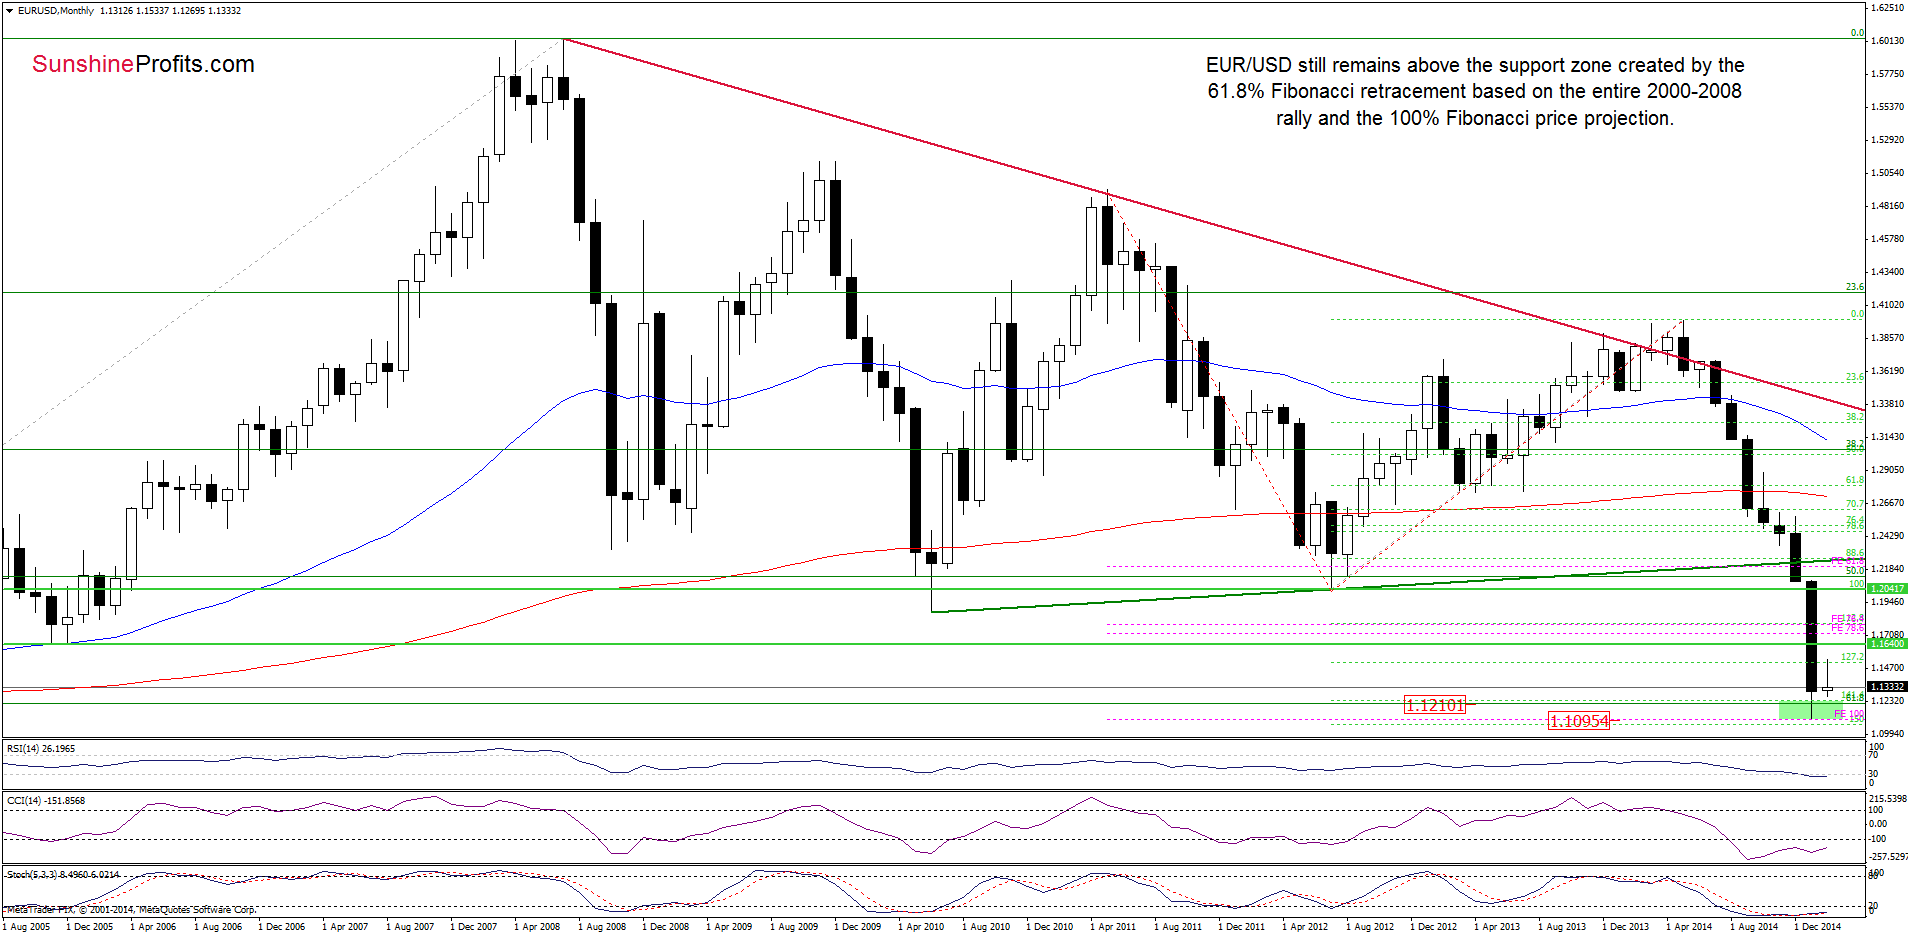
The medium-term picture hasn’t changed much as and invalidation of the breakdown below the 61.8% Fibonacci retracement and its potential positive impact on the exchange rate are still in effect. Having said that, let’s focus on the daily chart.
Looking at the above chart, we see that the situation has improved slightly as EUR/USD moved little higher and came back to the consolidation range. In this way, the exchange rate invalidated the breakdown below the lower line of the formation, which is a positive signal that suggests further improvement (especially when we take into account a buy signal generated by the Stochastic Oscillator). Nevertheless, we think that this scenario will be more likely if we see a daily close above 1.1312. If this is the case, the initial upside target for currency bulls would be the upper border of the consolidation around 1.1533.
Very short-term outlook: bullish
Short-term outlook: mixed
MT outlook: mixed
LT outlook: mixed
Trading position (short-term): Long positions with a stop loss order at 1.1056 are justified from the risk/reward perspective at the moment. We will keep you informed should anything change, or should we see a confirmation/invalidation of the above.
USD/JPY
Quoting our last commentary on this currency pair:
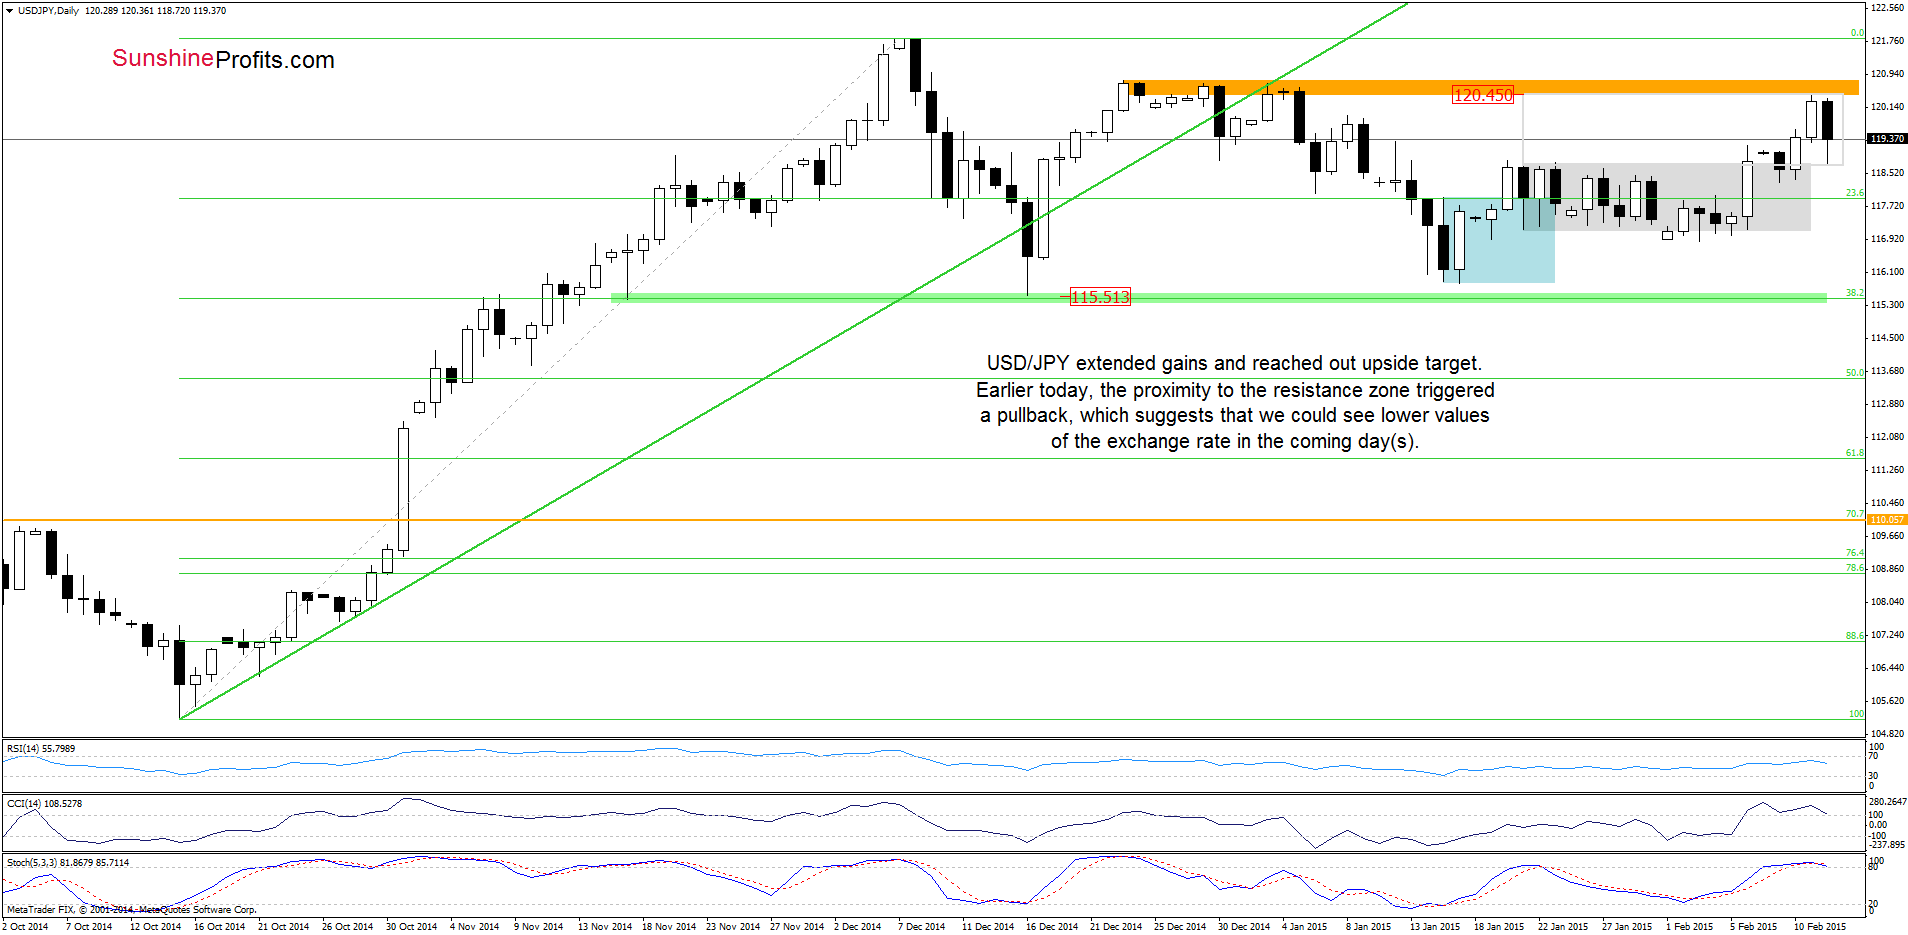
(…) the pair reversed and climbed above the upper line of the consolidation (marked with grey) once again (…) This is a positive sign, which suggests further improvement and an increase to around 120.45, where the size of the upswing will corresponds to the height of the formation.
Yesterday, USD/JPY extended gains and reached our upside target. With this move, the pair also approached the orange resistance zone created by the Dec and Jan highs, which triggered a pullback earlier today. In our opinion, as long as there is no breakout above this key resistance zone, further rally is not likely to be seen. The reason? Let’s take a closer look at the monthly chart and find out.
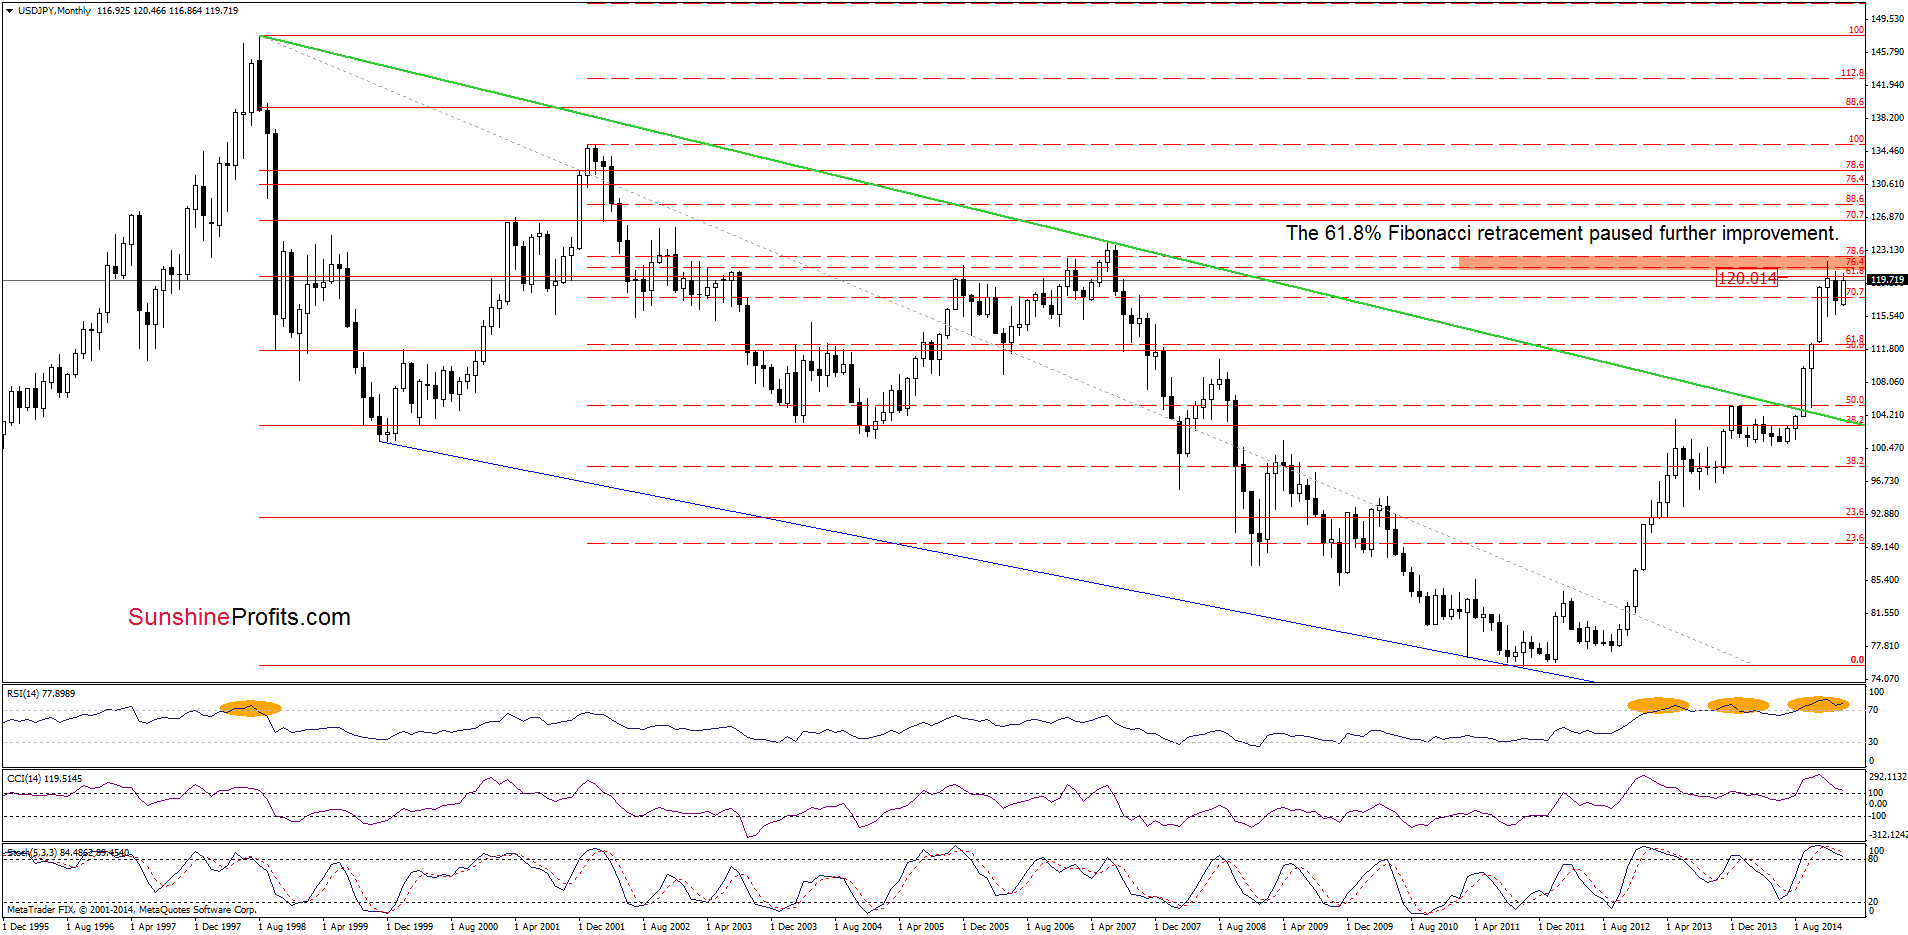
From this perspective, we see that the above-mentioned orange resistance zone is reinforced by the 61.8% Fibonacci retracement level based on the entire 1998-2011 declines. Therefore, as long as this resistance is in play, we won’t see higher values of the exchange rate and further deterioration is likely. Please not that this scenario is currently reinforced by the daily (and also monthly) CCI and Stochastic Oscillator, which are overbought and very close to generate sell signals. Taking all the above into account, we think that the next move will be to the downside. If this is the case, the initial downside target would be around 118.75.
Very short-term outlook: mixed with bearish bias
Short-term outlook: mixed
MT outlook: mixed
LT outlook: bullish
Trading position (short-term; our opinion): No positions are justified from the risk/reward perspective at the moment. We will keep you informed should anything change, or should we see a confirmation/invalidation of the above.
USD/CAD
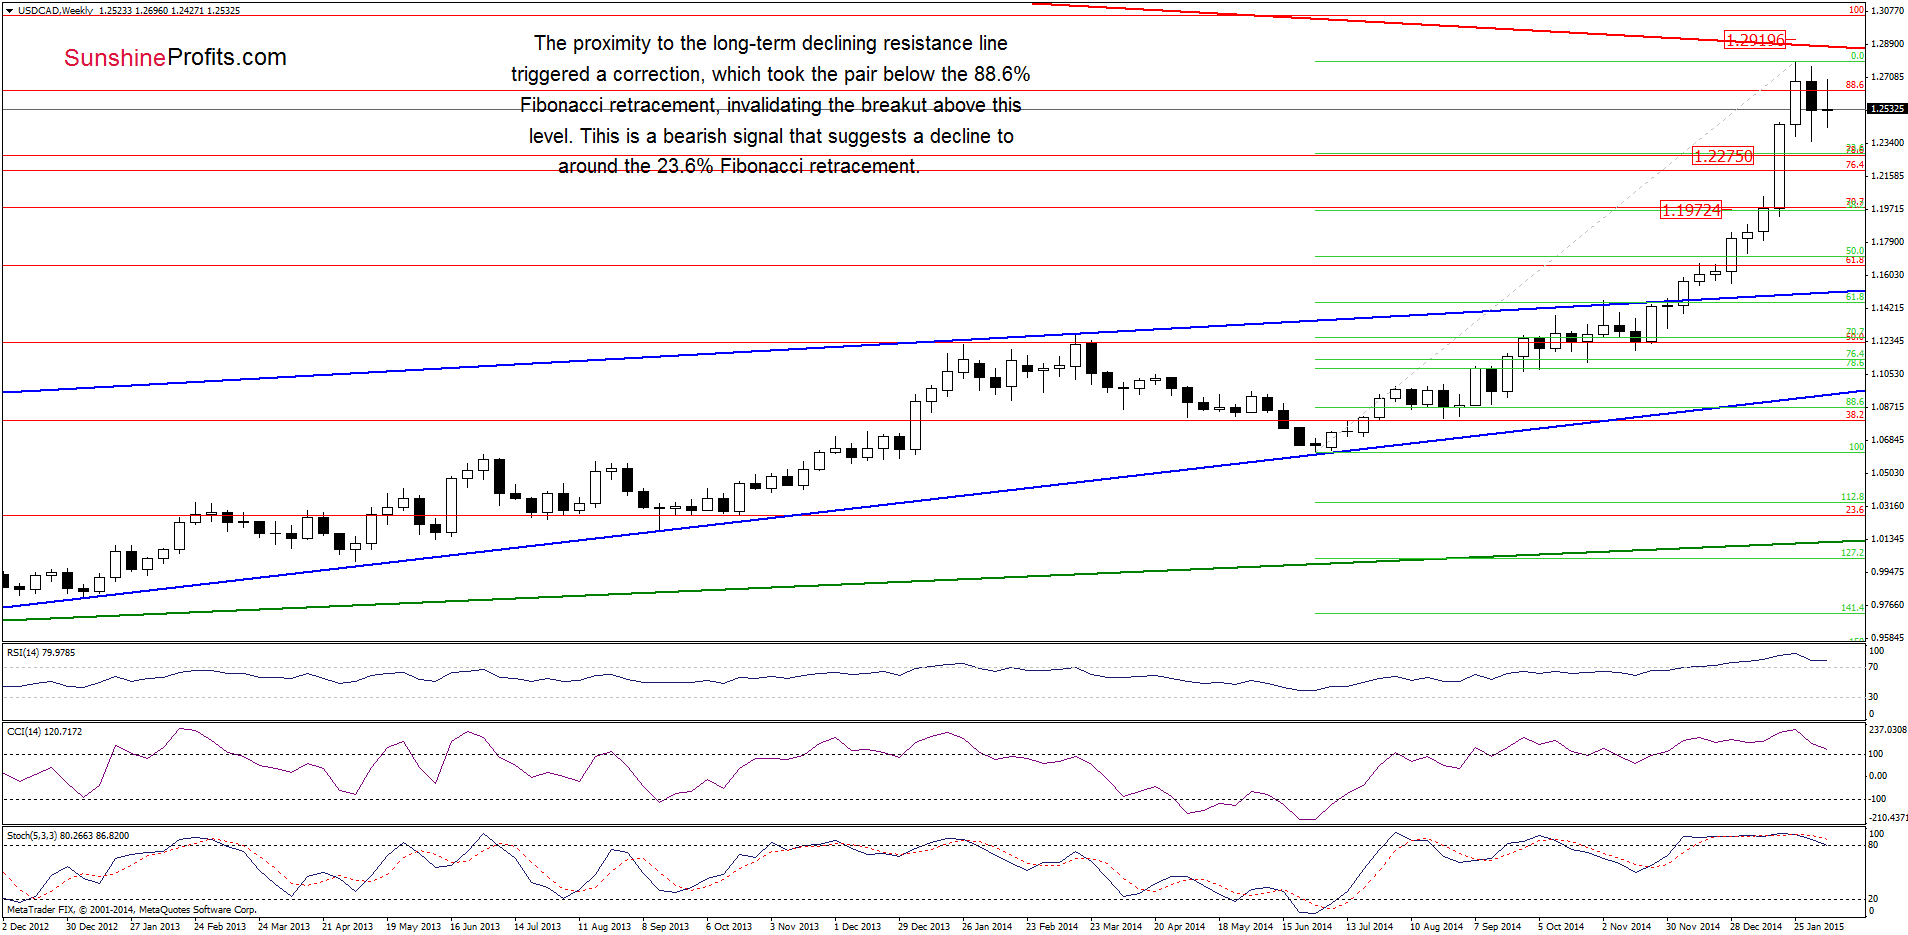
The situation in the medium-term hasn’t changed much as USD/CAD is still trading under the previously- broken 88.6% Fibonacci retracement and well below the long-term red declining resistance line. This is a bearish sign which suggests a drop to the 23.6% (around 1.2275) or even 38.2% (at 1.1973) Fibonacci retracement based on the entire Jun-Jan rally in the coming week.
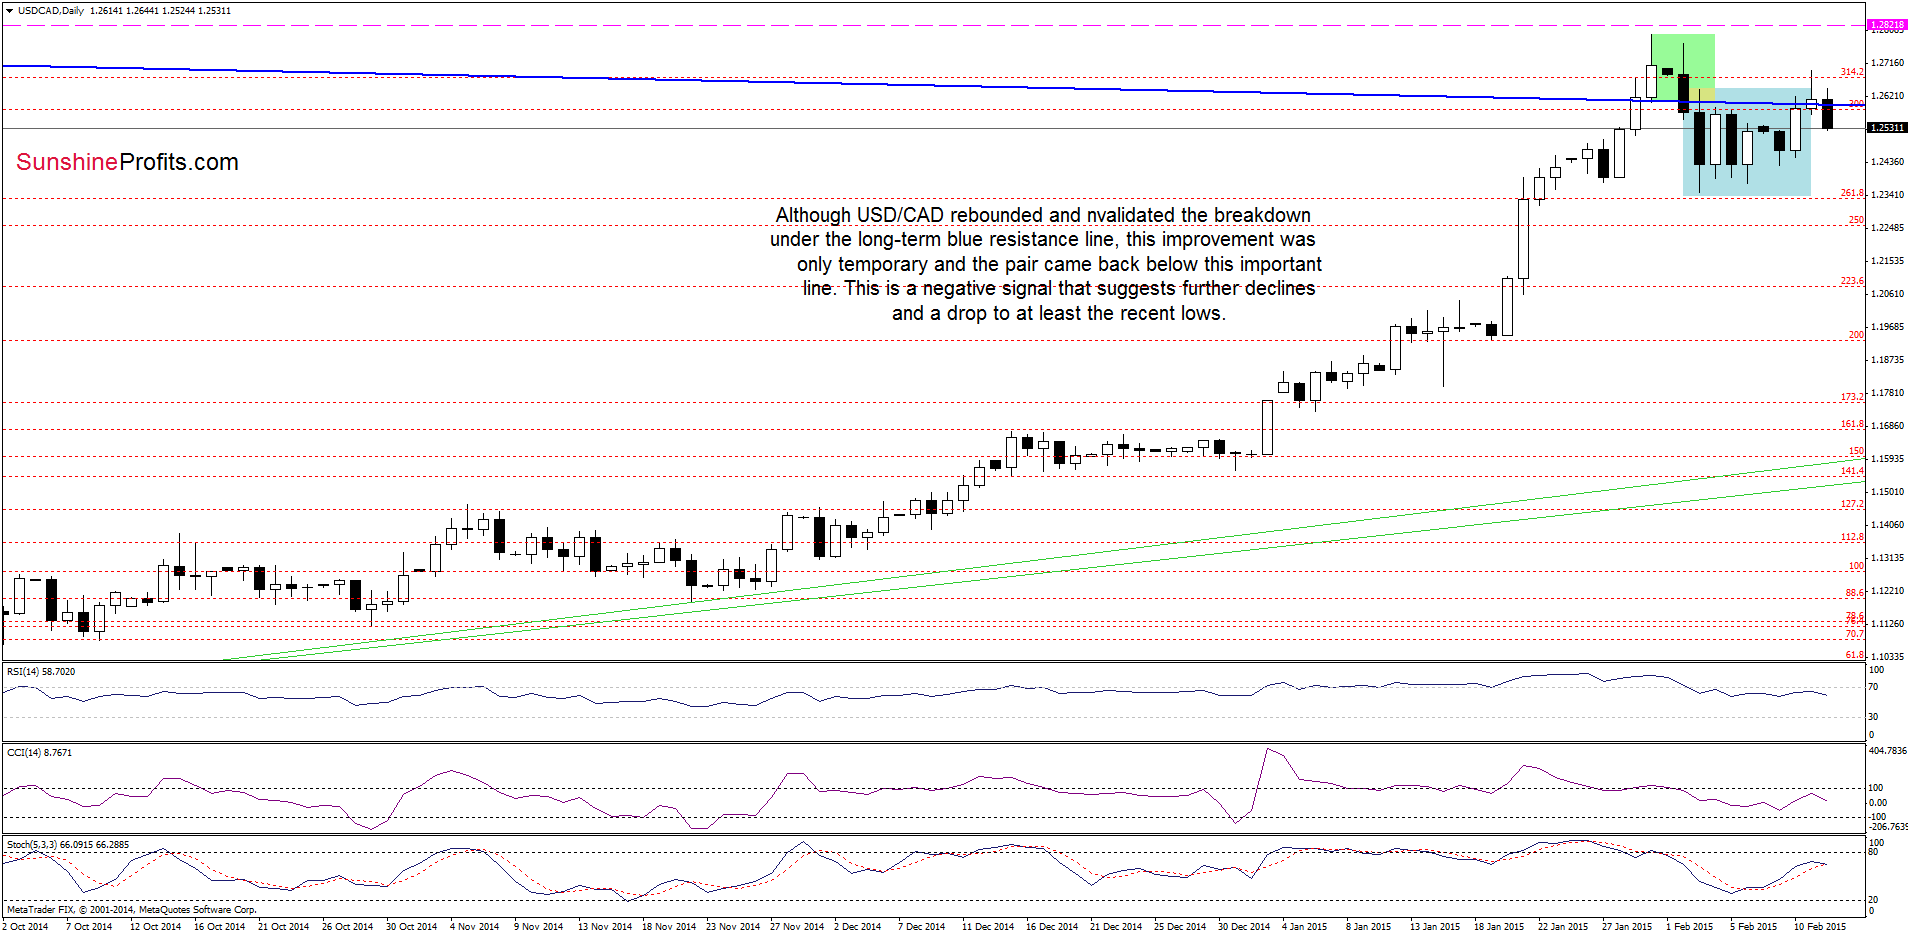
What can we infer from the daily chart? Let’s check.
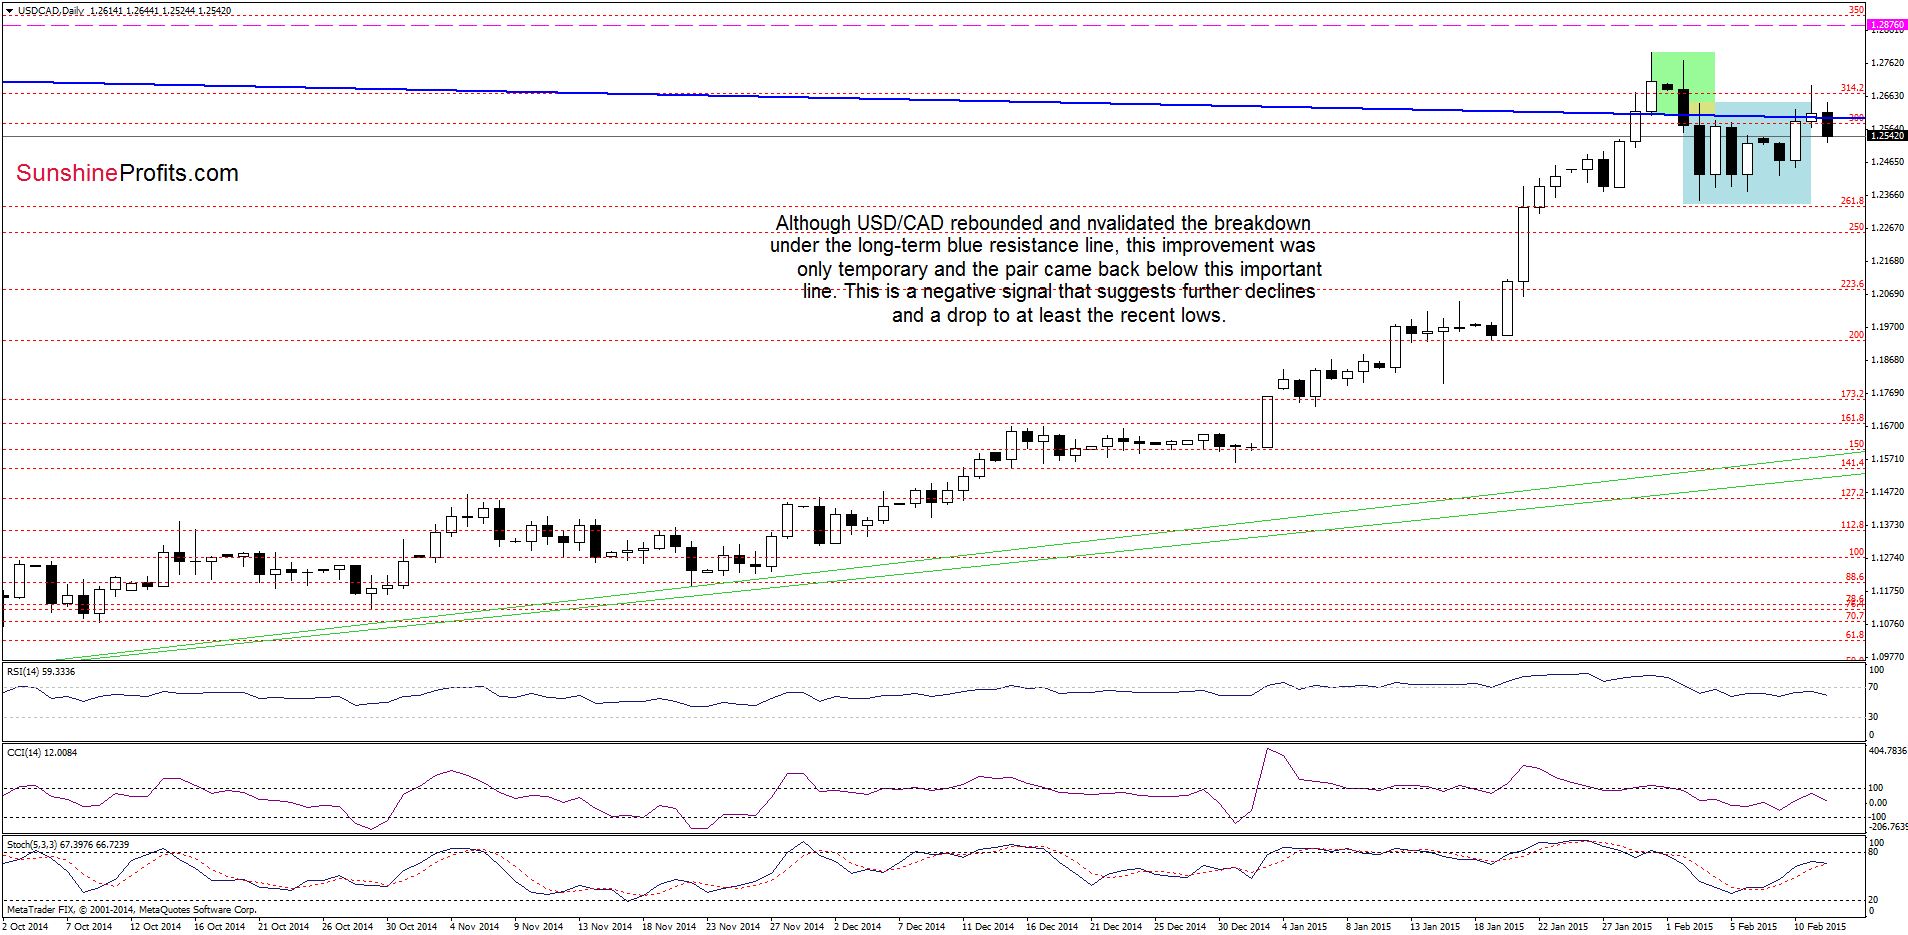
Although USD/CAD moved higher and climbed above the long-term blue support/resistance line yesterday, this improvement was only temporary and currency bulls didn’t manage to hold gained levels. As a result, the exchange rate declined under this major support/resistance line once again, which suggests further deterioration and a drop to a least the lower border of the consolidation (marked with blue) around 1.2350-1.2376. Nevertheless, we think that this scenario will be even more likely if we see a daily close below the blue line.
Very short-term outlook: mixed with bearish bias
Short-term outlook: mixed
MT outlook: mixed
LT outlook: mixed
Trading position (short-term; our opinion): Short positions with a stop loss order at 1.2876 are justified from the risk/reward perspective at the moment (if your positions were closed by the previous stop loss order, we suggest re-opening them). We will keep you informed should anything change, or should we see a confirmation/invalidation of the above.
Thank you.
Nadia Simmons
Forex & Oil Trading Strategist
Przemyslaw Radomski, CFA
Founder, Editor-in-chief
Gold & Silver Trading Alerts
Forex Trading Alerts
Oil Investment Updates
Oil Trading Alerts

