
Earlier today, the Swiss franc extended losses against the U.S. dollar as rising expectations for further intervention by the Swiss National Bank in the market to prevent the appreciation of the currency weighed on the USD/CHF pair. As a result, the exchange rate broke above an mportant Fibonacci retracement, which suggests further rally. How high could the pair go?
In our opinion the following forex trading positions are justified - summary:
EUR/USD
The medium-term picture hasn’t changed much as and invalidation of the breakdown below the 61.8% Fibonacci retracement and its positive impact on the exchange rate are still in effect. Having said that, let’s focus on the daily chart.
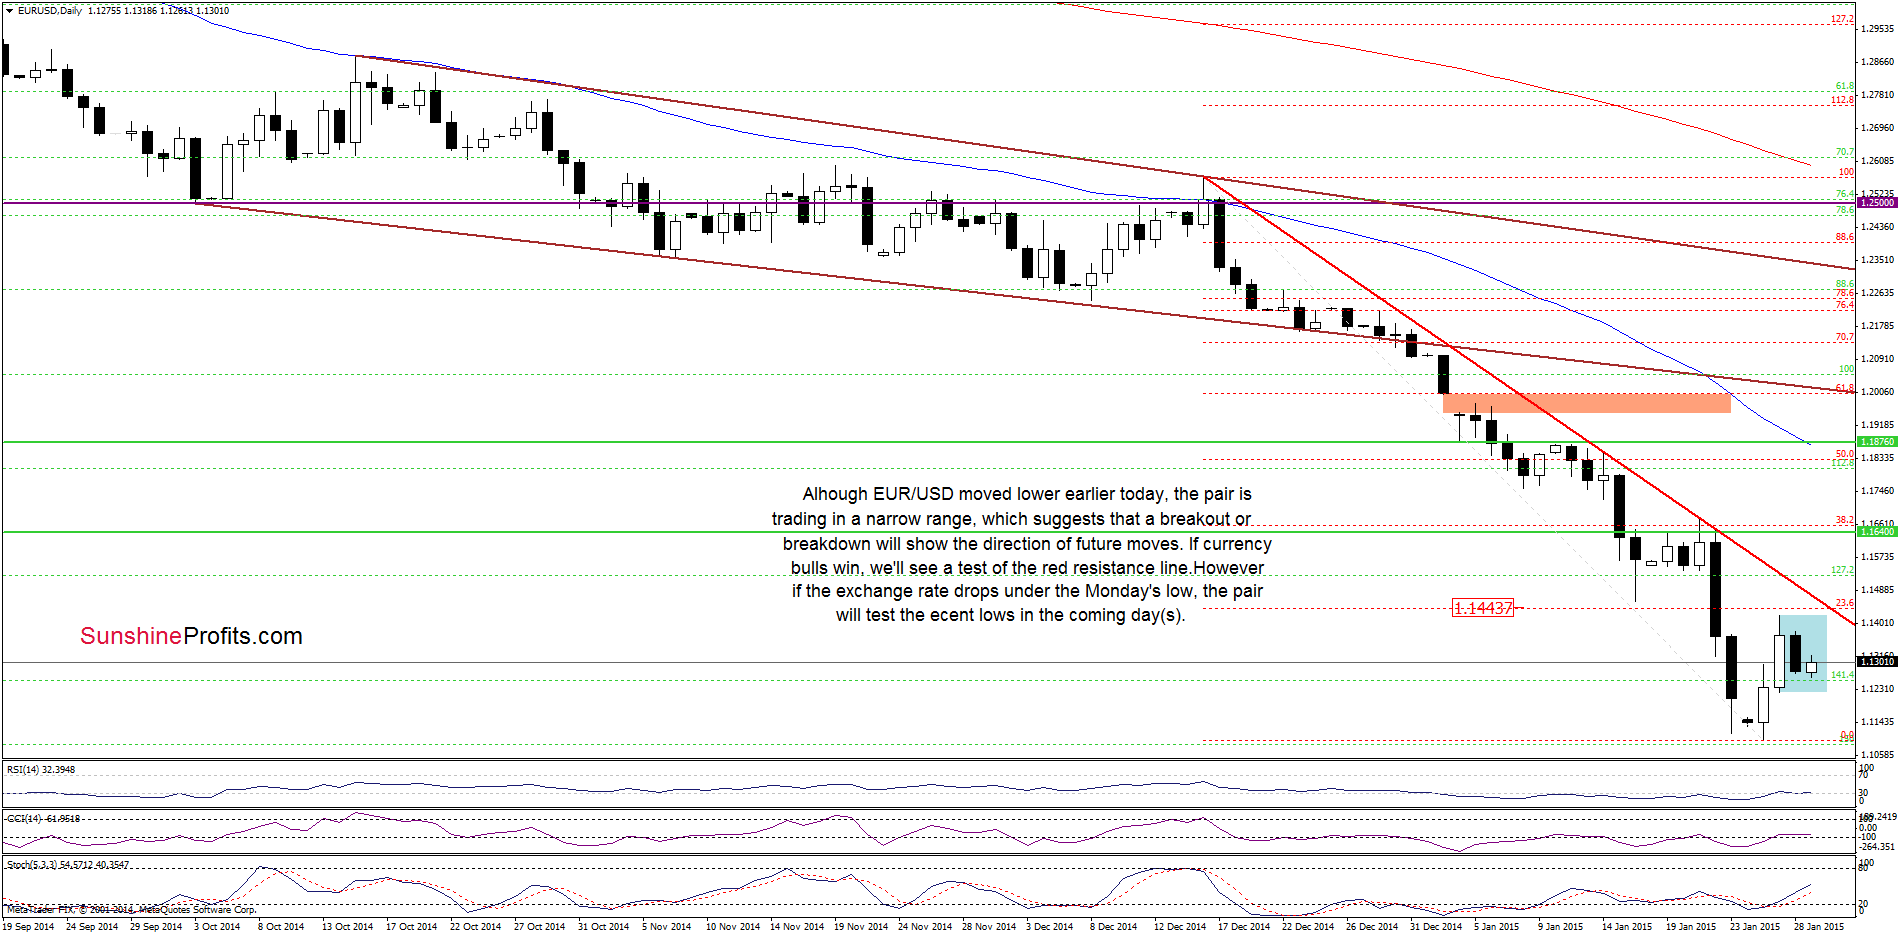
On the above chart, we see that although EUR/USD moved little lower, the pair is trading in a narrow range between Monday’s high and low, which suggests that a breakout/breakdown will show the direction of future moves. If currency bulls win, we’ll see a test of the 23.6% Fibonacci retracement (based on the Dec 16-Jan 26 declines) and the red declining line (based on the Dec 16 and Jan 14 highs). On the other hand, if the exchange rate drops under 1.1223, the pair will likely test the recent lows in the coming day(s). Which scenario is more likely? As you see on the daily chart, buy signals generated by the indicators still support the bullish case. Nevertheless, we should keep in mind what we wrote in our previous Forex Trading Alert:
(…) the red declining line based on the Dec 16 and Jan 14 highs (…) successfully stopped further improvement in the previous week, which suggests that we could see a similar price action (a pullback) in the near future.
Taking all the above into account, we think that the situation is too unclear to make any investment decision at the moment. However, if currency bulls manage to push the exchange rate above the nearest resistance area, we’ll consider opening long positions, because such price action would be a solid positive signal that will trigger an increase to around 1.1640, where the next resistance zone (created by the last week’s high and the previously-broken Nov 2005 low) is.
Very short-term outlook: mixed
Short-term outlook: mixed
MT outlook: mixed
LT outlook: mixed
Trading position (short-term): In our opinion, no positions are justified from the risk/reward perspective at the moment. However, if we see a successful breakout above the red declining line based on the Dec 16 and Jan 14 highs, we’ll consider opening long positions. We will keep you informed should anything change, or should we see a confirmation/invalidation of the above.
GBP/USD
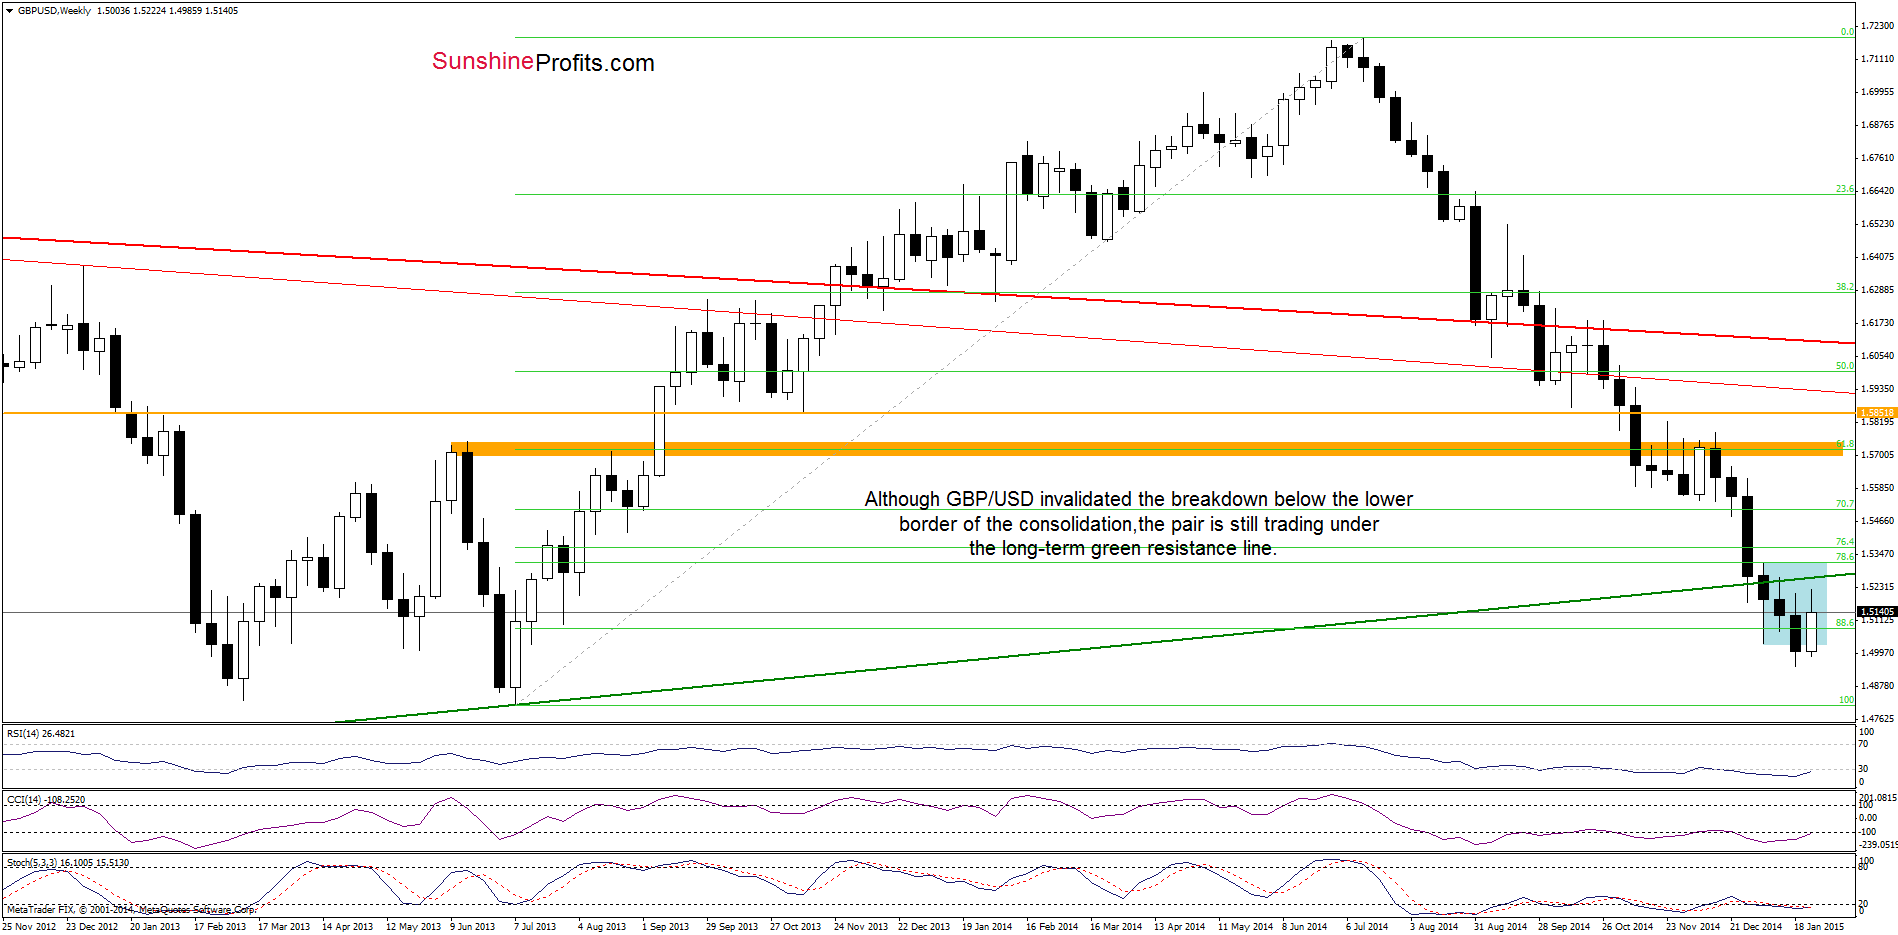
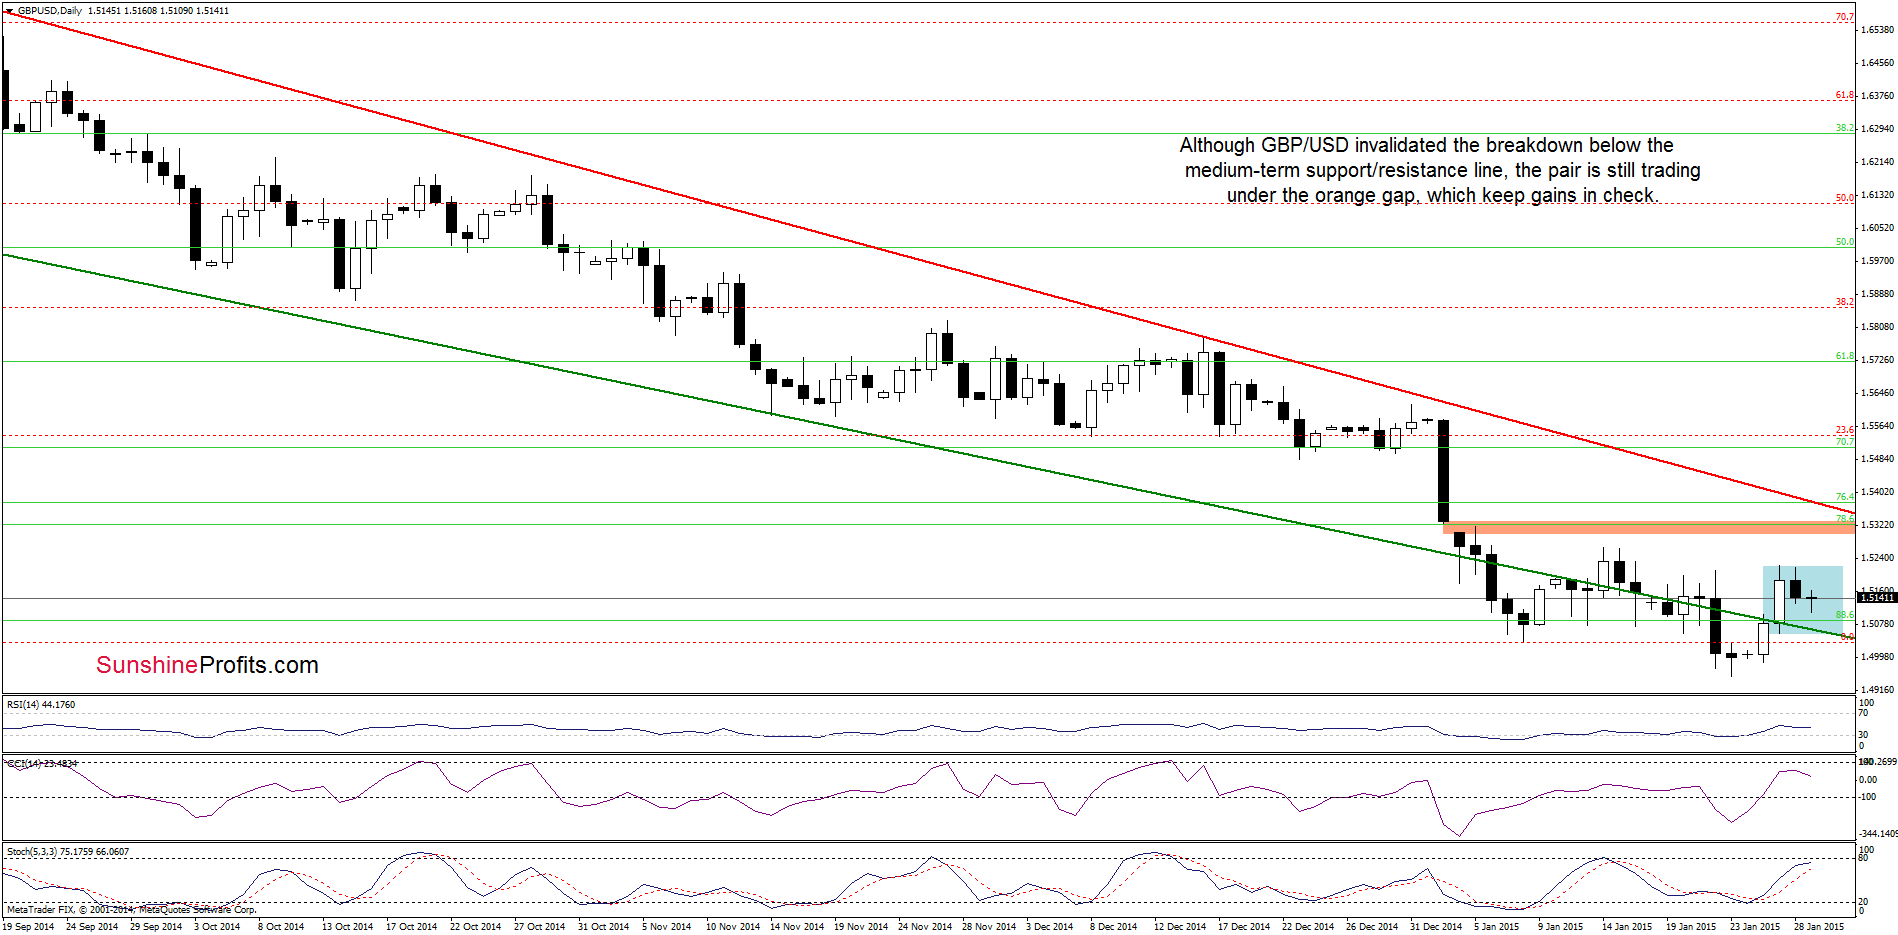
Looking at the above charts, we see that although GBP/USD moved sharply higher earlier this week, invalidating the breakdown below the lower border of the consolidation (marked with blue on the weekly chart) and the breakdown under the medium-term green support/resistance line, the pair reversed and declined slightly – similarly to what we saw in the previous weeks. Taking this fact into account, we believe that our last commentary on this currency pair is up-to-date:
(…) In all previous cases, currency bulls weren’t strong enough to push the pair higher, which triggered pullbacks. Taking this fact into account, and combining it with the medium-term picture, we think that as long as the exchange rate remains under the long-term resistance line (marked on the weekly chart) and the gap between the Jan 2 low and Jan 4 high is open further rally is questionable and another pullback to the medium-term green support/resistance line in the coming days is likely.
Very short-term outlook: mixed
Short-term outlook: mixed
MT outlook: mixed
LT outlook: mixed
Trading position (short-term): In our opinion, no positions are justified from the risk/reward perspective at the moment. We will keep you informed should anything change, or should we see a confirmation/invalidation of the above.
USD/CHF
The situation in the medium-term has’t changed much as an invalidation of the breakdown below the Mar 2014 lows and its postive impact on cutent moves is still in play. Today’s we’ll take a closer look at te daily chart.
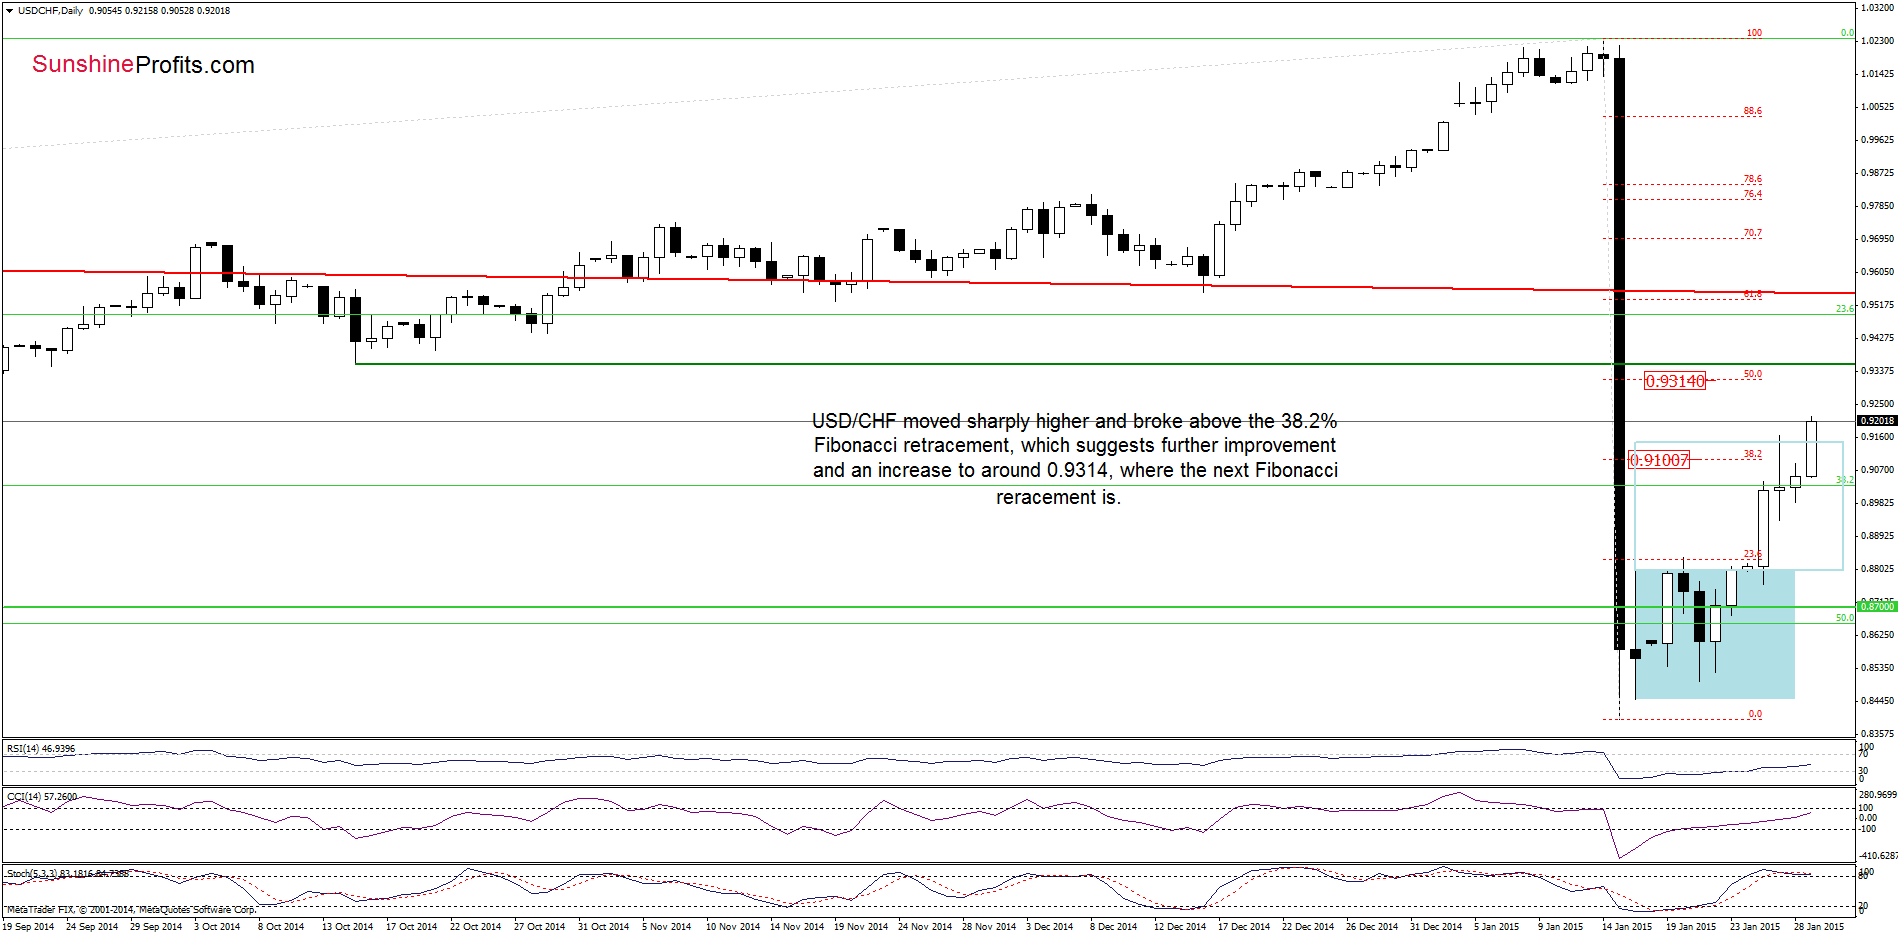
Quoting our Forex Trading Alert posted on Friday:
(…) USD/CHF is still trading in a consolidation under the 23.6% Fibonacci retracement (based on the recent decline). Therefore, a breakout above this resistance and the upper line f the formation will be a bullish signal, which would trigger an increase to at least 0.9100, where the 38.2% Fibonacci retracement is. At this point, it’s worth noting that all indicators generated buy signals, supporting the bullish case at the moment.
As you see on the daily chart, currency bulls not only realized the above-mentioned scenario as we expected, but also managed to push the pair above the 38.2% Fibonacci retracement. This is another positive signal that suggests further improvement and an increase to at least 0.9314, where the next Fibonacci retracement is. If this resistance level is broken, USD/CHF might increase even to the previously-broken long-term red, declining resistance line in the coming days.
Very short-term outlook: bullish
Short-term outlook: mixed
MT outlook: mixed
LT outlook: bearish
Trading position (short-term; our opinion): No positions are justified from the risk/reward perspective at the moment. We will keep you informed should anything change, or should we see a confirmation/invalidation of the above.
Thank you.
Nadia Simmons
Forex & Oil Trading Strategist
Przemyslaw Radomski, CFA
Founder, Editor-in-chief
Gold & Silver Trading Alerts
Forex Trading Alerts
Oil Investment Updates
Oil Trading Alerts

