
Yesterday, the U.S. dollar moved lower against its Canadian counterpart after the release of disappointing report on U.S. durable goods orders, but did this pullback change the short-term picture of the USD/CAD pair?
In our opinion the following forex trading positions are justified - summary:
EUR/USD
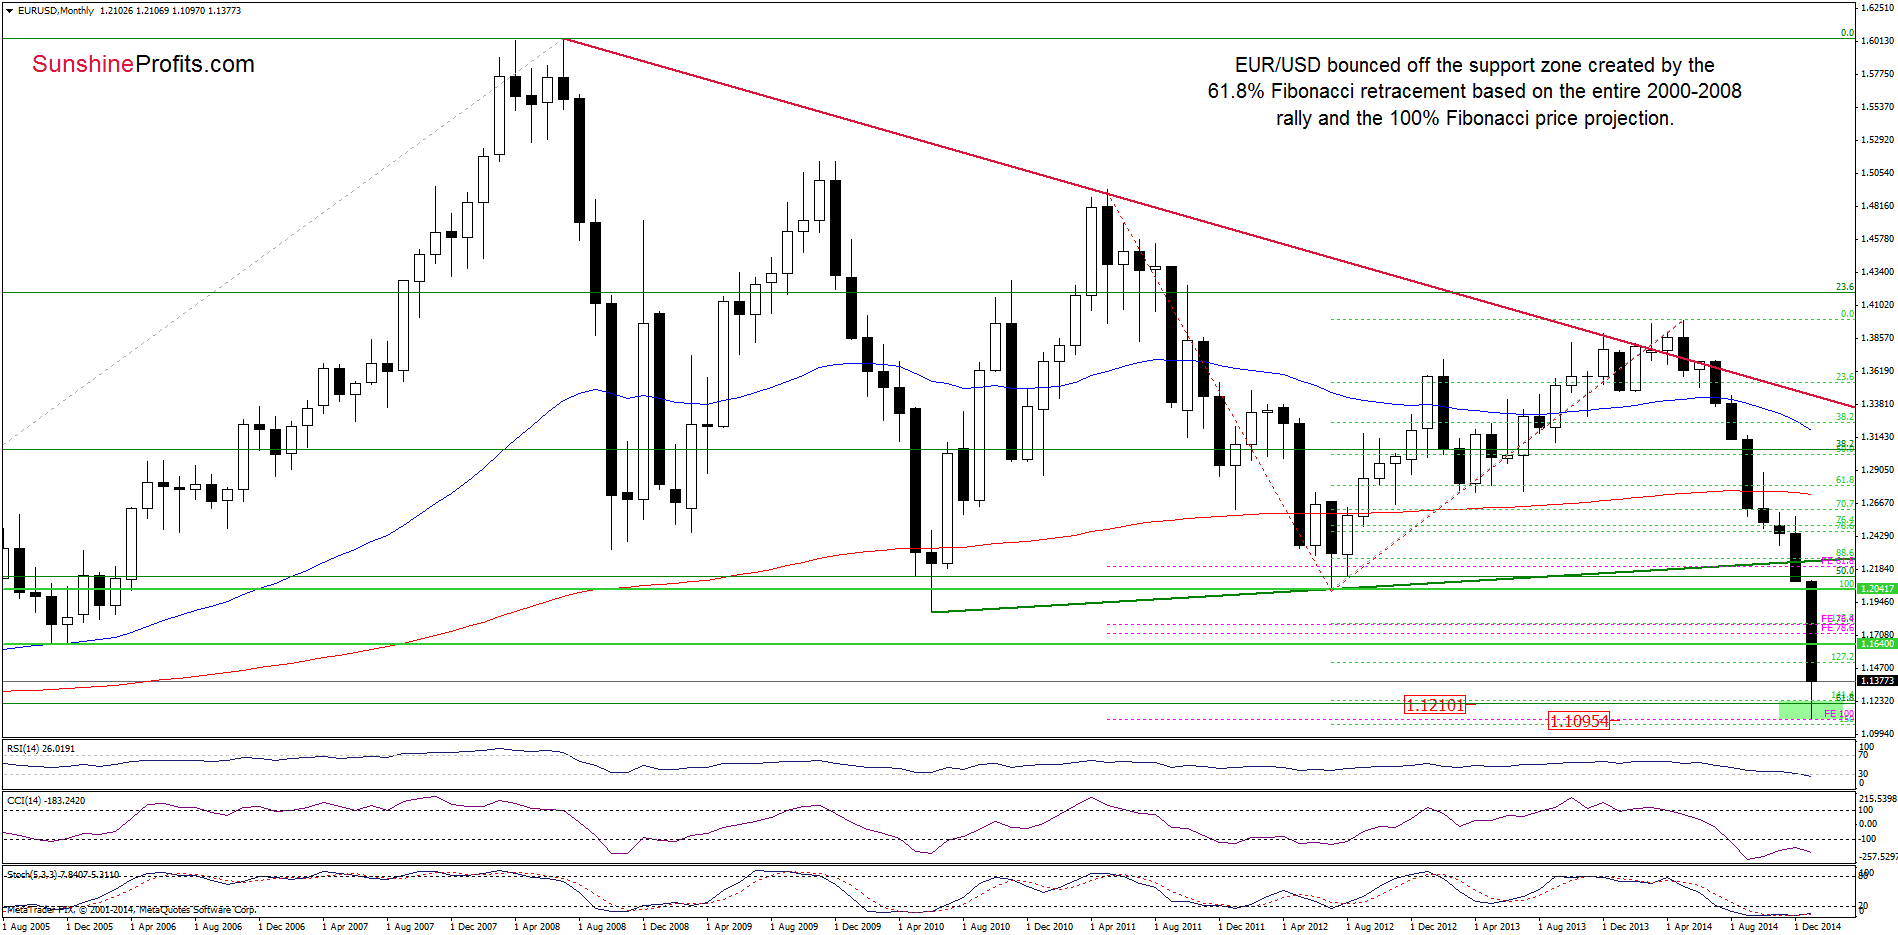
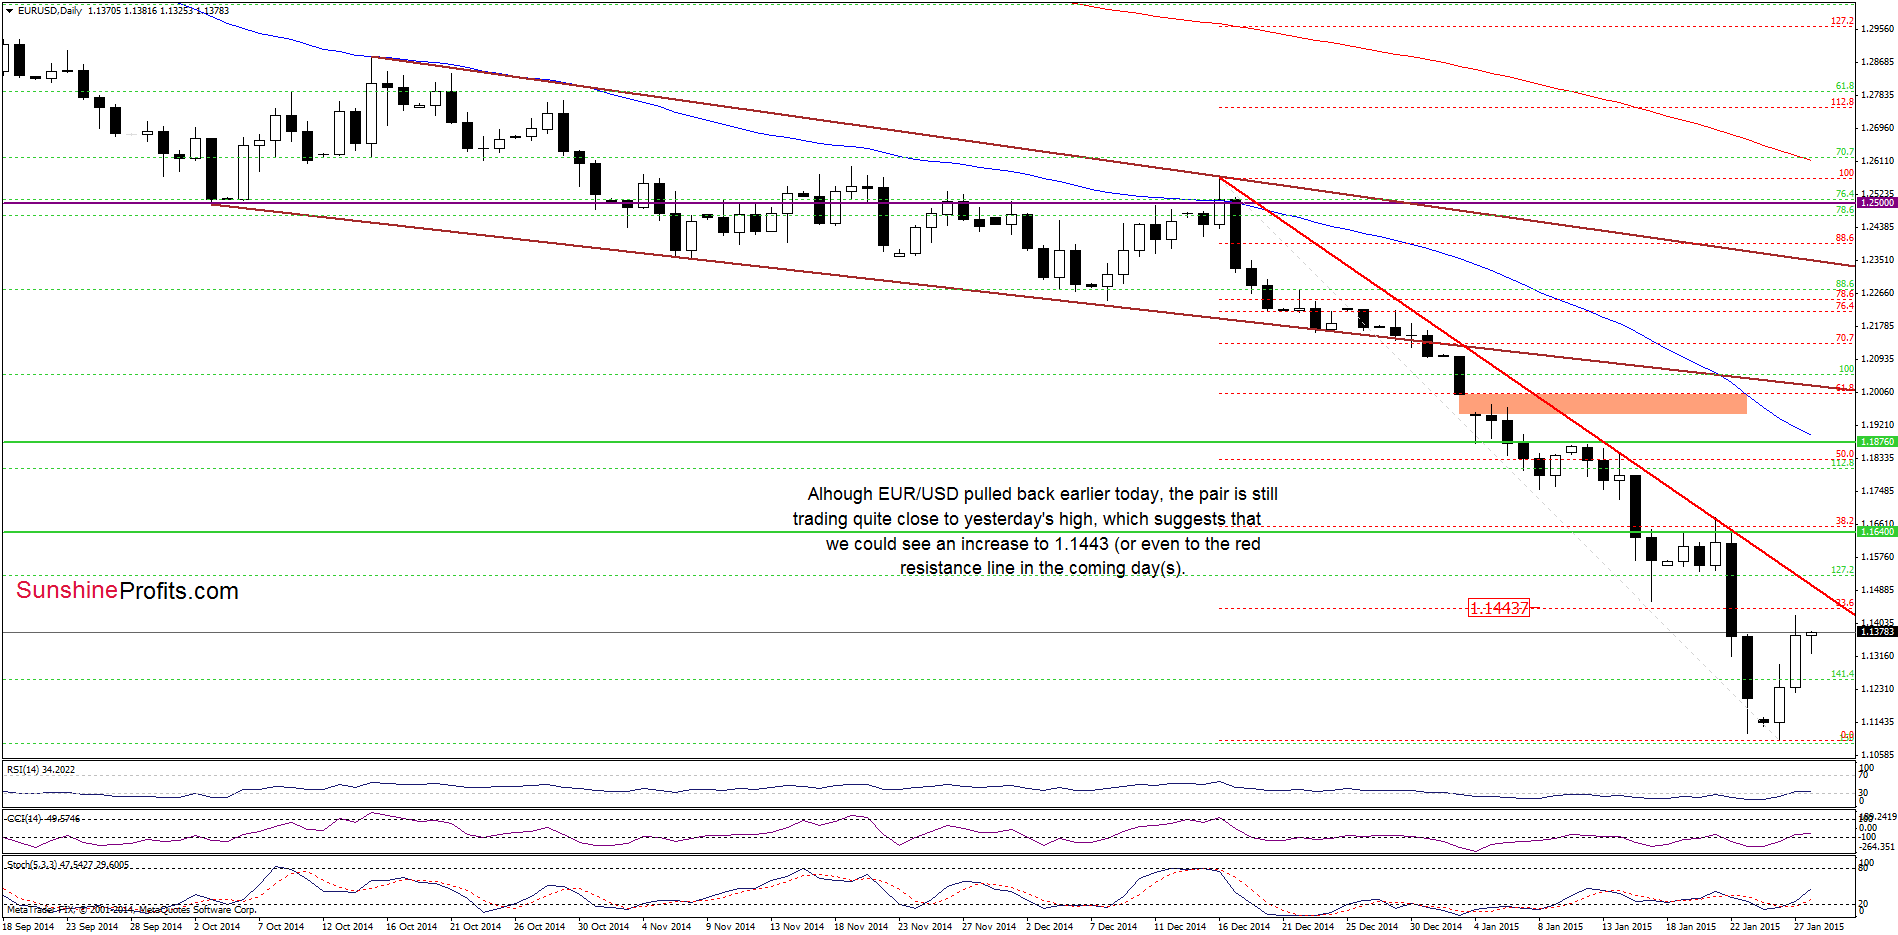
Looking at the above charts we see that although EUR/USD moved little lower earlier today, the pair is sill trading quite close to yesterday’s high. This suggests that we could see an increase to around 1.1443, where the 23.6% Fibonacci retracement based on the Dec 16-Jan 26 declines is (buy signals generated by the indicators support this scenario at the moment). If it’s broken, the next target would be the red declining line based on the Dec 16 and Jan 14 highs (currently around 1.1500). At this point, it’s worth noting that the resistance line successfully stopped further improvement in the previous week, which suggests that we could see a similar price action (a pullback) in the near future. However, if currency bulls manage to push the exchange rate above it, it would be a solid positive signal that will trigger an increase to around 1.1640, where the next resistance zone (created by the last week’s high and the previously-broken Nov 2005 low) is.
Very short-term outlook: bullish
Short-term outlook: mixed
MT outlook: mixed
LT outlook: mixed
Trading position (short-term): In our opinion, no positions are justified from the risk/reward perspective at the moment. However, if we see a successful breakout above the red declining line based on the Dec 16 and Jan 14 highs, we’ll consider opening long positions. We will keep you informed should anything change, or should we see a confirmation/invalidation of the above.
USD/JPY
The situation in the medium-term hasn’t changed much as USD/JPY is still trading between the last month’s high and low, under the 61.8% Fibonacci retracement. Today, we’ll focus on the daily chart.
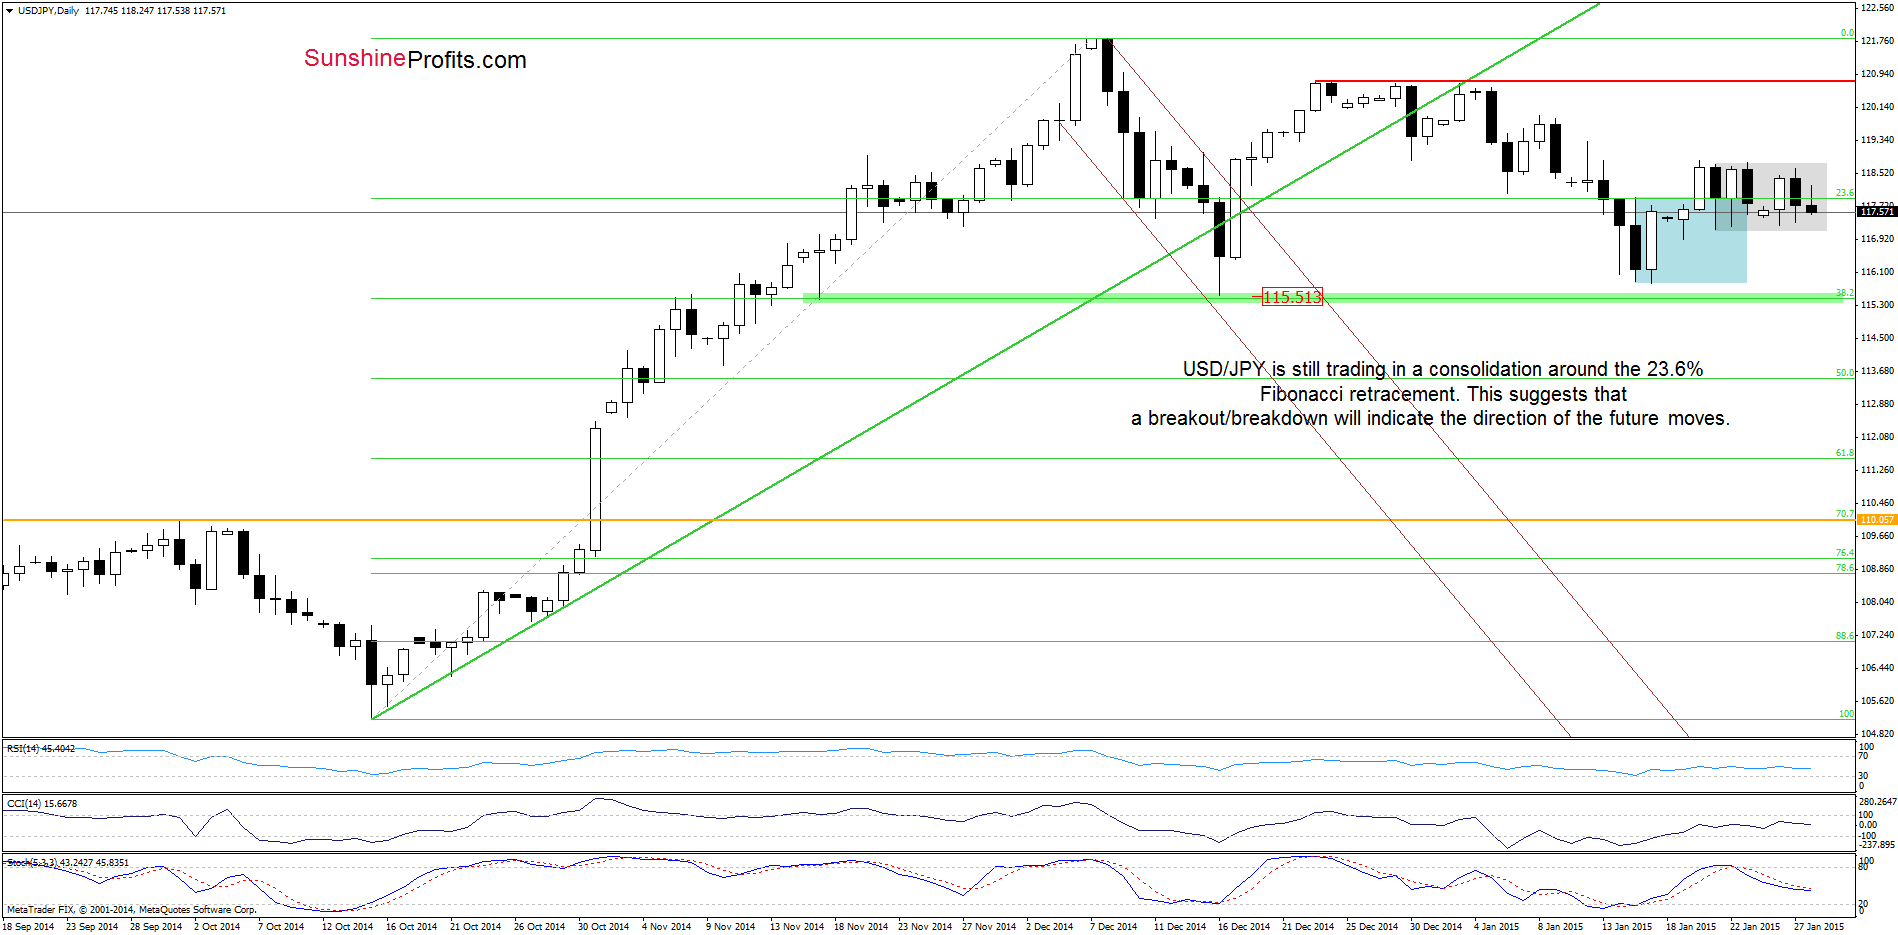
As you see on the above chart, USD/JPY is still trading in a narrow range around the 23.6% Fibonacci retracement, which means that a breakout/breakdown will indicate the direction of the future moves. However, taking into account an invalidation of the breakout above the upper border of the previous consolidation (marked with blue), it seems that the pair will test the Jan 21 low of 117.17 (the lower line of the current consolidation). If it holds (and the Stochastic Oscillator generates a buy signal), we’ll see a rebound and an increase to at least 118.80, but if it’s broken, USD/JPY will test the Jan lows in the coming day(s).
Very short-term outlook: mixed
Short-term outlook: mixed
MT outlook: mixed
LT outlook: bullish
Trading position (short-term; our opinion): No positions are justified from the risk/reward perspective at the moment. We will keep you informed should anything change, or should we see a confirmation/invalidation of the above.
USD/CAD
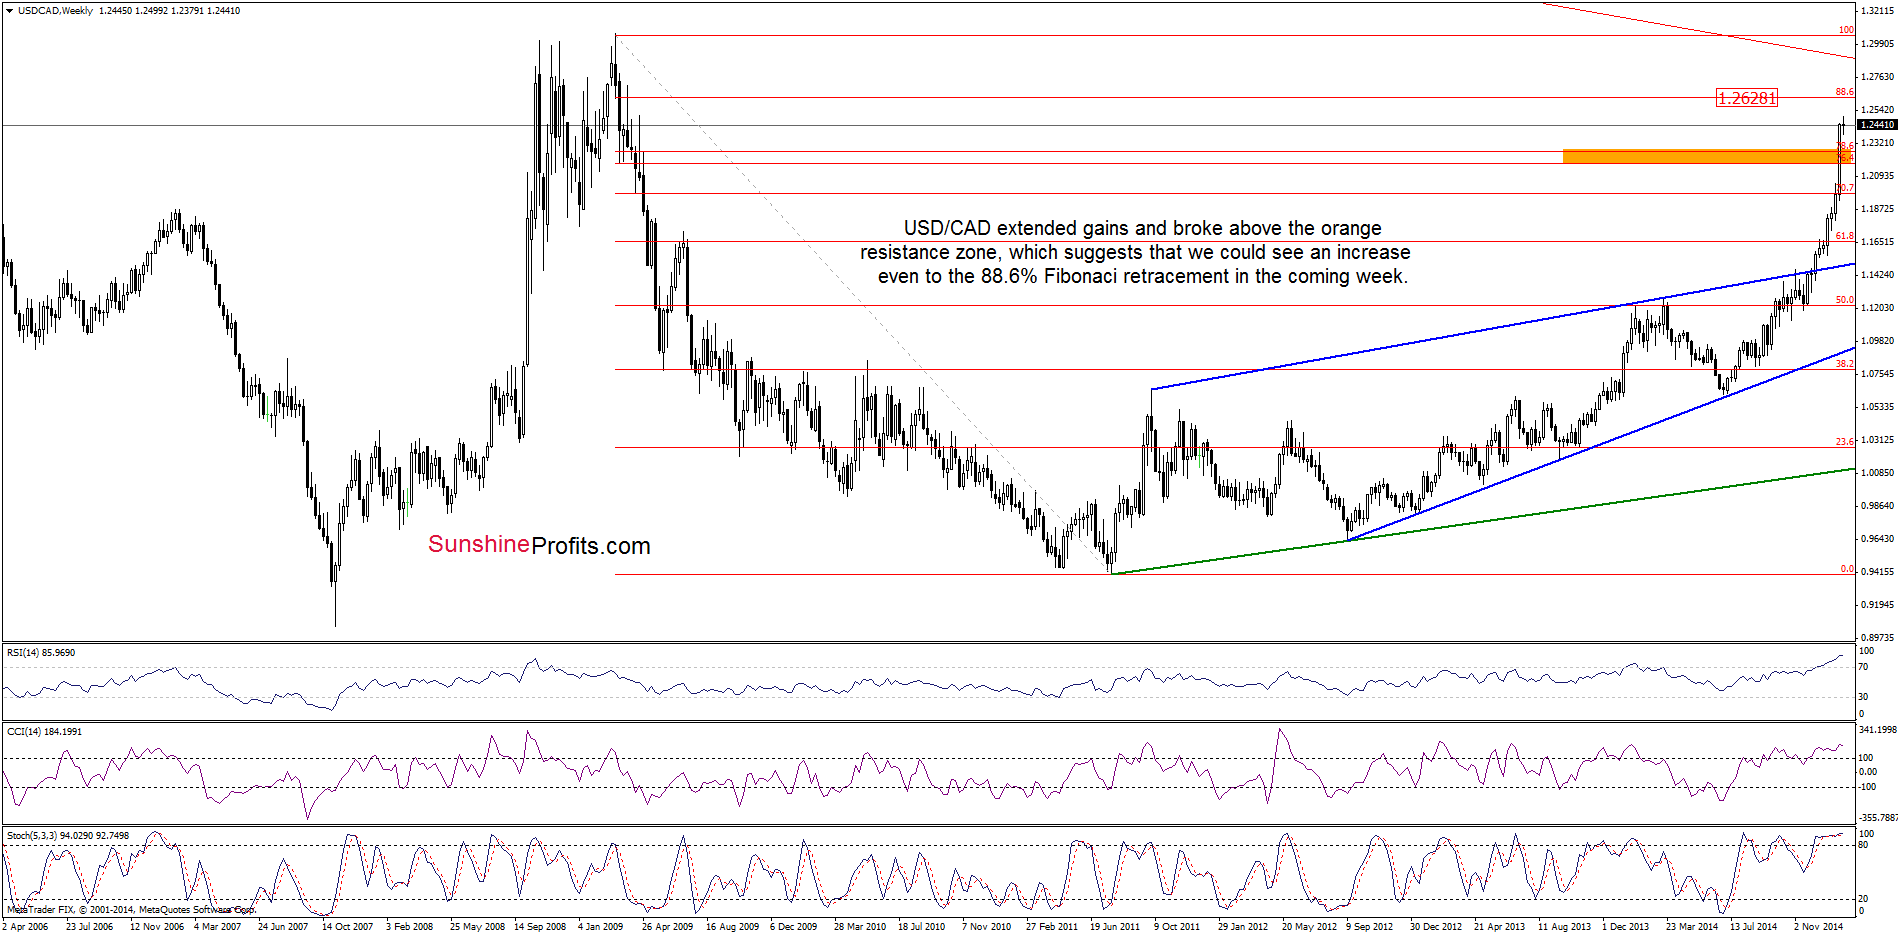
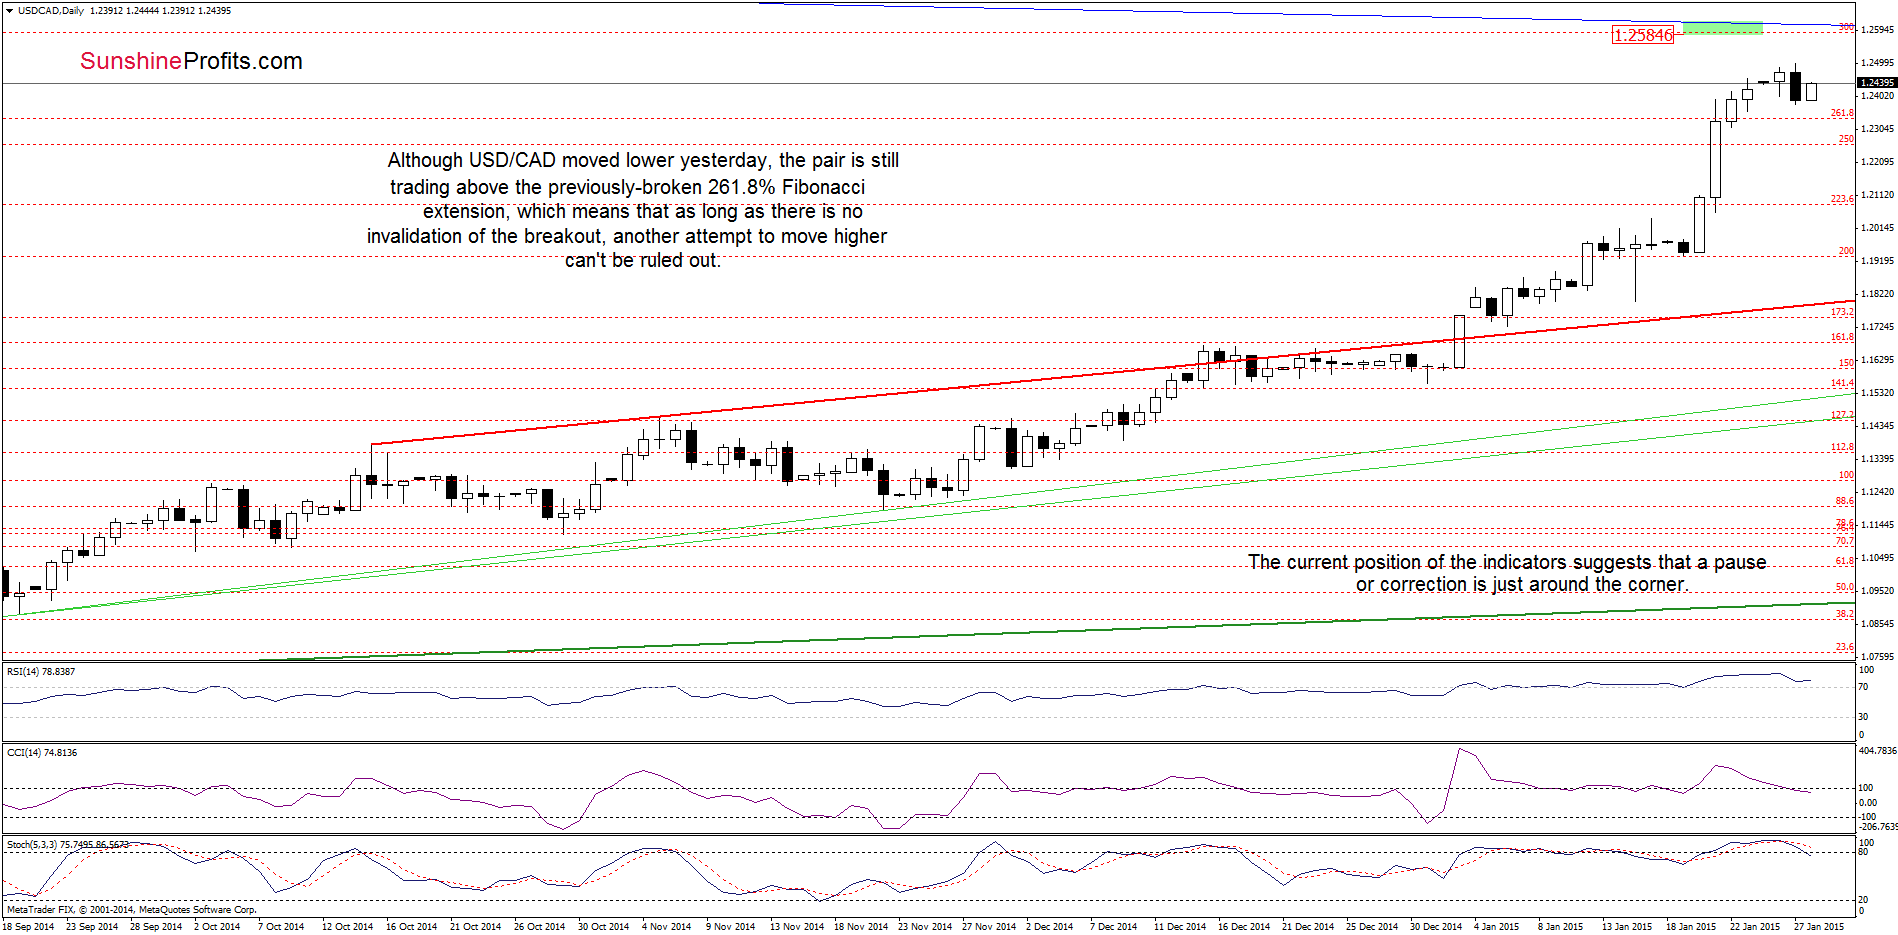
Looking at the daily chart, we see that although USD/CAD corrected the recent rally, yesterday’s pullback is very shallow (compared to earlier gains) and the pair is still trading above the previously-broken 261.8% Fibonacci extension and the orange resistance zone (marked on the weekly chart). This means that as long as there is no invalidation of the breakout above these levels, another attempt to move higher can’t be ruled out. If this is the case, the bullish scenario from our Forex Trading Alert posted on Friday, will be in play:
(…) USD/CAD broke above the orange resistance zone which suggests further improvement and an increase to around 1.2628, where the 88.6% Fibonacci retracement is. Nevertheless, before currency bulls realize this scenario, they will have to push the pair above 1.2585-1.2600, where the nearest resistance zone (created by the 300% Fibonacci extension and the long-term blue line based on the Jan 2002 and Sep 2002 highs) is.
Very short-term outlook: bullish
Short-term outlook: mixed with bullish bias
MT outlook: mixed
LT outlook: mixed
Trading position (short-term; our opinion): No positions are justified from the risk/reward perspective at the moment. We will keep you informed should anything change, or should we see a confirmation/invalidation of the above.
Thank you.
Nadia Simmons
Forex & Oil Trading Strategist
Przemyslaw Radomski, CFA
Founder, Editor-in-chief
Gold & Silver Trading Alerts
Forex Trading Alerts
Oil Investment Updates
Oil Trading Alerts

