
Earlier today, the USD Index climbed to a fresh 12-year high against other major currencies as yesterday’s the European Central Bank’s decision of a large scale stimulus program continued to support the greenback. How did this rally affect the picture of major currency pairs? Did it change their outlooks?
In our opinion the following forex trading positions are justified - summary:
EUR/USD
Yesterday, we wrote the following:
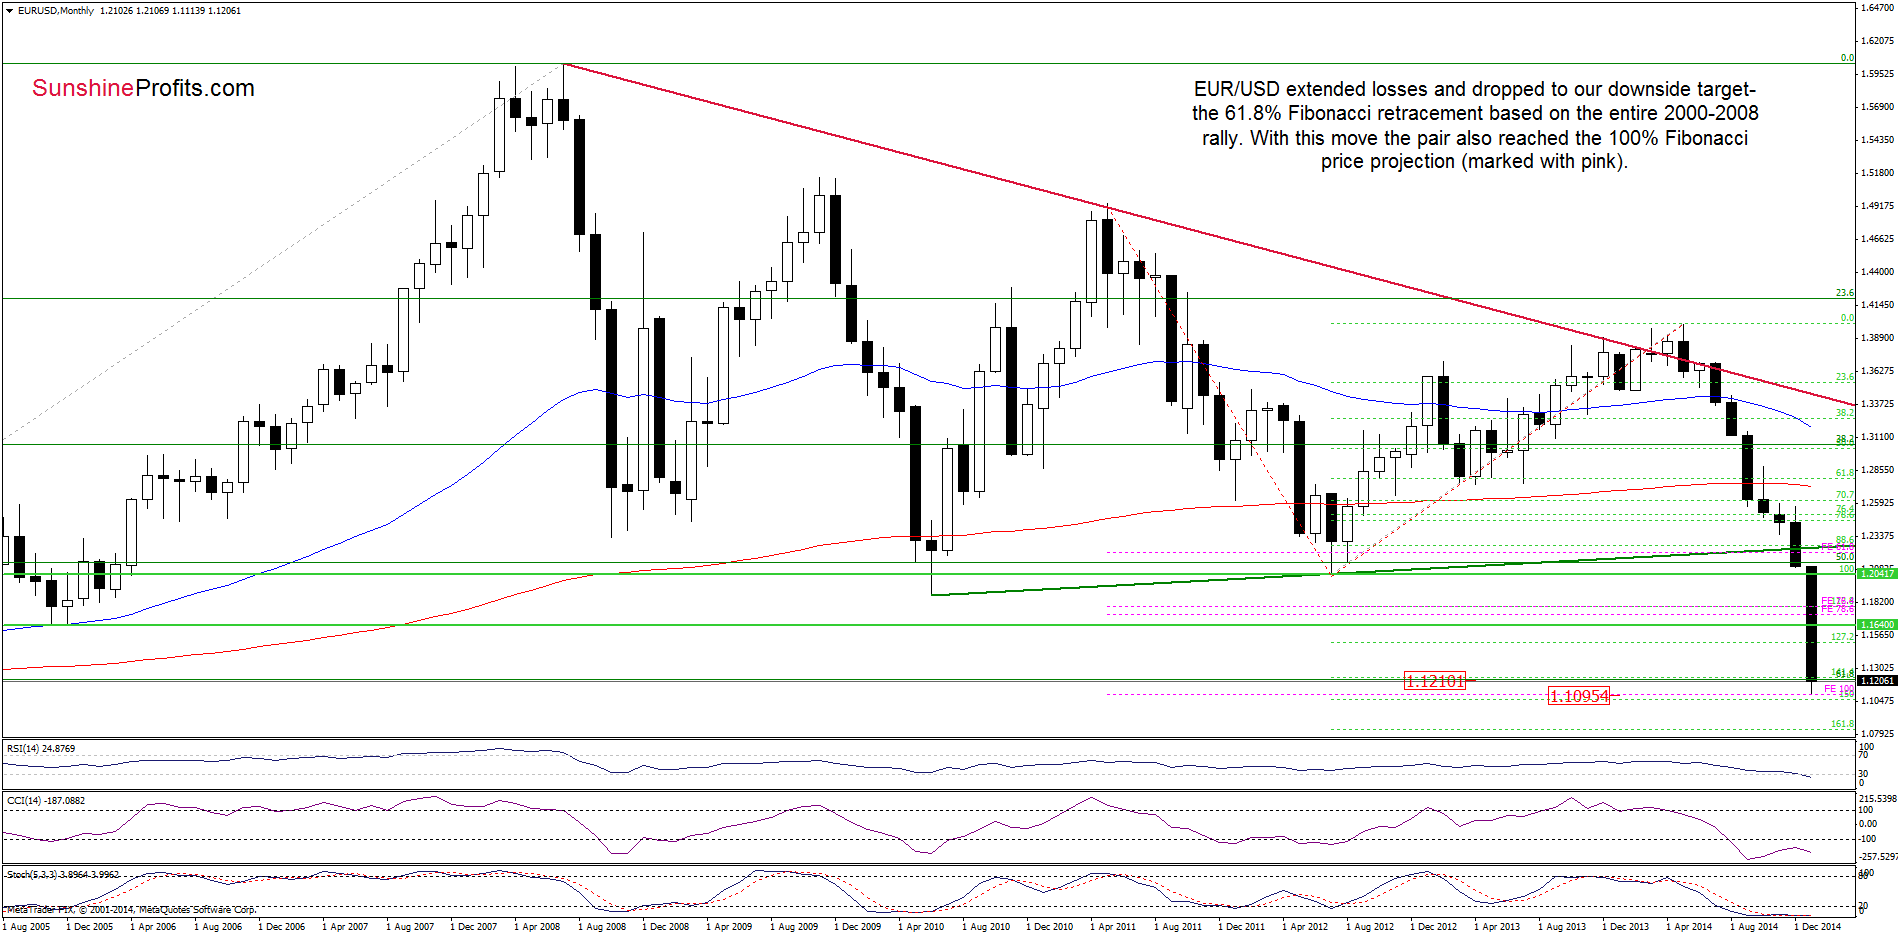
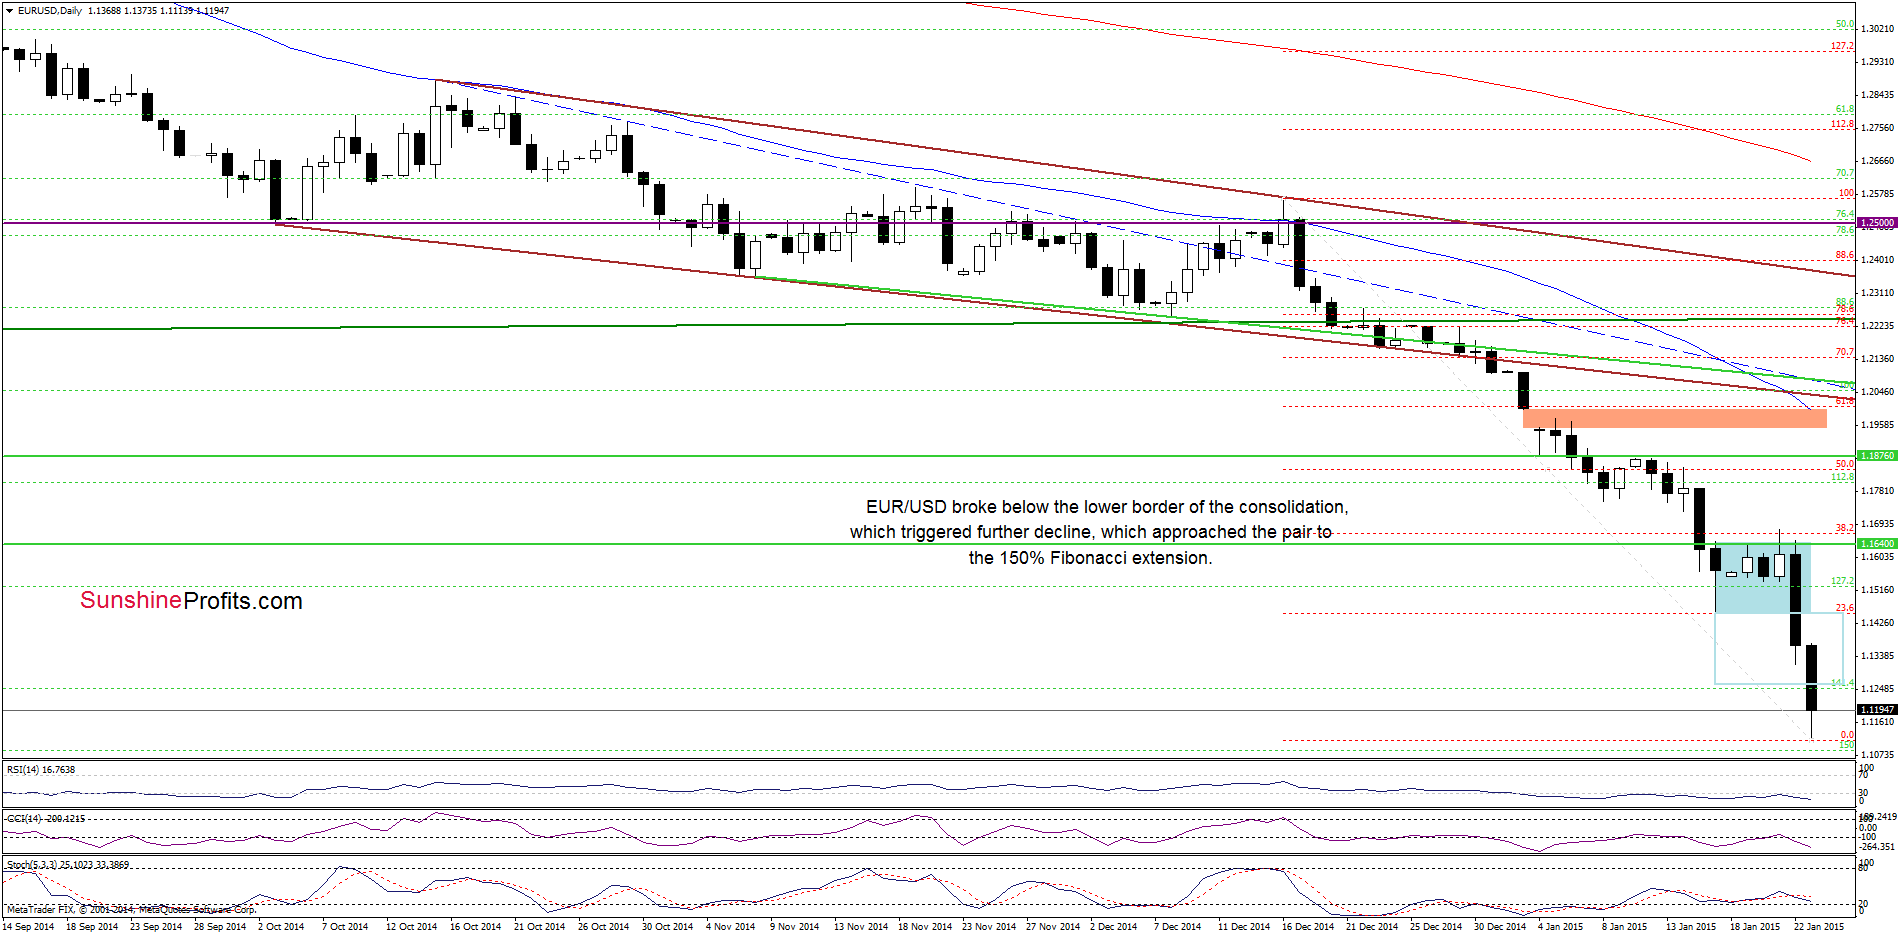
(…) if the exchange rate breaks below the lower border of the consolidation (marked with blue), EUR/USD will decline to around 1.12700, where the size of the downward move will correspond to the height of the formation and where the 141.4% Fibonacci extension is. Additionally, slightly below this area is also the 61.8% Fibonacci retracement based on the entire 2000-2008 rally.
As you see on the charts, currency bears not only took the exchange rate to our downside targets, but also managed to push EUR/USD to the 100% Fibonacci price projection based on the May 2011 and May 2014 highs and the Jul 2012 low. If this support encourages currency bulls to act, we’ll see an invalidation of the breakdown under the 61.8% Fibonacci retracement. Such price action would be a solid positive sign that could trigger further improvement. Therefore, it seems to us that today’s closing price will have a greater impact on future price moves than it might seem on the first sight.
Very short-term outlook: mixed
Short-term outlook: mixed
MT outlook: mixed
LT outlook: mixed
Trading position (short-term): In our opinion, no positions are justified from the risk/reward perspective at the moment. We will keep you informed should anything change, or should we see a confirmation/invalidation of the above.
GBP/USD
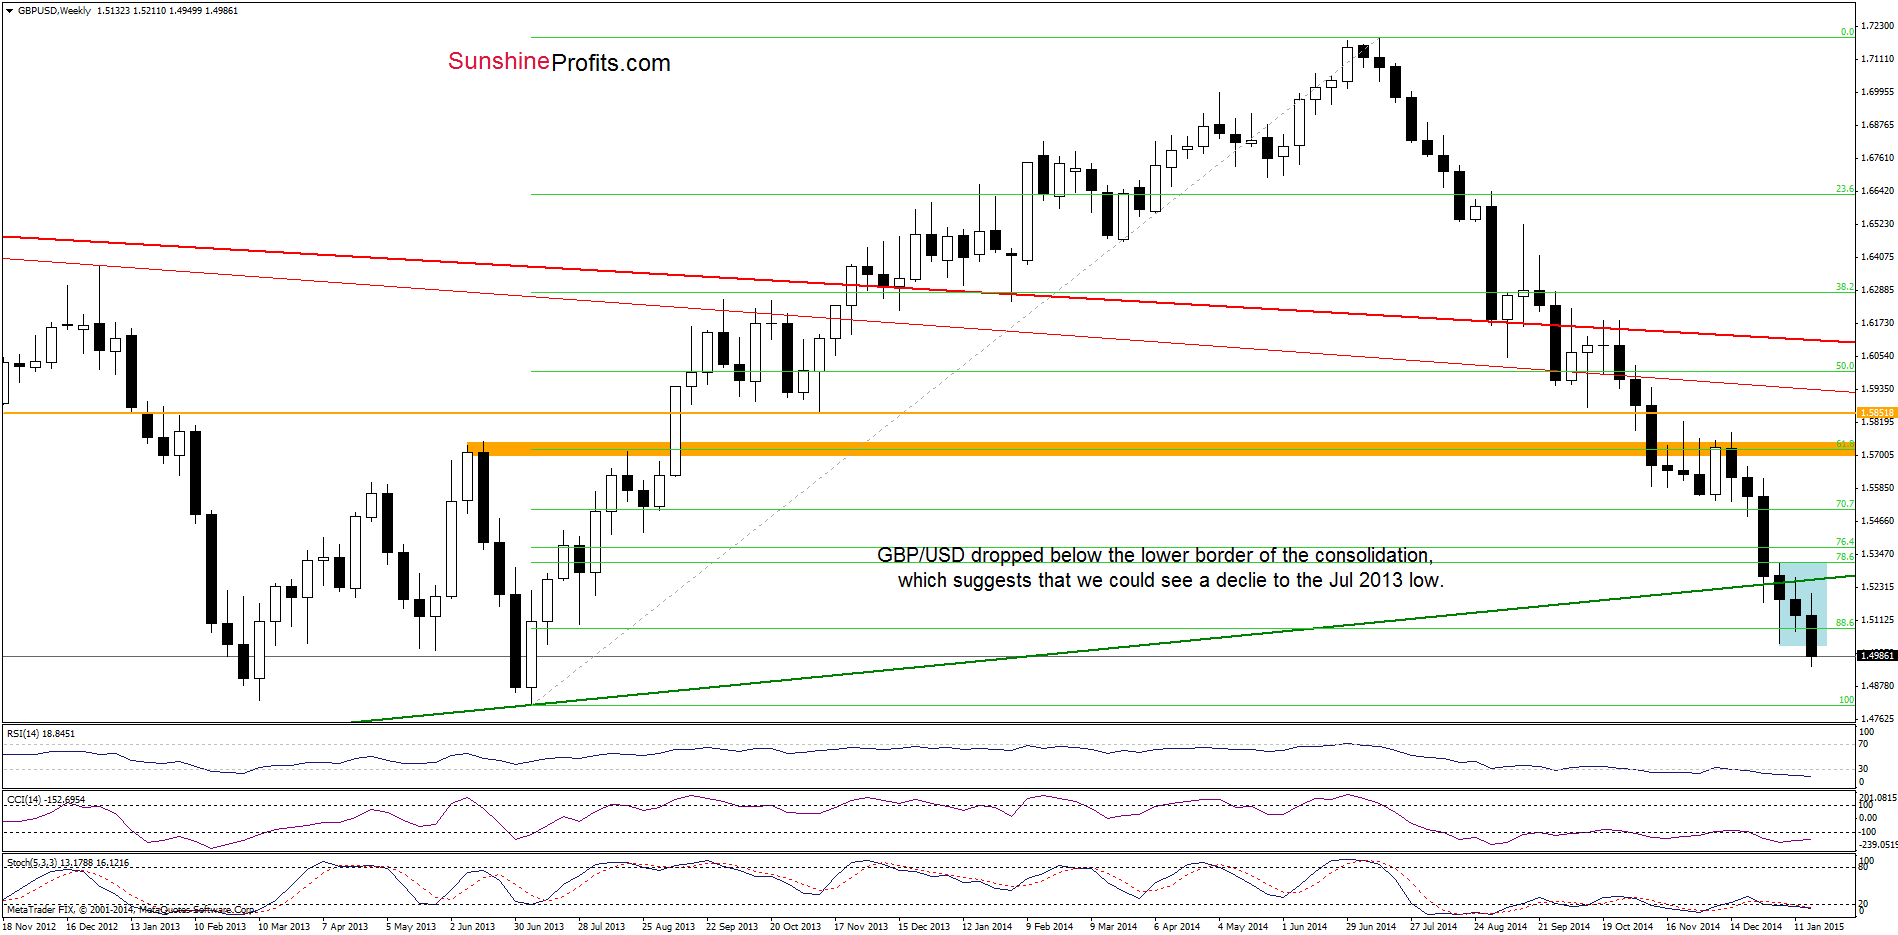
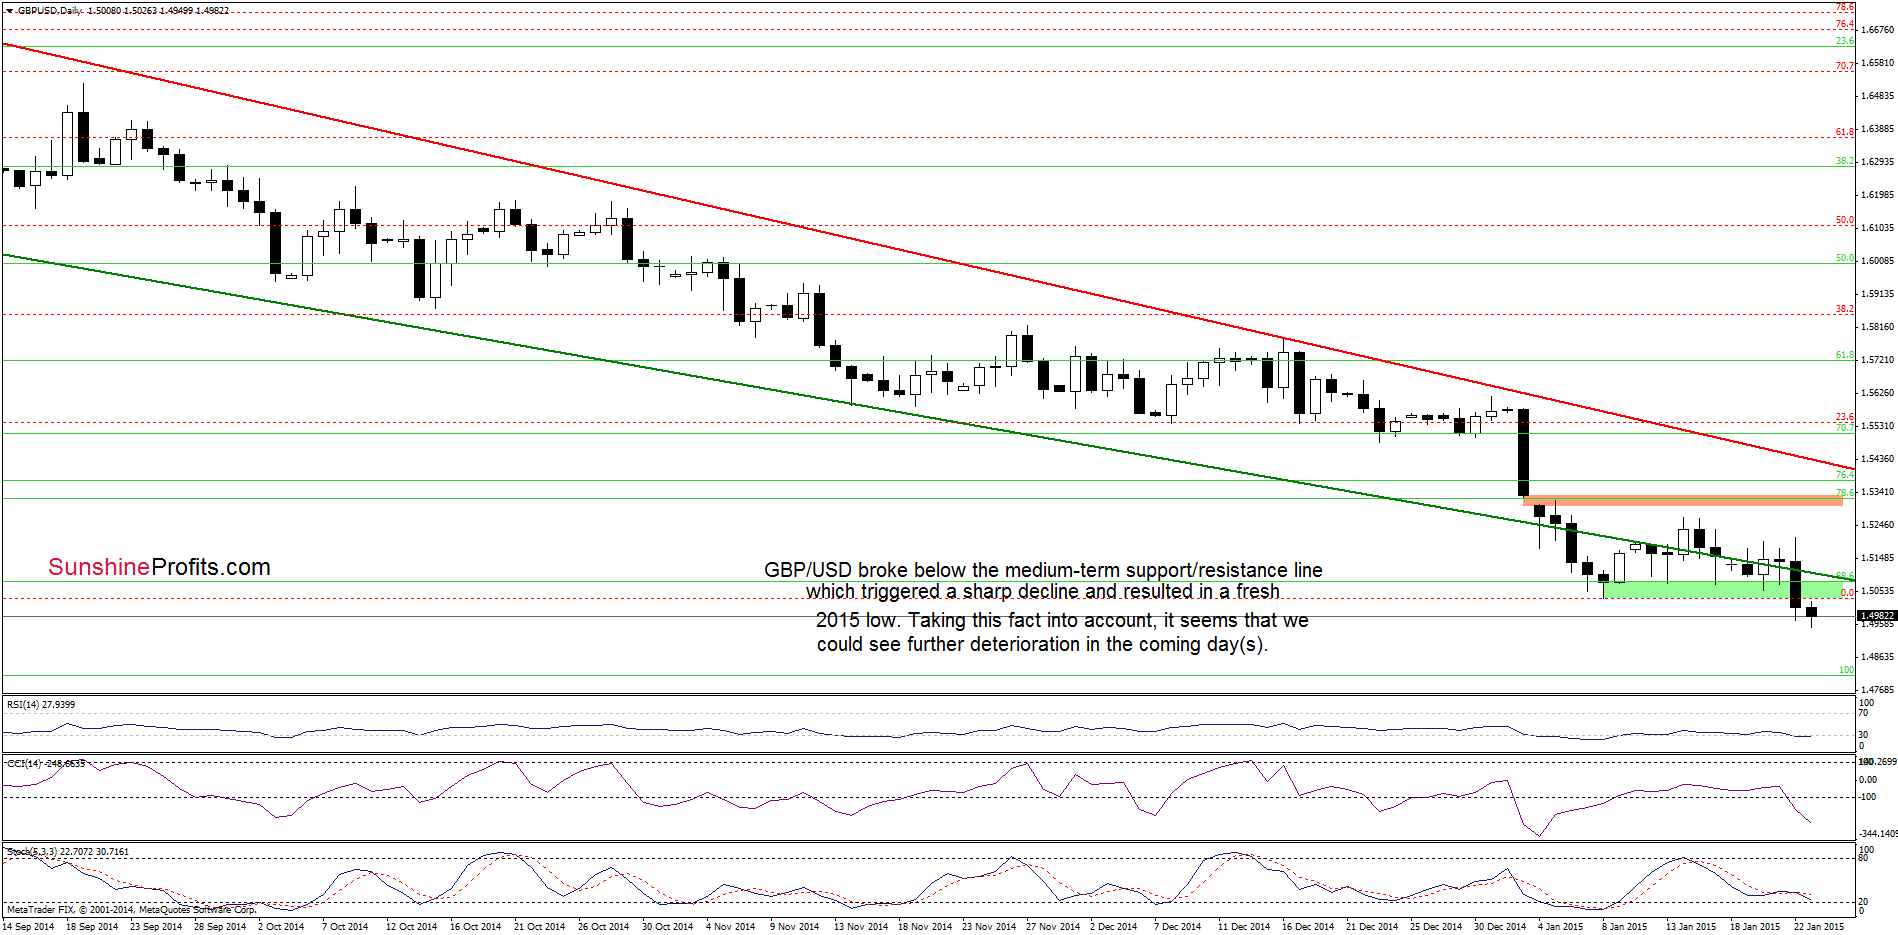
Looking at the daily chart, we see that although GBP/USD invalidated the breakdown below the medium-term green support/resistance line at the beginning of the week, currency bulls didn’t manage to push the pair higher (similarly to what we saw in the previous week). As a result, the exchange rate reversed and declined sharply, slipping under the green support zone. This is a negative signal, which suggests further deterioration (especially when we factor in the fact that the recent downward move took the exchange rate below the lower border of the consolidation marked on the weekly chart). If this is the case, and currency bulls don’t invalidate these breakdowns, GBP/USD may drop even to the Jul 2013 low of 1.48123 in the coming week.
Very short-term outlook: mixed
Short-term outlook: mixed
MT outlook: mixed
LT outlook: mixed
Trading position (short-term): In our opinion, no positions are justified from the risk/reward perspective at the moment. We will keep you informed should anything change, or should we see a confirmation/invalidation of the above.
USD/JPY
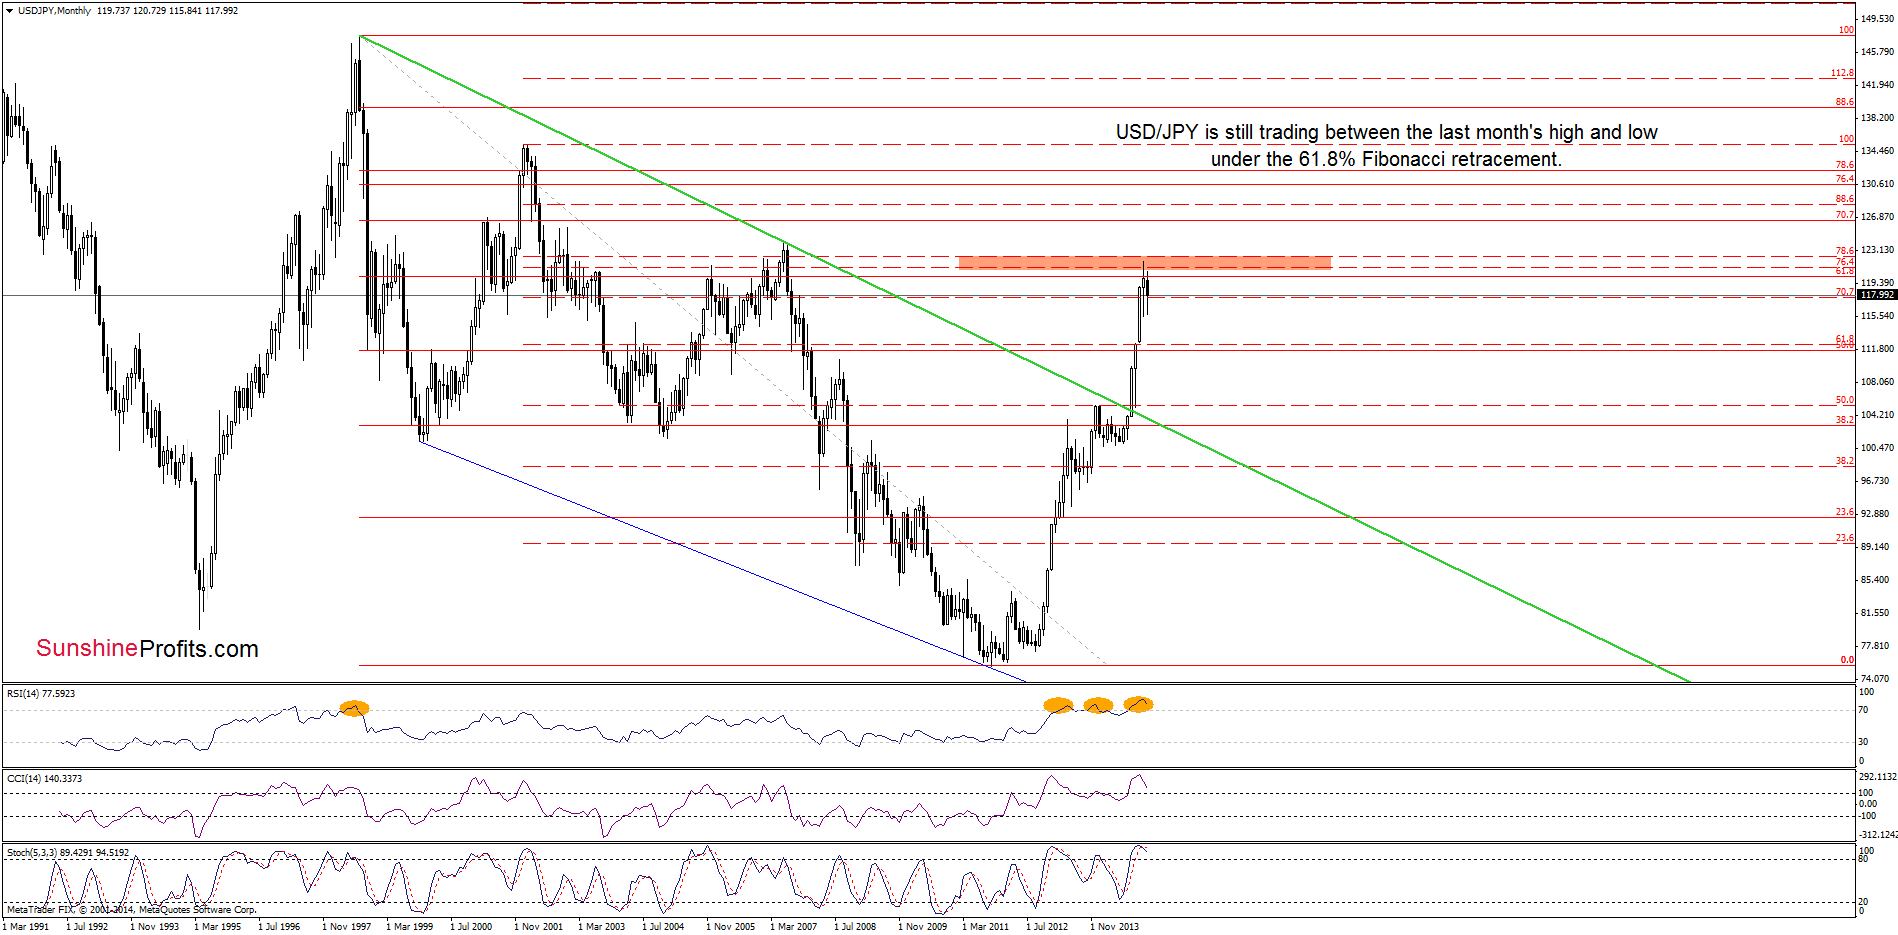
The situation in the medium-term hasn’t changed much as USD/JPY is still trading between the last week’s high and low, under the 61.8% Fibonacci retracement. What can we infer from the daily chart? Let’s check.
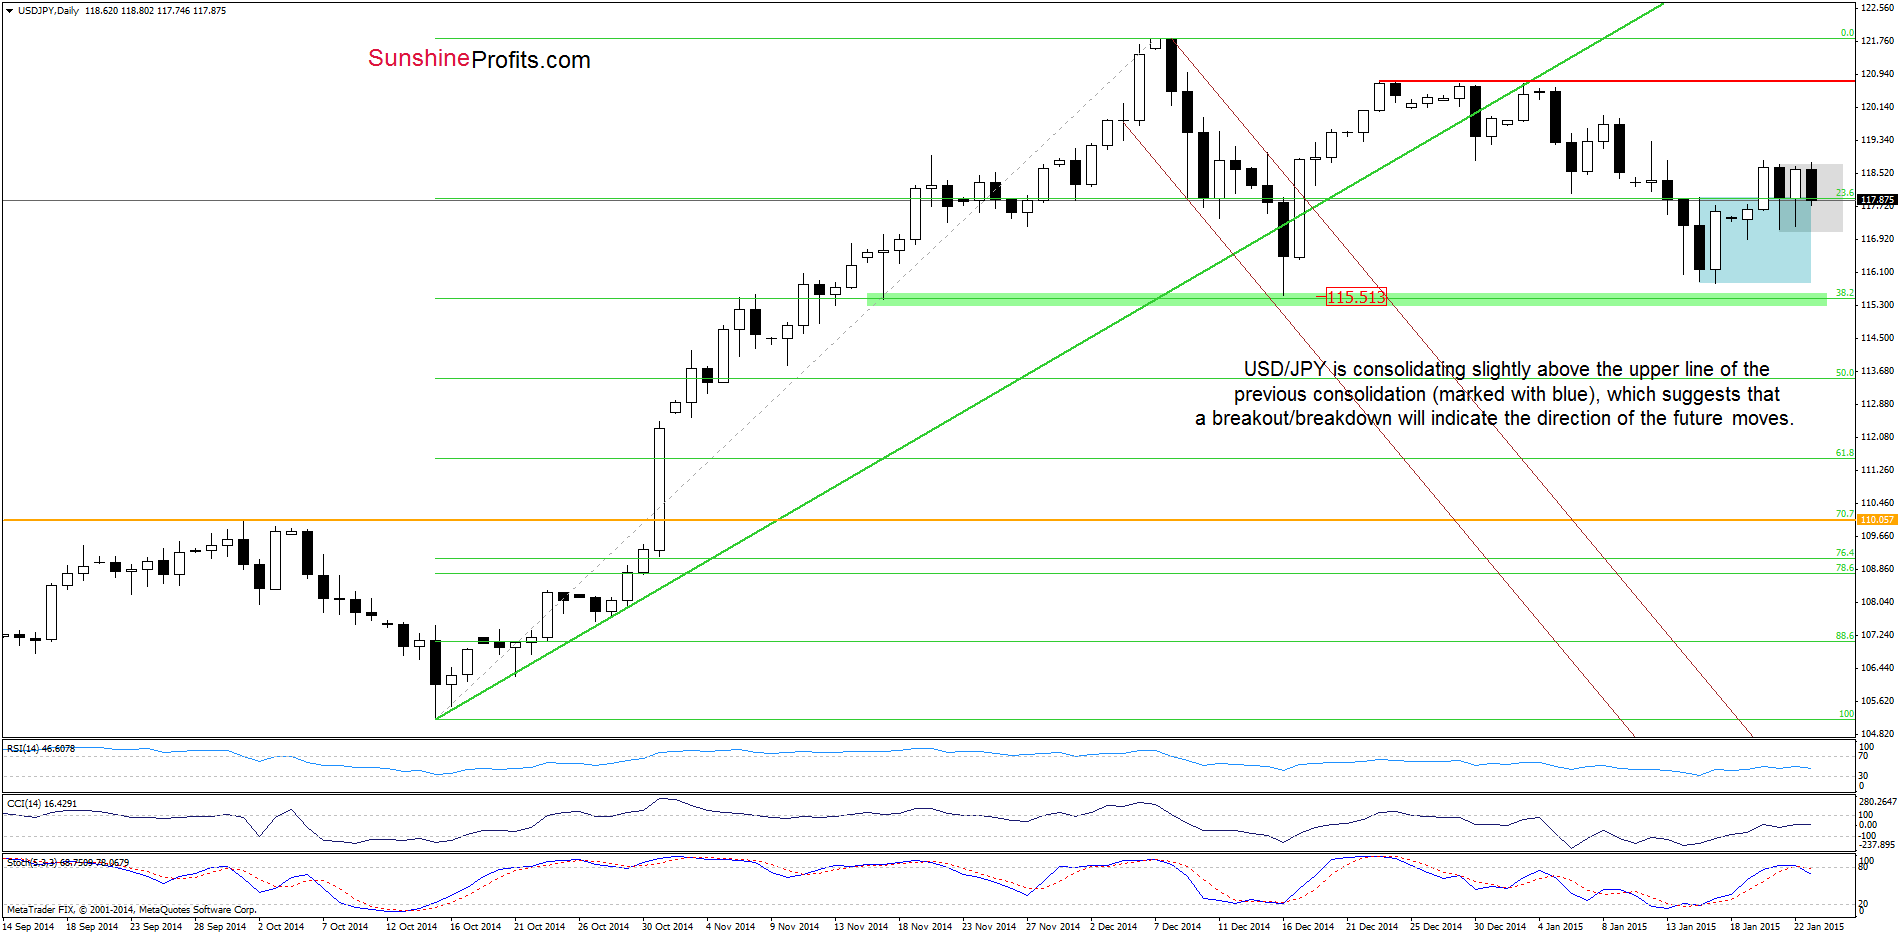
On the daily chart, we see that USD/JPY is trading in a narrow range, slightly above the upper line of the previous consolidation (marked with blue). This suggests that a breakout/breakdown will indicate the direction of the future moves. If the exchange rate climbs higher, the initial upside target would be around 120, where the previous highs are. However, taking into account a sell signal generated by the Stochastic Oscillator it seems that we could see a test of the recent lows in the coming days.
Very short-term outlook: mixed
Short-term outlook: mixed
MT outlook: mixed
LT outlook: bullish
Trading position (short-term; our opinion): No positions are justified from the risk/reward perspective at the moment. We will keep you informed should anything change, or should we see a confirmation/invalidation of the above.
USD/CAD
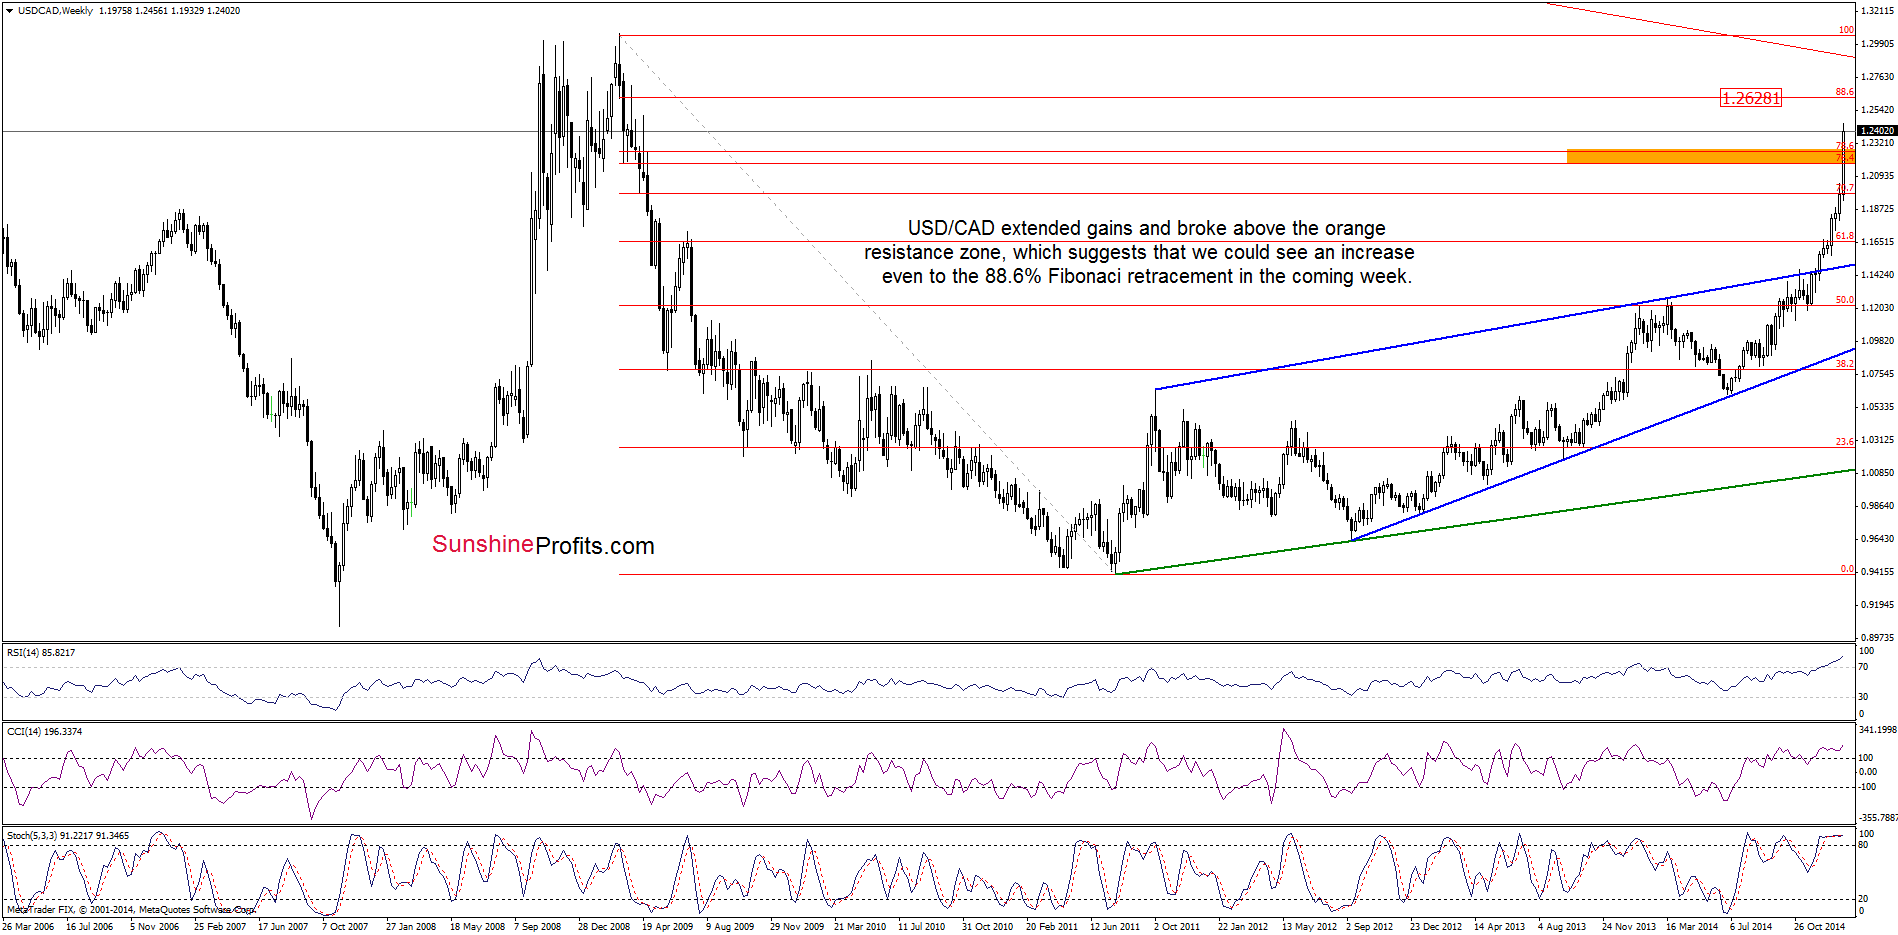
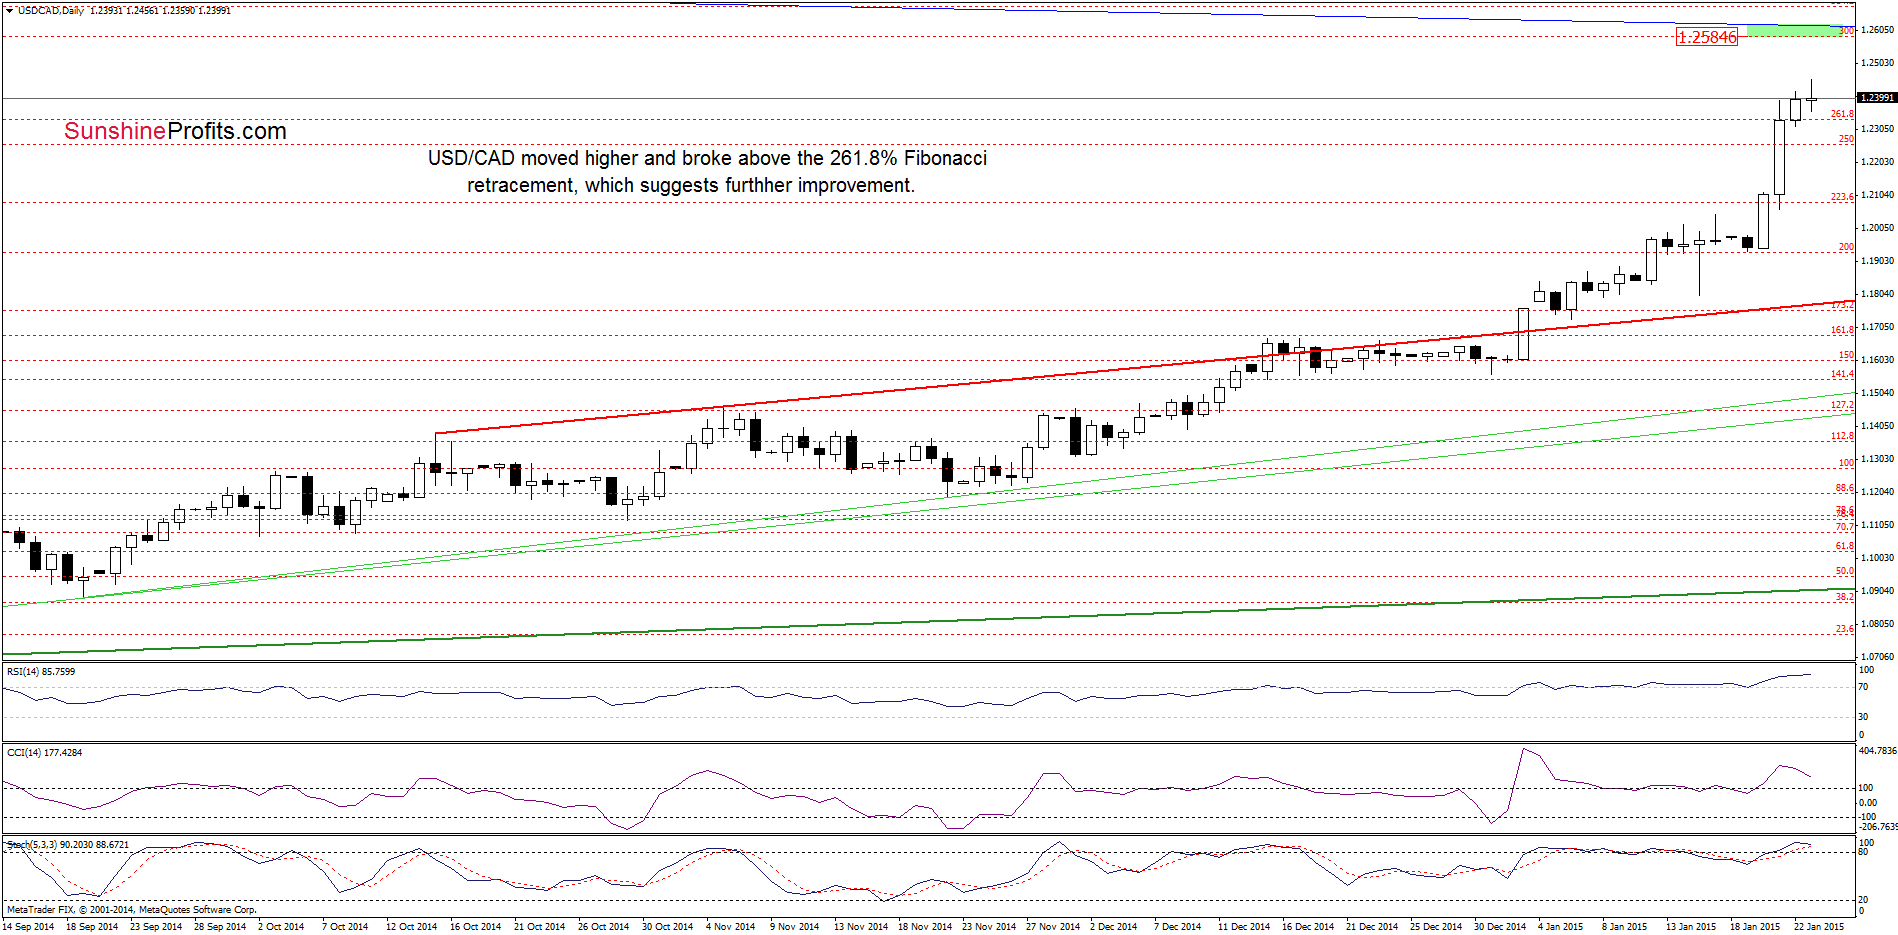
Looking at the daily chart, we see that USD/CAD extended gains and hit a fresh 2015 high. Taking into account the fact that the exchange rate sill remains above the previously-broken 261.8% Fibonacci extension and the orange resistance zone (marked on the weekly chart), we believe that our last commentary on this currency pair is up-to-date:
(…) USD/CAD broke above the orange resistance zone which suggests further improvement and an increase to around 1.2628, where the 88.6% Fibonacci retracement is. Nevertheless, before currency bulls realize this scenario, they will have to push the pair above 1.2585-1.2600, where the nearest resistance zone (created by the 300% Fibonacci extension and the long-term blue line based on the Jan 2002 and Sep 2002 highs) is.
Very short-term outlook: bullish
Short-term outlook: mixed with bullish bias
MT outlook: mixed
LT outlook: mixed
Trading position (short-term; our opinion): No positions are justified from the risk/reward perspective at the moment. We will keep you informed should anything change, or should we see a confirmation/invalidation of the above.
USD/CHF
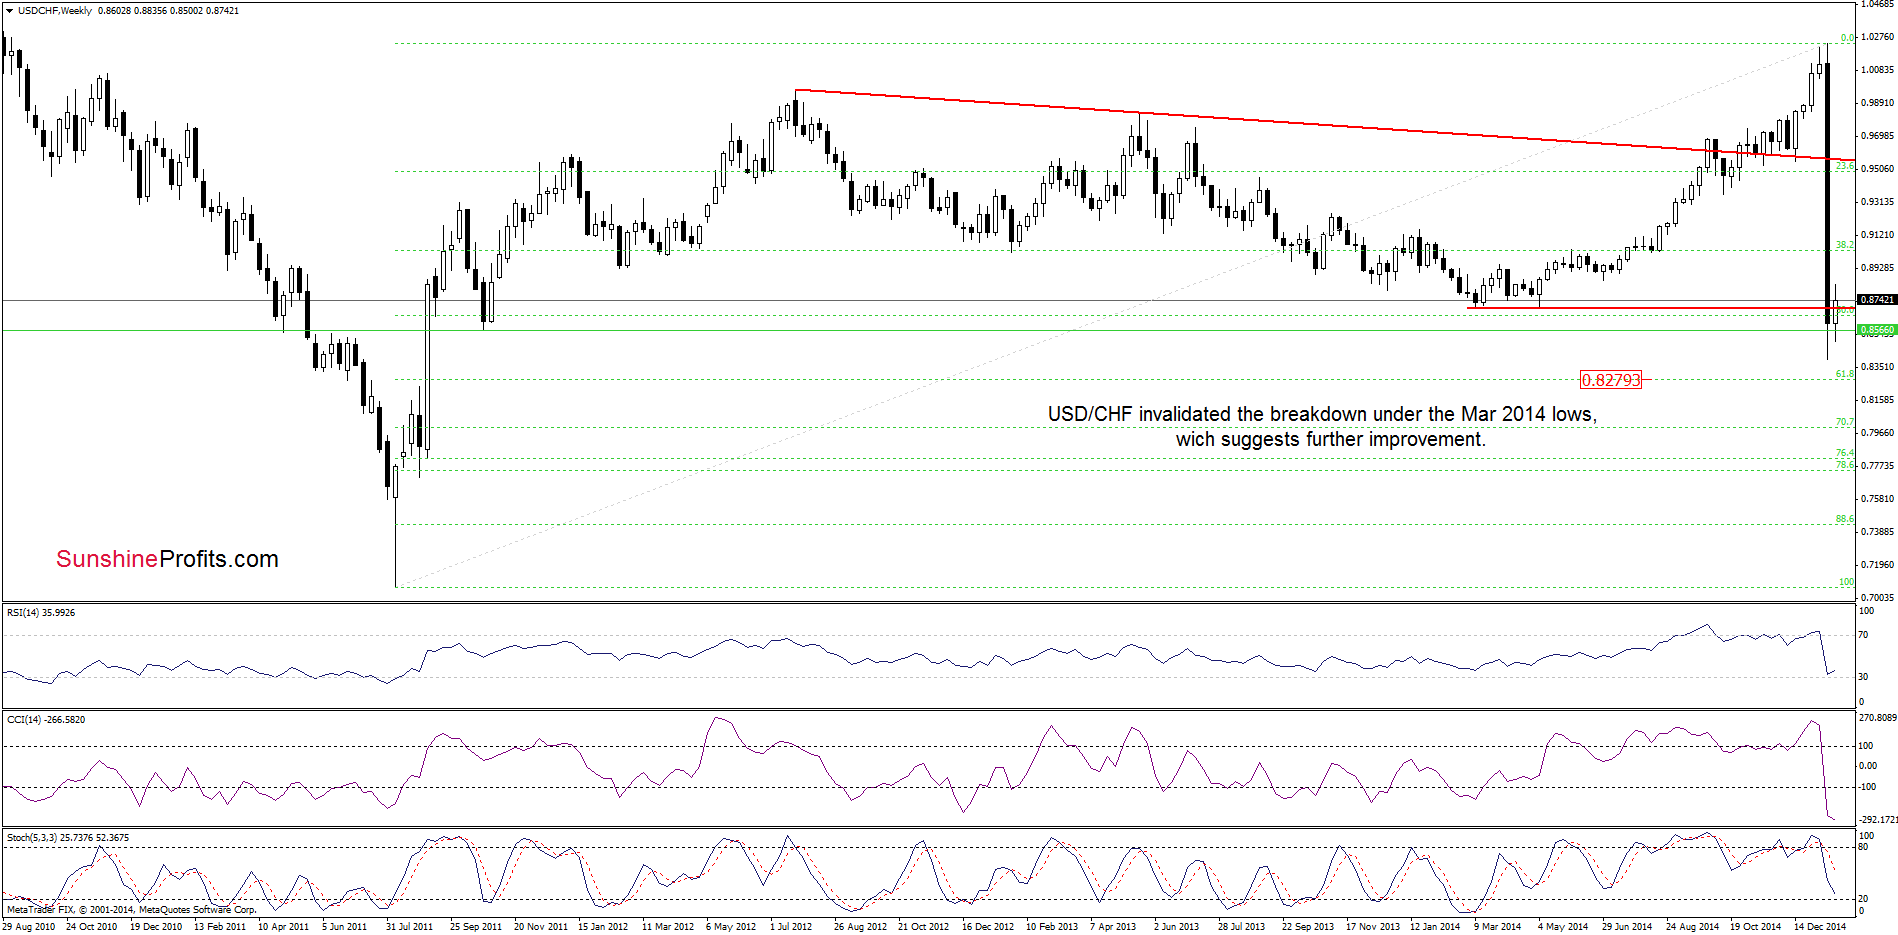
The situatio in the medium-term has improved as USD/CHF reversed and invalidated the breakdown below the Mar 2014 lows. This is a bullish signal, which suggests further rally. Nevertheless, we think that such price action wil be more likely if the pair breaks above the nearest resistance zone. Let’s take a closer look at the chart below.
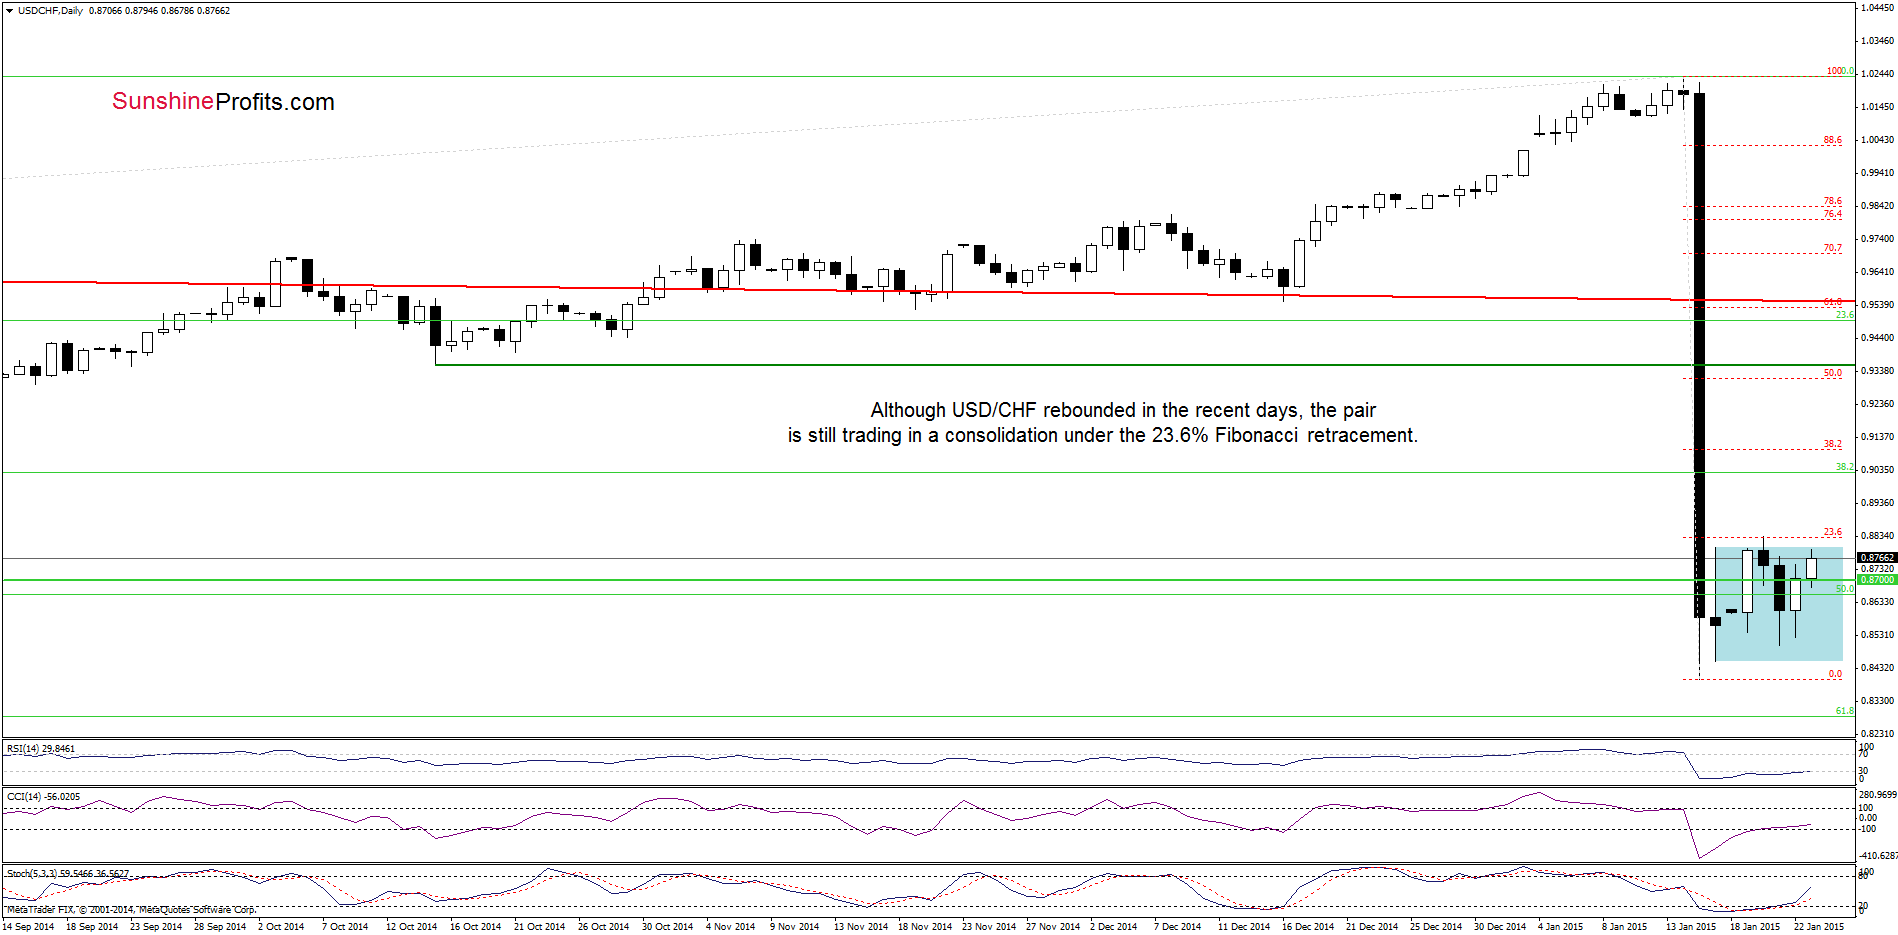
From this perspective, we see that USD/CHF is still trading in a consolidation under the 23.6% Fibonacci retracement (based on the recent decline). Therefore, a breakout above this resistance and the upper line f the formation will be a bullish signal, which would trigger an increase to at least 0.9100, where the 38.2% Fibonacci retracement is. At this point, it’s worth noting that all indicators generated buy signals, supporting the bullish case at the moment.
Very short-term outlook: mixed with bullish bias
Short-term outlook: mixed
MT outlook: mixed
LT outlook: bearish
Trading position (short-term; our opinion): No positions are justified from the risk/reward perspective at the moment. We will keep you informed should anything change, or should we see a confirmation/invalidation of the above.
AUD/USD
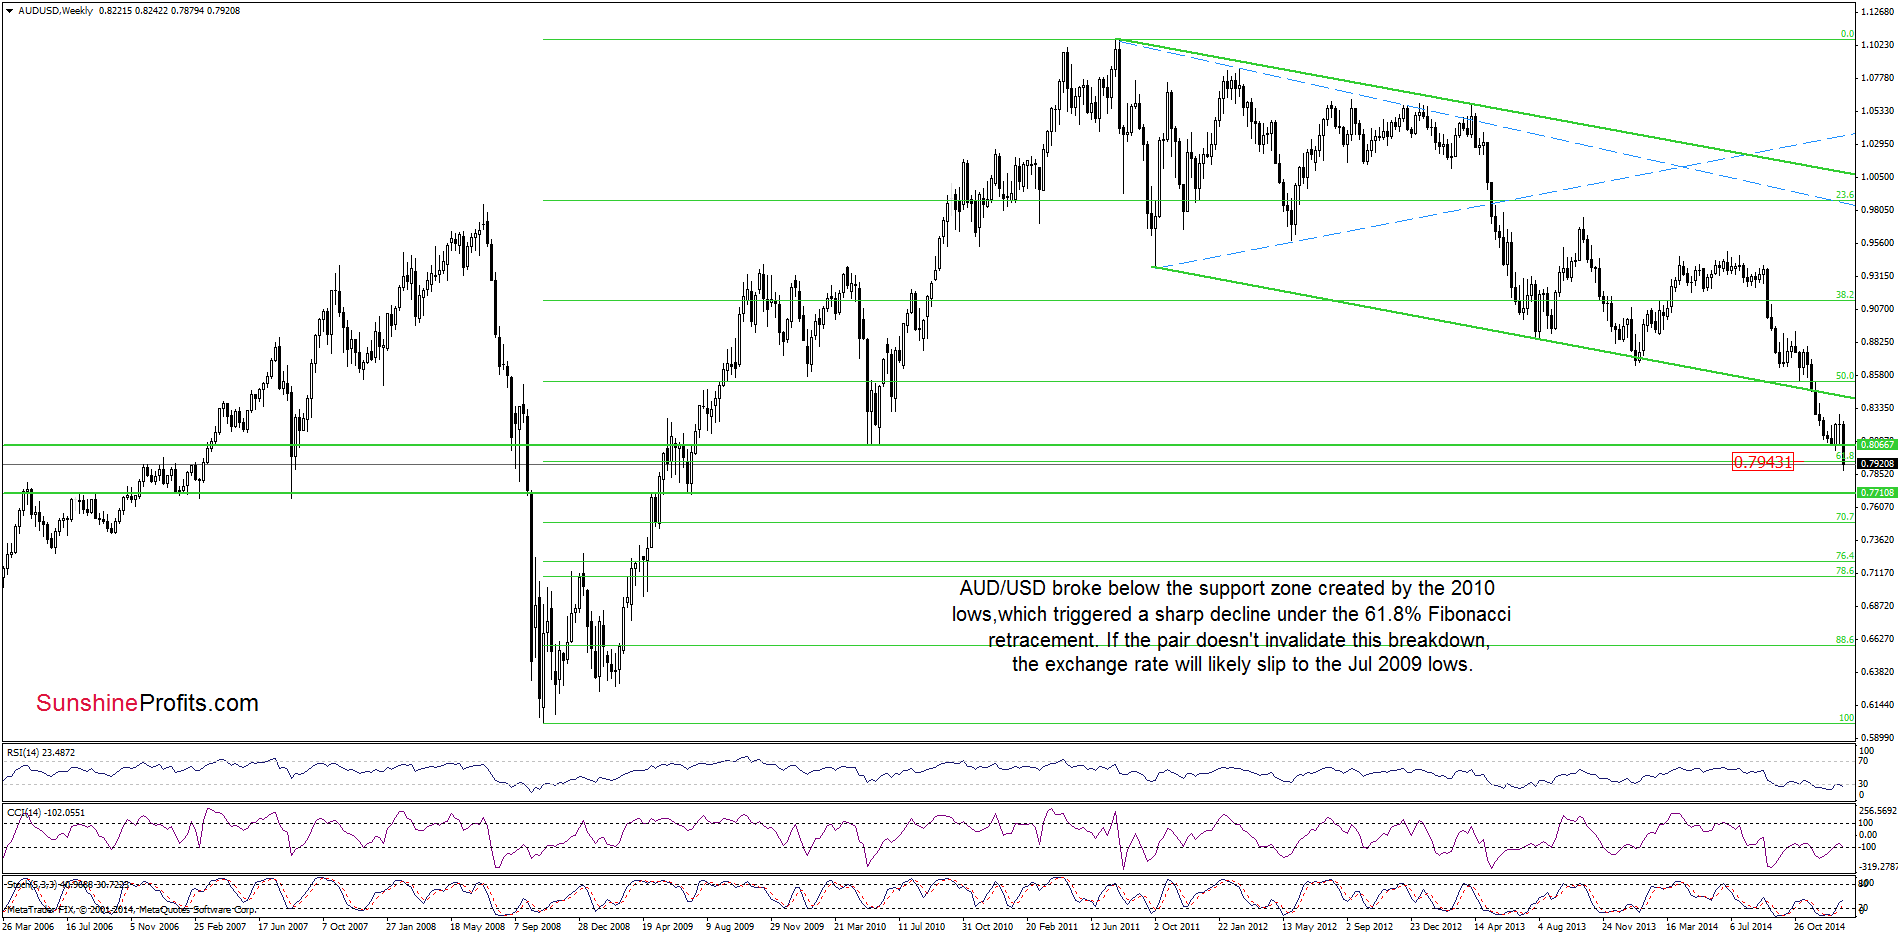
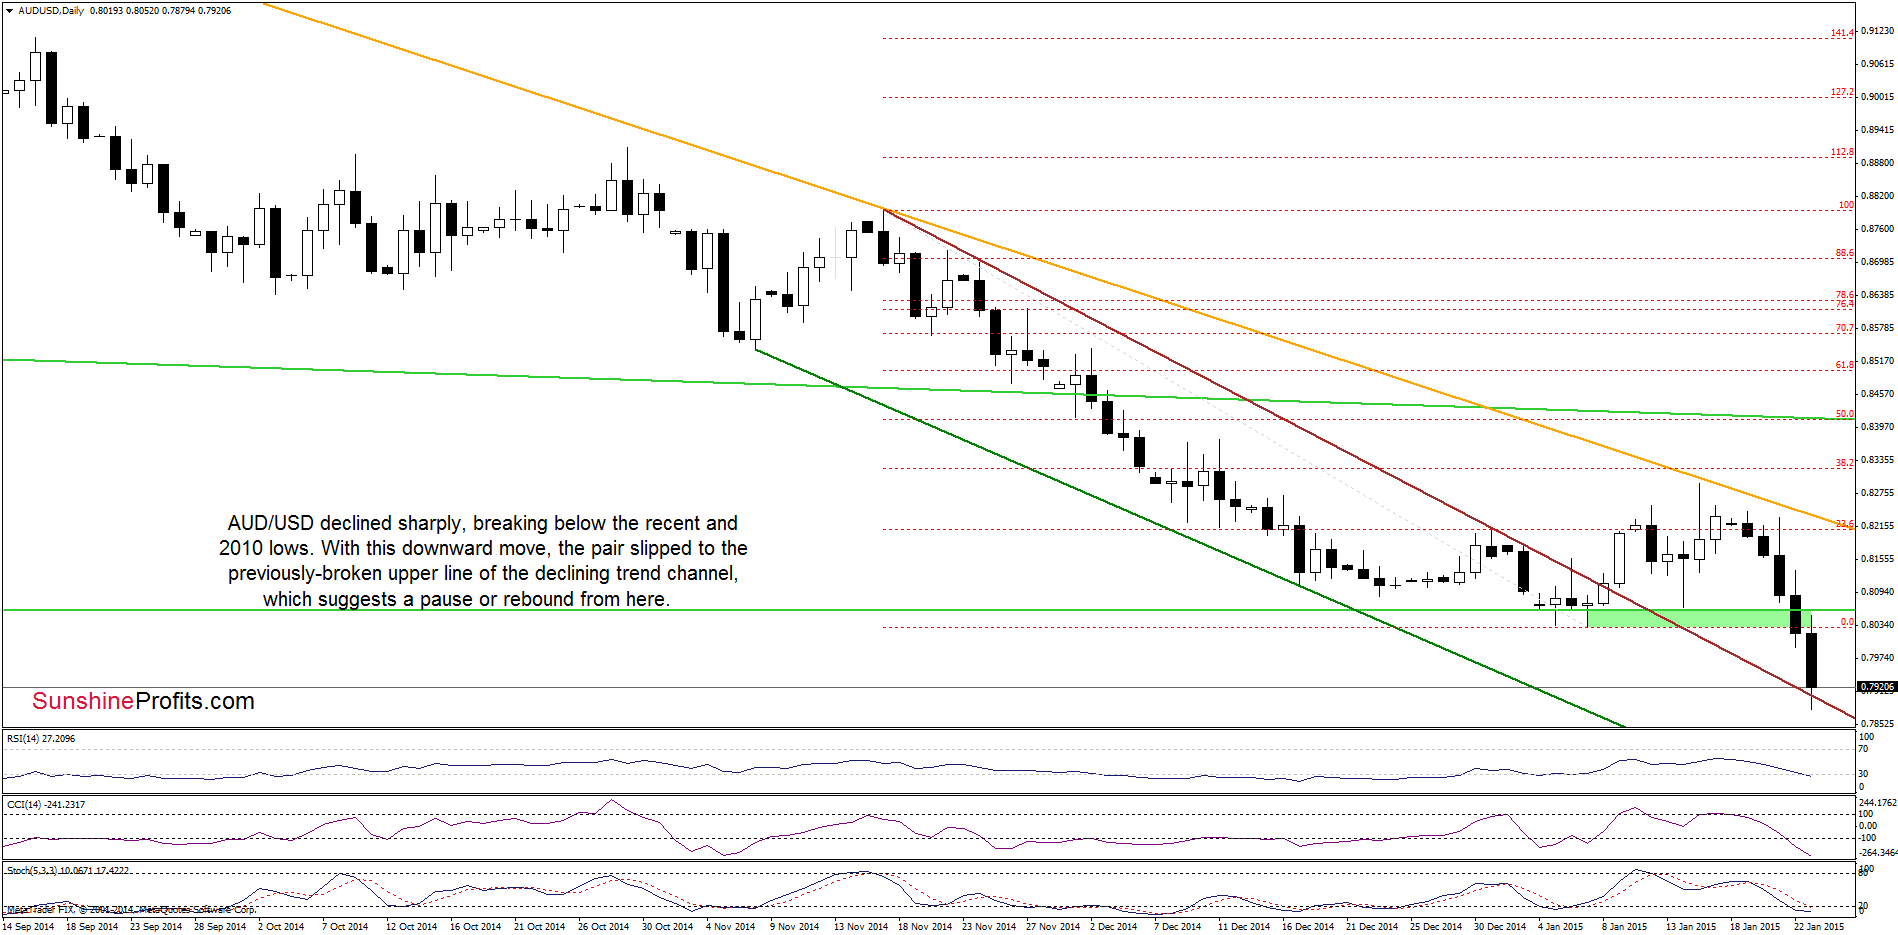
Yesterday, AUD/USD extended declines and broke below the recent and 2010 lows. Earlier today, the pair verified the breakdown, which triggered further deterioration and a drop to slightly below the 61.8% Fibonacci retracement based on the entire 2008-2011 rally. As you see on the daily chart, with this downward move, the exchange rate slipped to the previously-broken upper line of the declining trend channel (marked with brown on the daily chart). Taking this fact into account, and combining it with the current position of the indicators (they are oversold), it seems that we’ll see a pause or rebound from here in the coming day(s) (in our opinion, this scenario will be even more likely if the pair invalidates the breakdown under the 61.8% Fibonacci retracement).
Very short-term outlook: mixed with bullish bias
Short-term outlook: mixed with bullish bias
MT outlook: mixed
LT outlook: mixed
Trading position (short-term; our opinion): No positions are justified from the risk/reward perspective at the moment. We will keep you informed should anything change, or should we see a confirmation/invalidation of the above.
Thank you.
Nadia Simmons
Forex & Oil Trading Strategist
Przemyslaw Radomski, CFA
Founder, Editor-in-chief
Gold & Silver Trading Alerts
Forex Trading Alerts
Oil Investment Updates
Oil Trading Alerts

