
Earlier today, the European Central Bank launched its large-scale buying of government bonds, a policy known as quantitative easing program. ECB will purchase €60 billion per month, starting in March and continuing until late 2016. Additionally, ECB kept its main lending rate unchanged at 0.05% and a separate rate on overnight bank deposits stored with the central bank at minus 0.2%, which means that banks will have to pay a fee to keep surplus funds at the ECB. In these circumstances, EUR/USD declined sharply, approaching the recent low. What’s next?
In our opinion the following forex trading positions are justified - summary:
- EUR/USD: none
- GBP/USD: none
- USD/JPY: none
- USD/CAD: none
- USD/CHF: none
- AUD/USD: long (stop loss: 0.7940; initial upside target: 0.8320)
EUR/USD
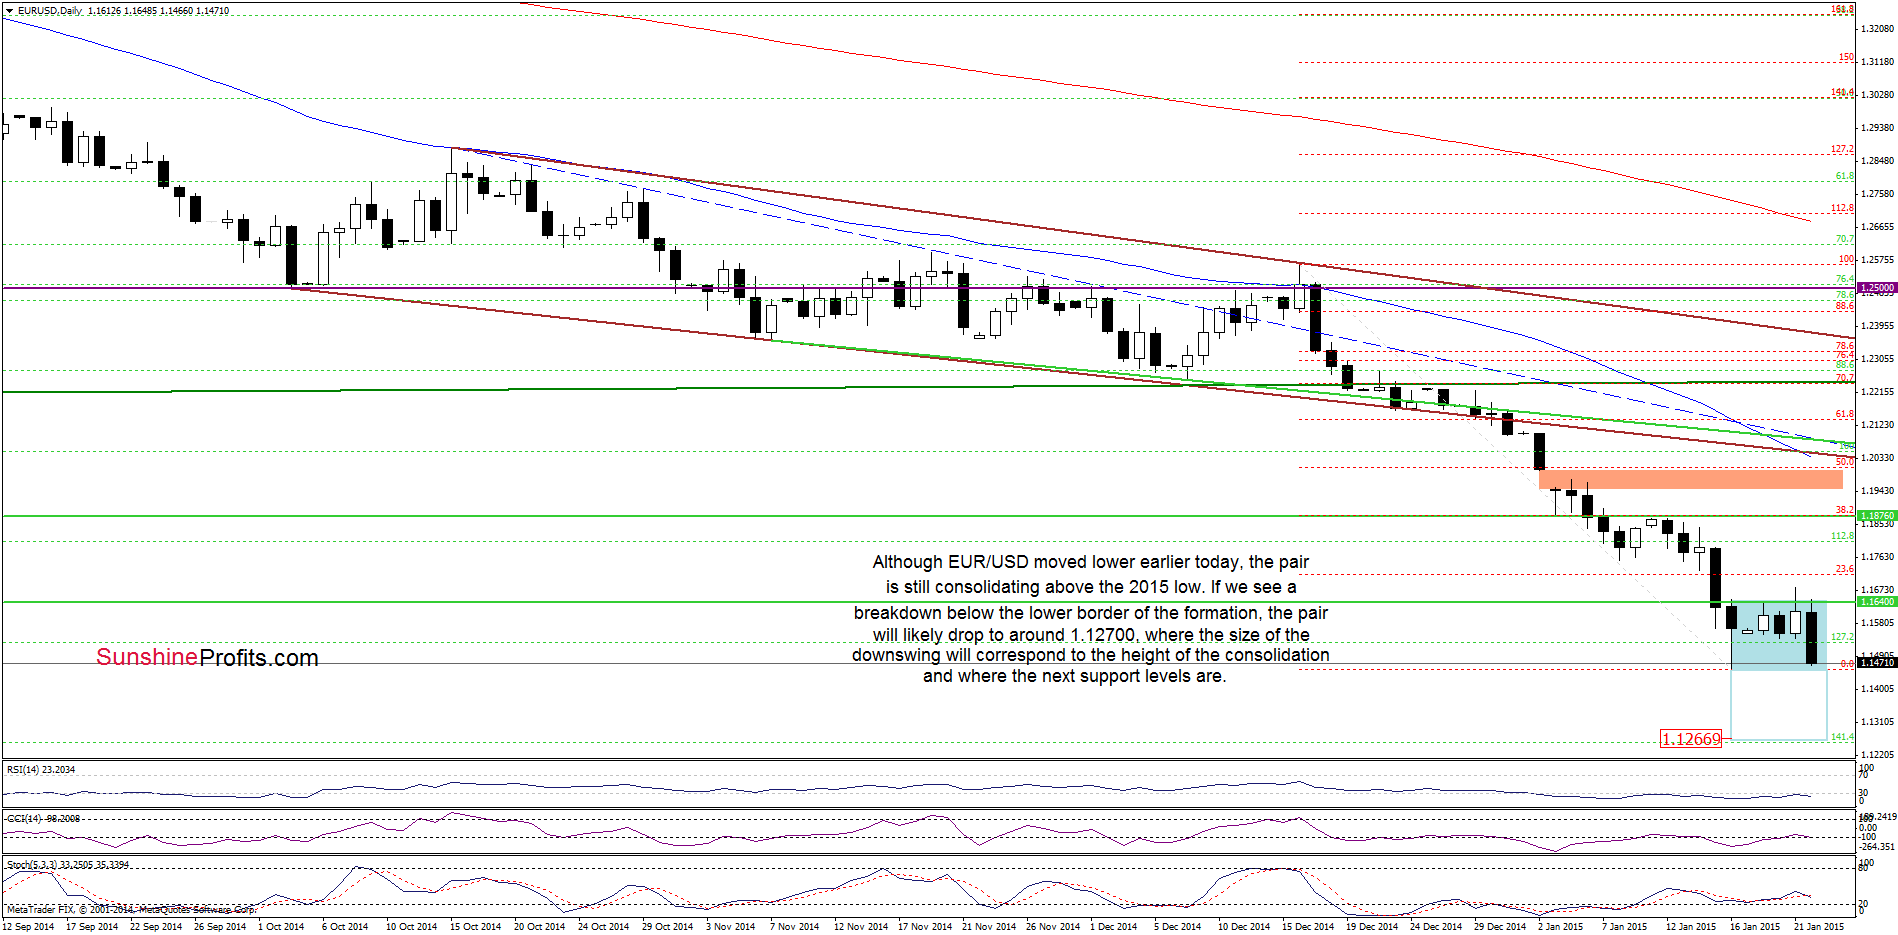
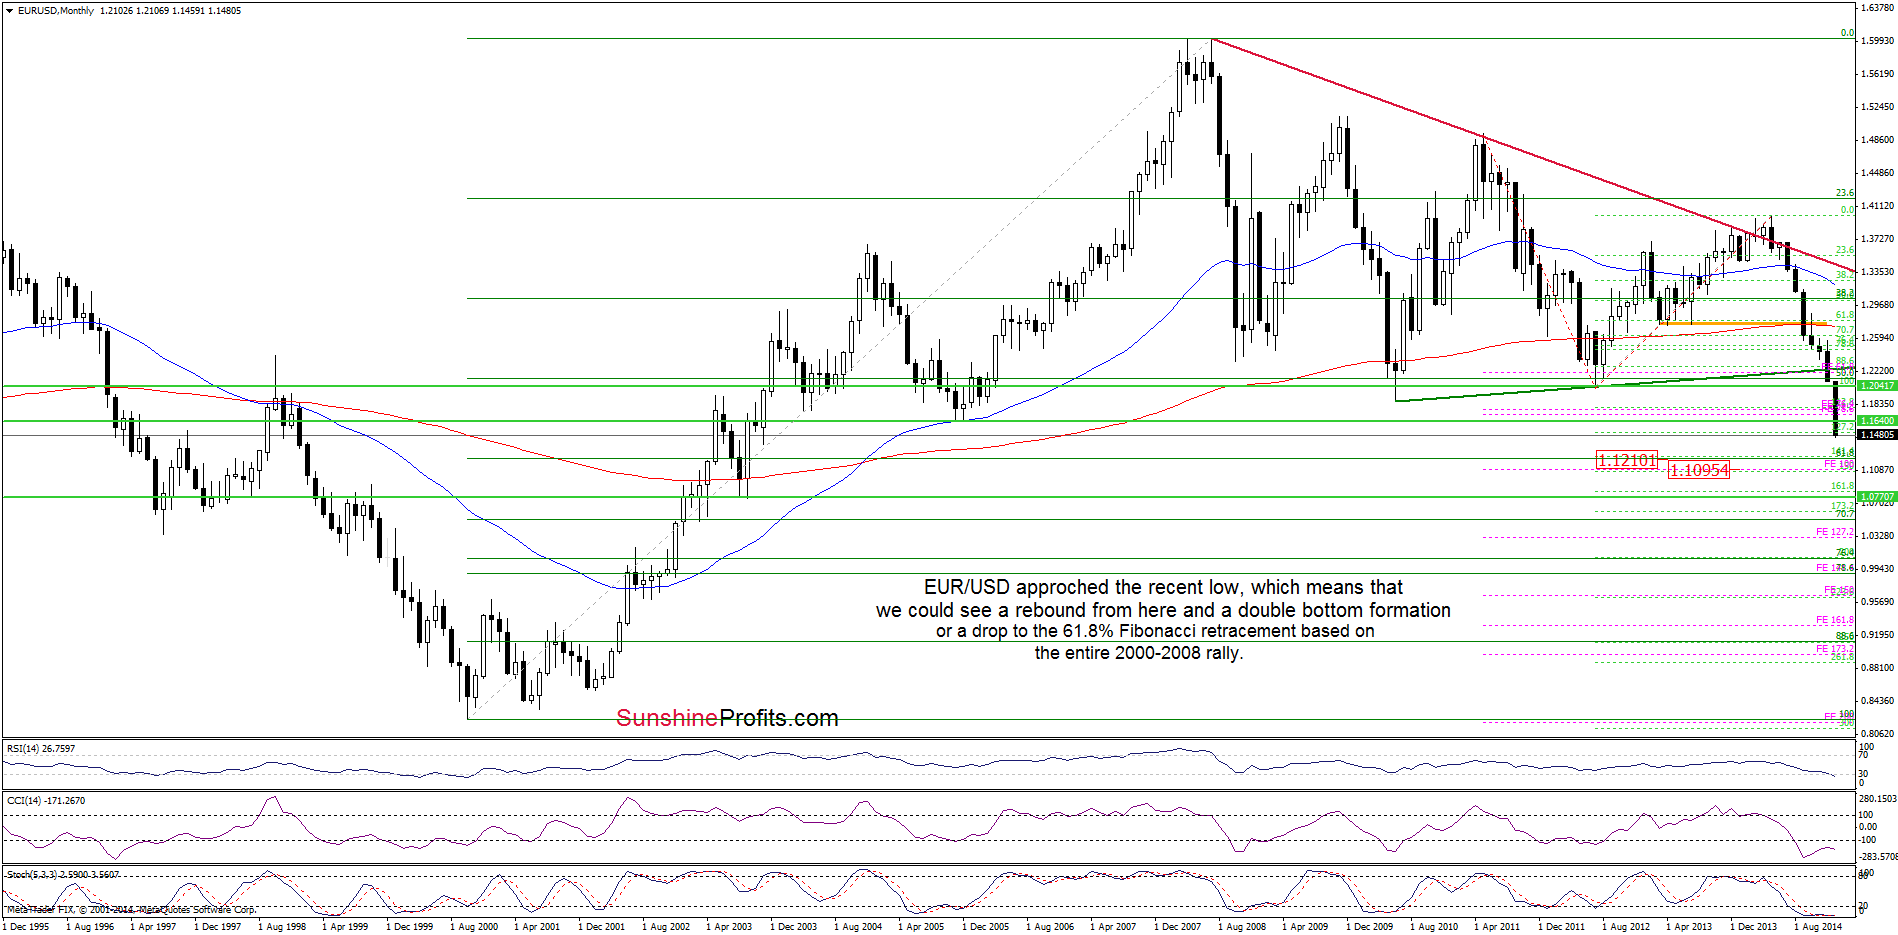
As you see on the daily chart, although EUR/USD moved higher earlier today, the key resistance based on the Nov 2005 low stopped further improvement (similarly to what we saw in previous days) and triggered a sharp pullback to the recent low. This is the palace where we should consider two scenarios. On one hand, if the 2015 low withstands the selling pressure, the pair will likely rebound from here and we’ll see a post double-bottom rally. On the other hand, if the exchange rate breaks below the lower border of the consolidation (marked with blue), EUR/USD will decline to around 1.12700, where the size of the downward move will correspond to the height of the formation and where the 141.4% Fibonacci extension is. Additionally, slightly below this area is also the 61.8% Fibonacci retracement based on the entire 2000-2008 rally (marked on the weekly chart below).
Very short-term outlook: mixed
Short-term outlook: mixed
MT outlook: mixed
LT outlook: mixed
Trading position (short-term): In our opinion, no positions are justified from the risk/reward perspective at the moment. We will keep you informed should anything change, or should we see a confirmation/invalidation of the above.
GBP/USD
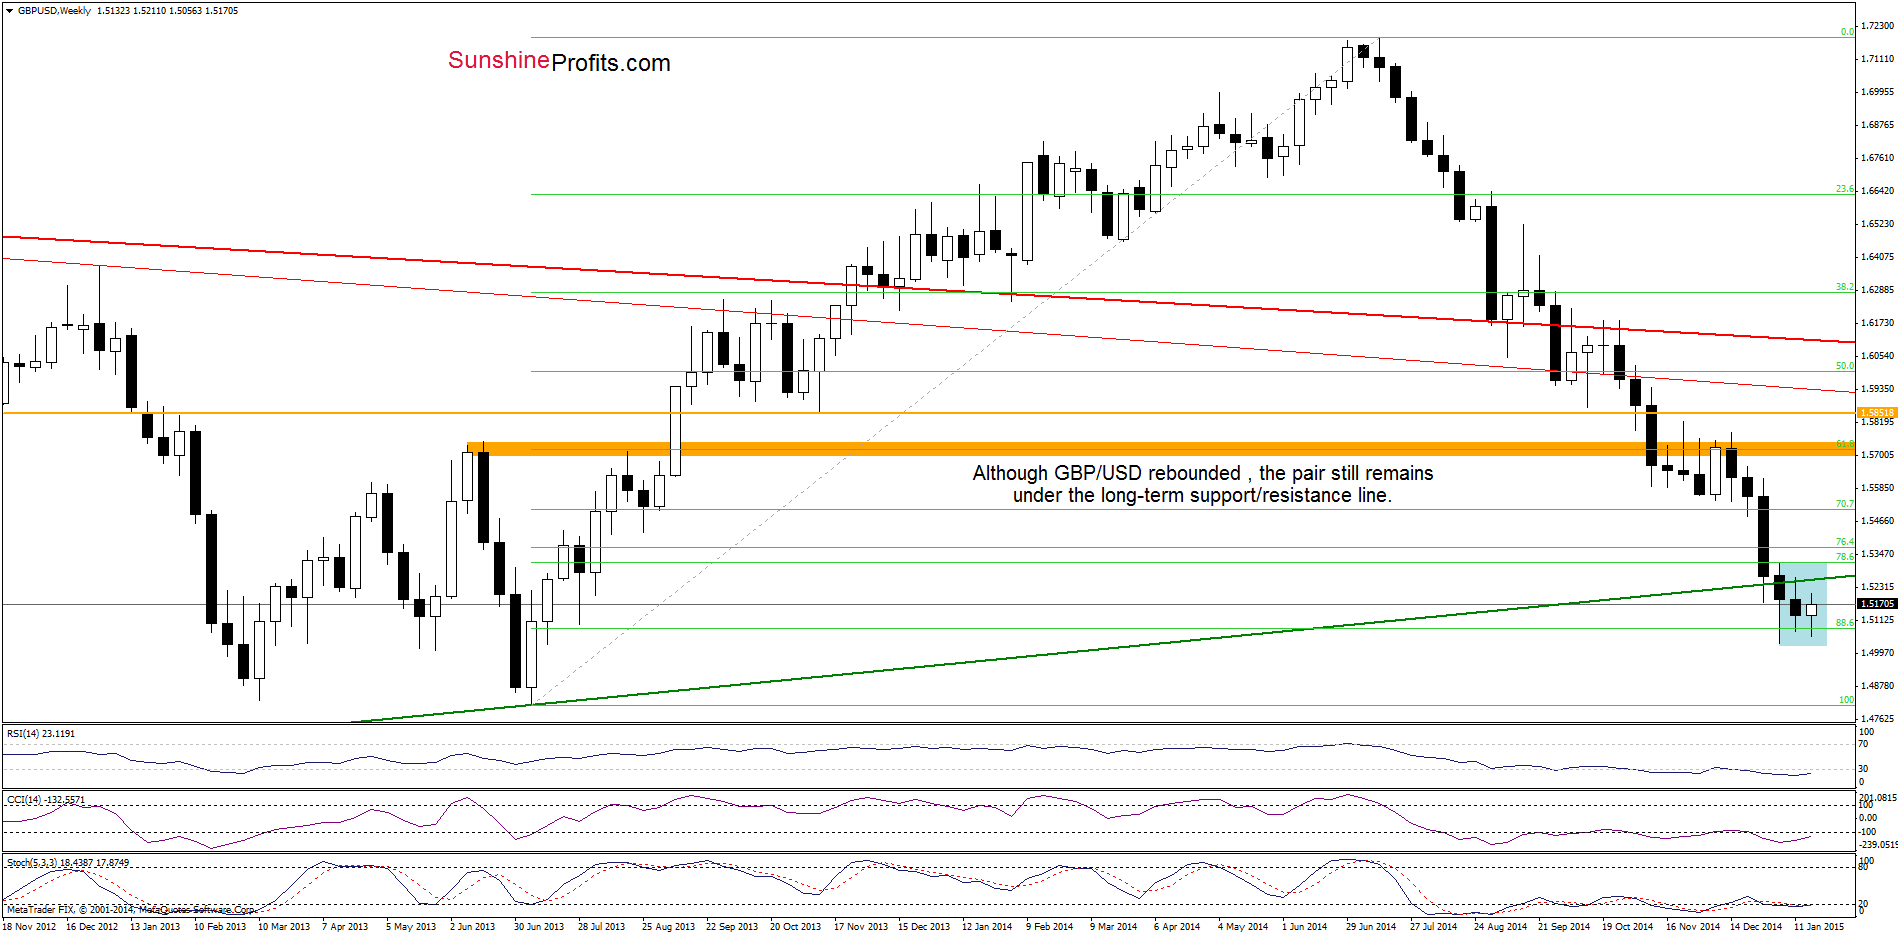
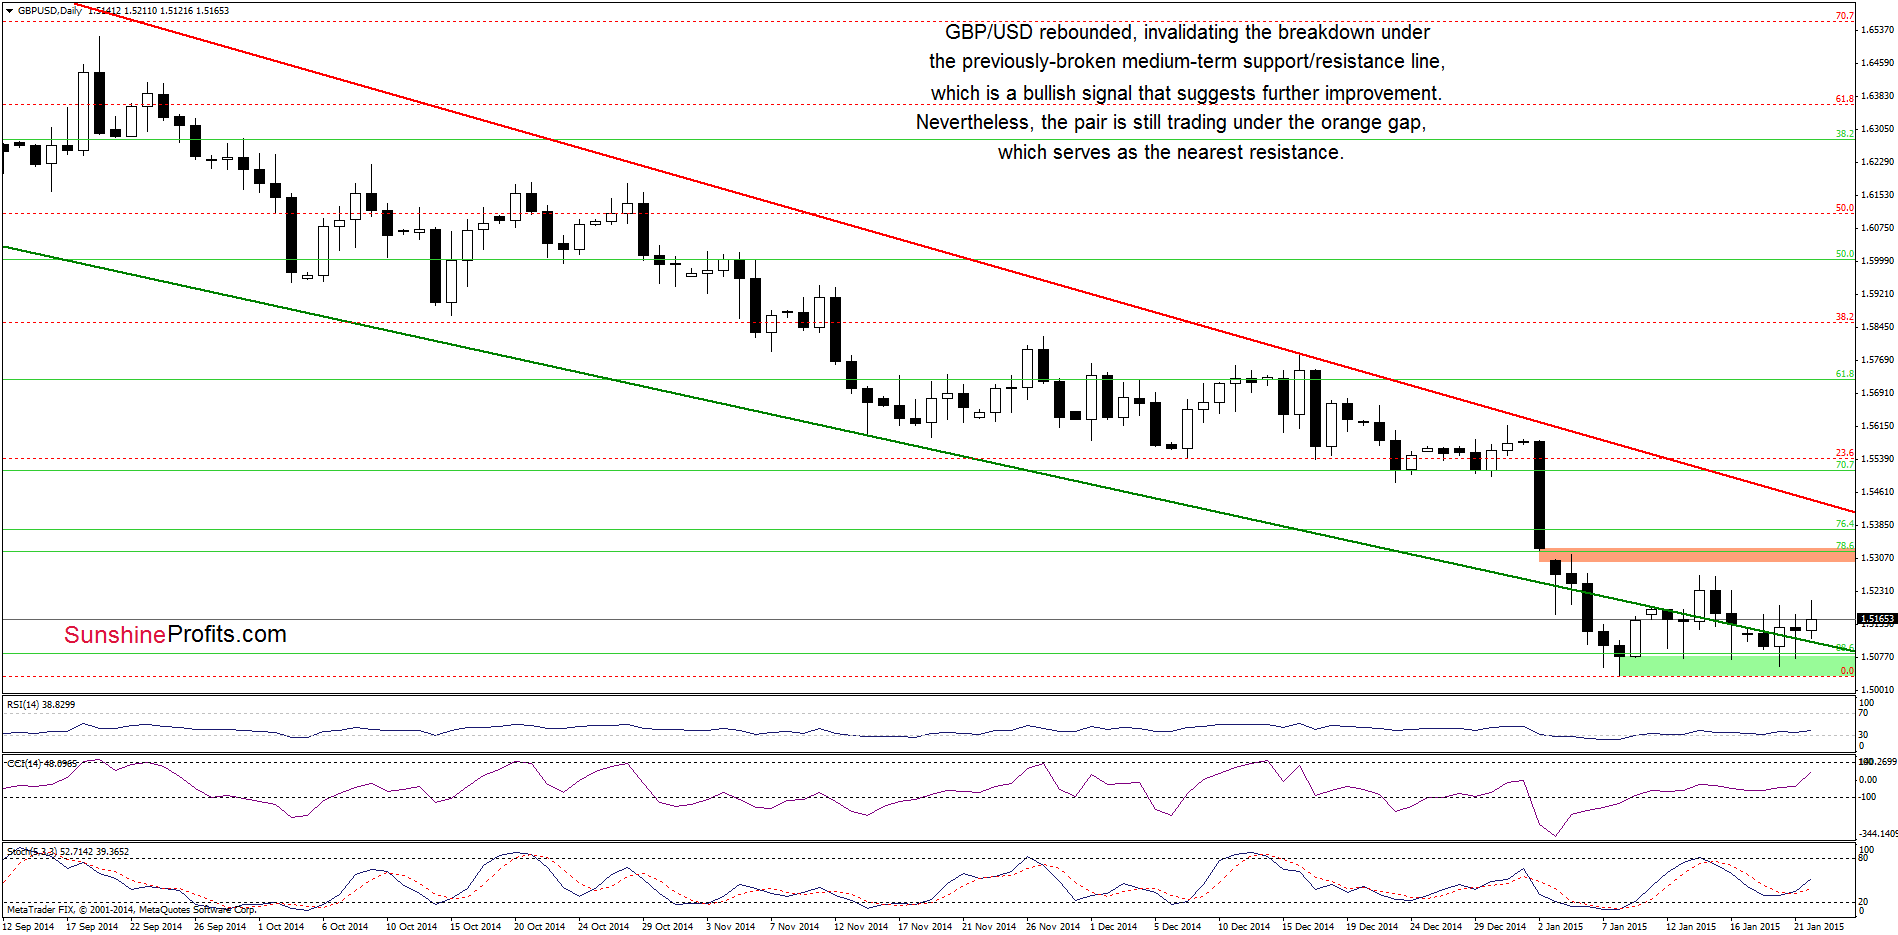
From the daily perspective, we see that GBP/USD moved higher once again and invalidated the breakdown below the medium-term green support/resistance line. Although this is a bullish signal, which suggests further improvement, we saw similar price action in the previous week. Back then, the long-term resistance line (marked on the weekly chart) and the proximity to the orange gap (seen on the daily chart) successfully stopped currency bulls, which translated to lower values of the exchange rate. Taking this fact into account, we think that as long as there is no invalidation of the breakdown below them, further improvement and a sizable upward move is questionable. Nevertheless, if we see such price action, we’ll consider opening long positions. Until this time, waiting on the sidelines for a profitable opportunity is the best choice.
Very short-term outlook: mixed
Short-term outlook: mixed
MT outlook: mixed
LT outlook: mixed
Trading position (short-term): In our opinion, no positions are justified from the risk/reward perspective at the moment. We will keep you informed should anything change, or should we see a confirmation/invalidation of the above.
USD/CAD
Quoting our Forex Trading Alert posted on Tuesday:
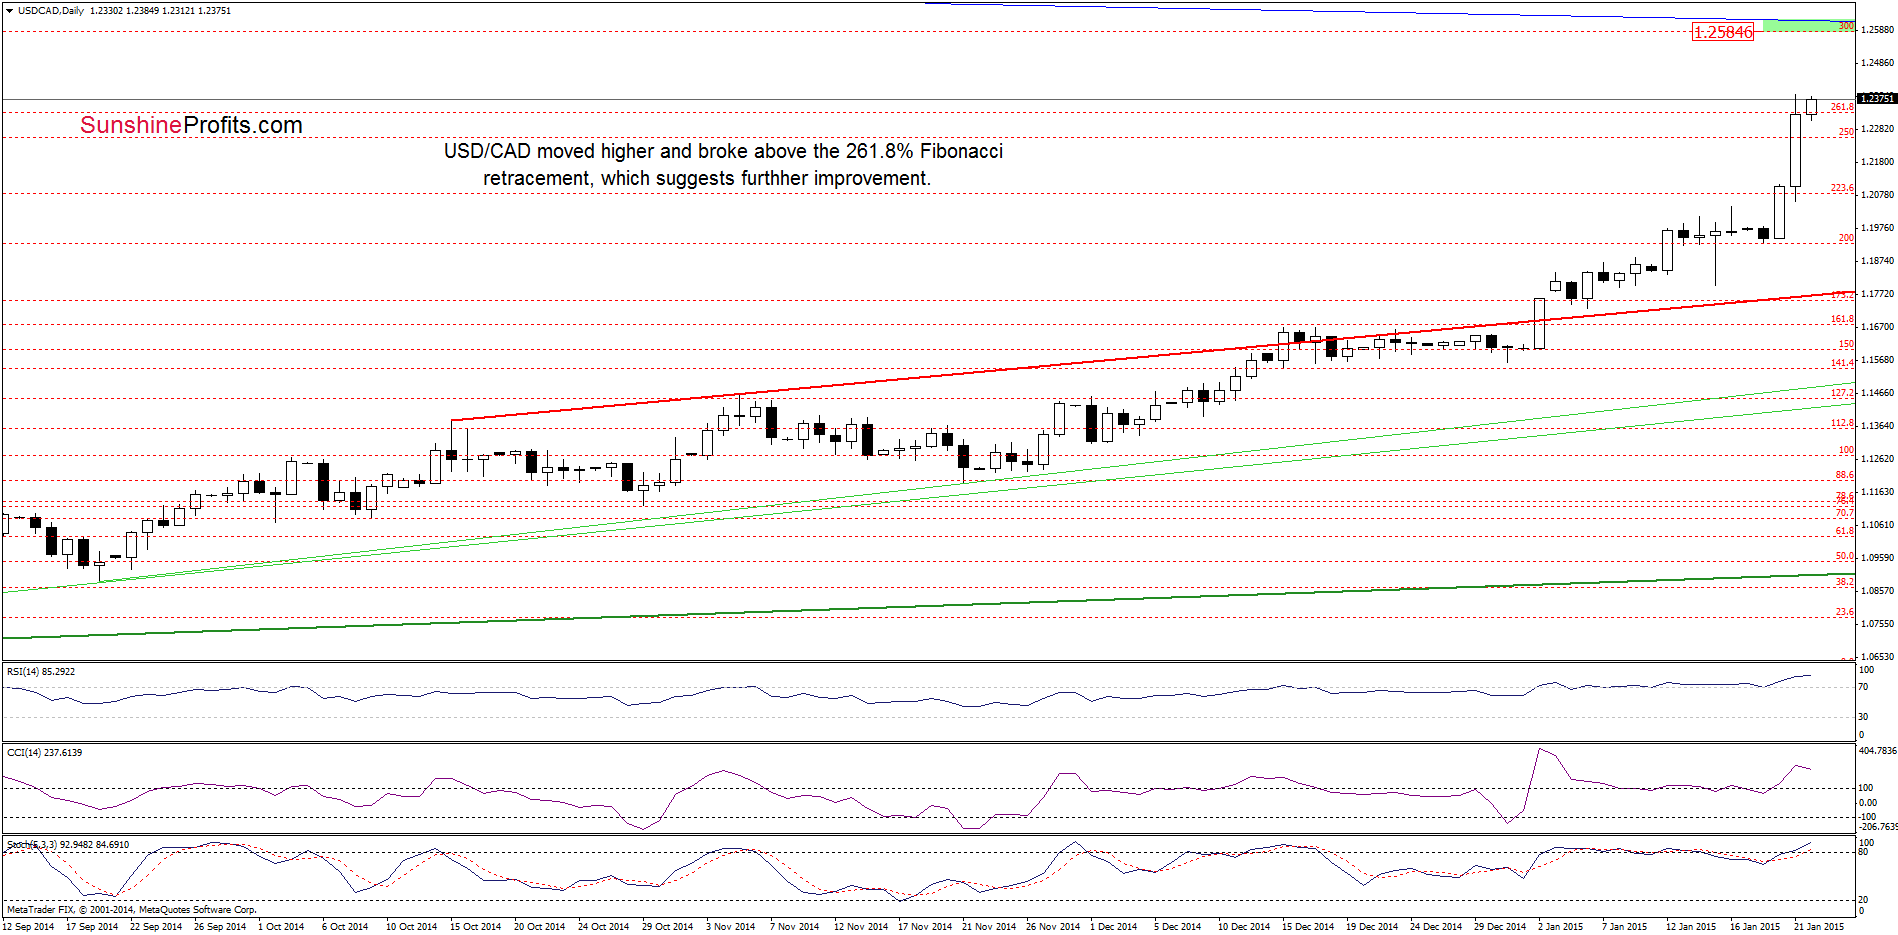
(…) What’s next? In our opinion, if the exchange tare moves higher, we’ll likely see an increase to around 1.2260, where the 250% Fibonacci extension is. However, taking into account a breakout above the 70.7% Fibonacci retracement, it seems that we could see a rally even to 1.2186-1.2265, where the orange resistance zone (marked on the weekly chart) is.
Looking at the daily chart, we see that USD/CAD not only climbed to our upside target, but also increased above the 261.8% Fibonacci extension, which is a bullish signal. How did this rally affected the medium-term picture? Let’s check.
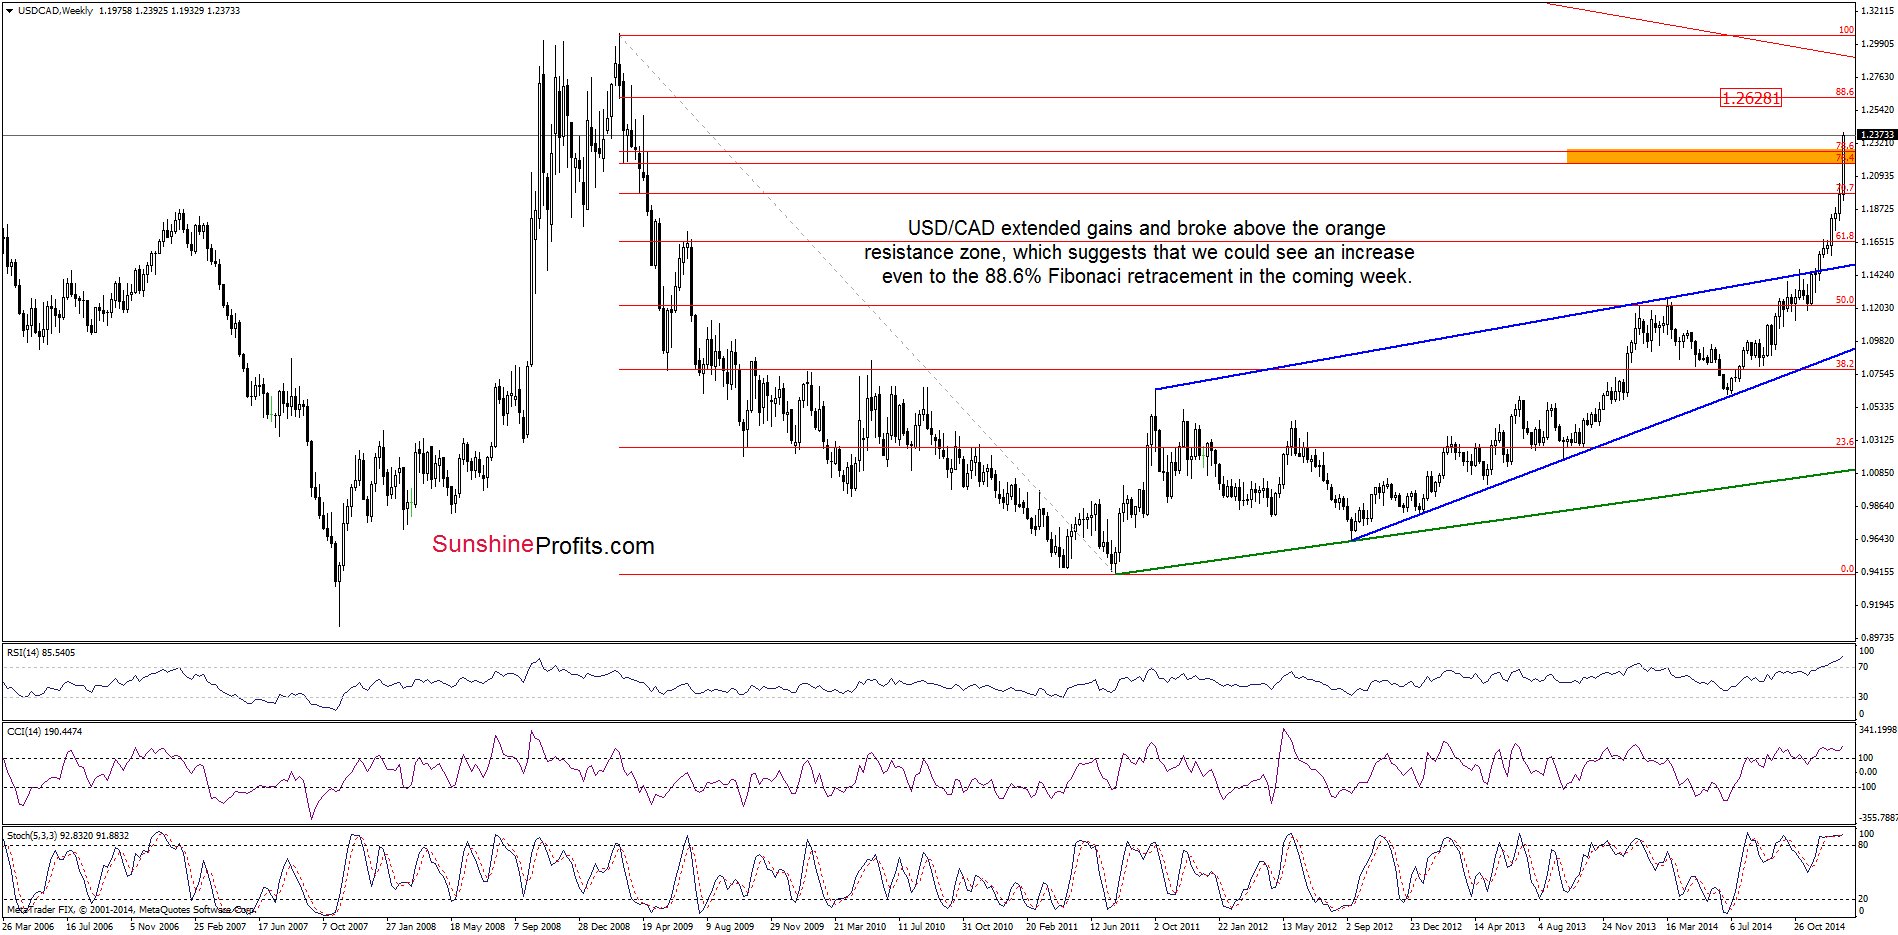
From this perspective, we see that USD/CAD broke above the orange resistance zone which suggests further improvement and an increase to around 1.2628, where the 88.6% Fibonacci retracement is. Nevertheless, before currency bulls realize this scenario, they will have to push the pair above 1.2585-1.2600, where the nearest resistance zone (created by the 300% Fibonacci extension and the long-term blue line based on the Jan 2002 and Sep 2002 highs) is.
Very short-term outlook: bullish
Short-term outlook: mixed with bullish bias
MT outlook: mixed
LT outlook: mixed
Trading position (short-term; our opinion): No positions are justified from the risk/reward perspective at the moment. We will keep you informed should anything change, or should we see a confirmation/invalidation of the above.
Thank you.
Nadia Simmons
Forex & Oil Trading Strategist
Przemyslaw Radomski, CFA
Founder, Editor-in-chief
Gold & Silver Trading Alerts
Forex Trading Alerts
Oil Investment Updates
Oil Trading Alerts

