
Earlier today, Statistics Canada reported that manufacturing sales declined 1.4% in November, missing expectations for a 0.5% drop. Thanks to these disappointing numbers, USD/CAD extended gains and climbed to a fresh 2015 high. How high could the exchange rate go?
In our opinion the following forex trading positions are justified - summary:
- EUR/USD: none
- GBP/USD: none
- USD/JPY: none
- USD/CAD: none
- USD/CHF: none
- AUD/USD: long (stop loss: 0.7940; initial upside target: 0.8320)
EUR/USD
Quoting our Forex Trading Alert posted on Thursday:
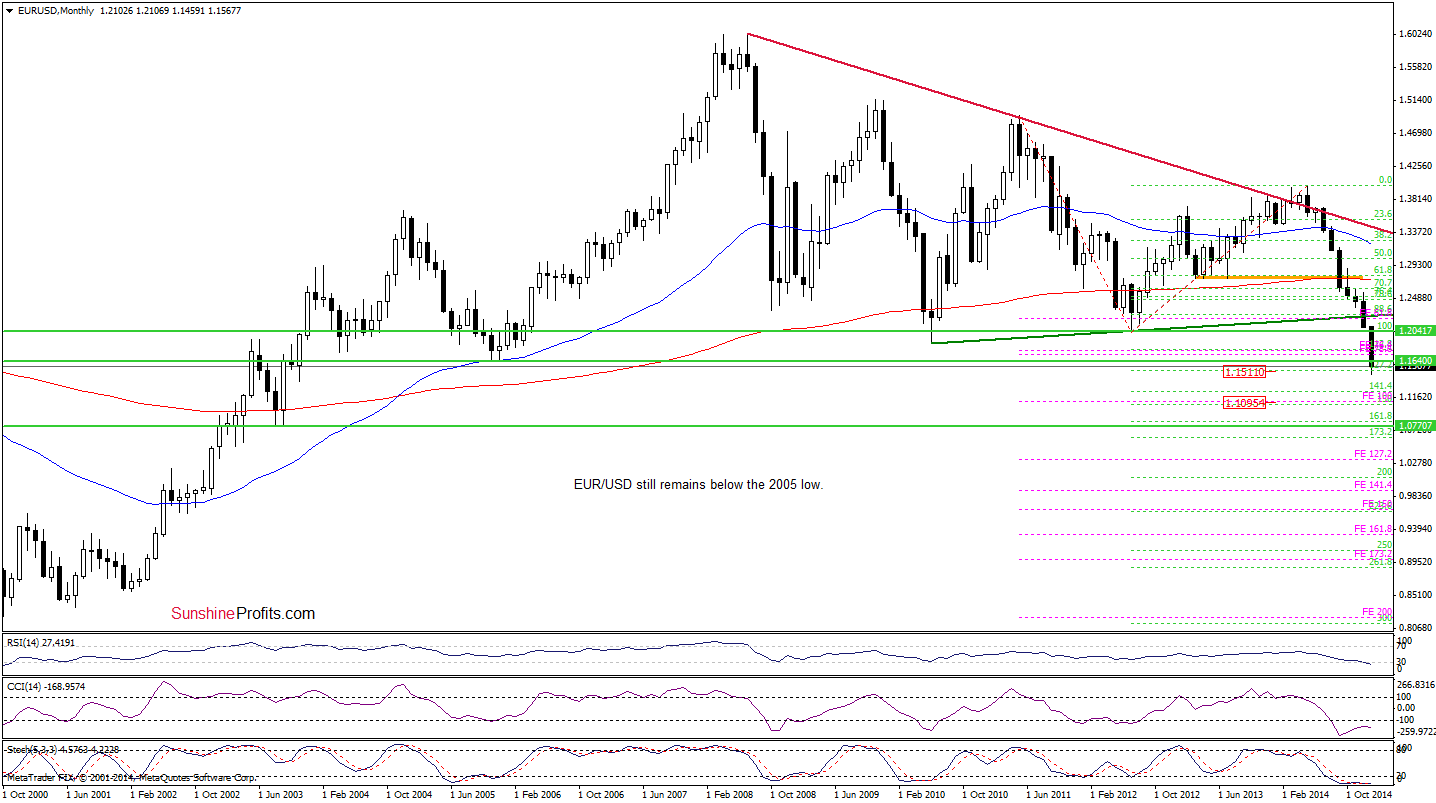
The situation in the medium term has deteriorated as EUR/USD (…) dropped to slightly below the Nov 2005 low of 1.16400. This is a bearish signal, which suggests that (…) the next downside target would be around 1.15110, where the 127.2% Fibonacci extension (based on the 2012-2014 rally) is.
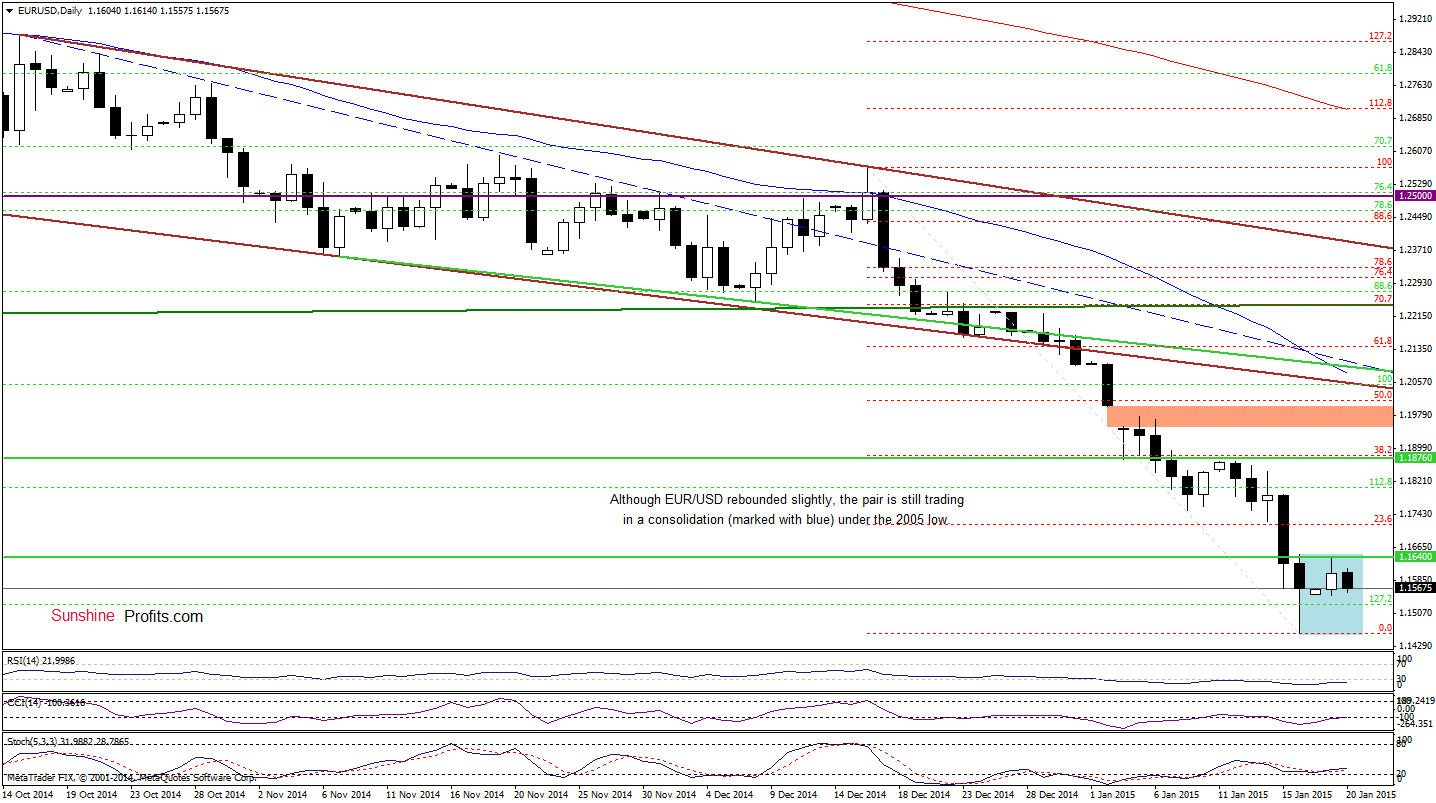
Looking at the daily chart, we see that the situation developed in line with the above-mentioned scenario as EUR/USD moved sharply lower and reached our downside target after Friday’s alert was posted. Although the exchange rate rebounded slightly on the following trading days, the pair is still trading under the previously-broken 2005 low. In our opinion, as long as there is no invalidation of the breakdown, higher values of the exchange rate are not likely to be seen and another test of the 127.2% Fibonacci extension should not surprise us. However, taking into account the current position of the daily indicators (they all generated buy signals), it seems that currency bulls will try to push EUR/USD higher in the coming days. In this case, if we see an invalidation of the breakdown under the 2005 low, the initial upside target would be around 1.1876, where the previously-broken 2010 low and the 38.2% Fibonacci retracement (based on the Dec-Jan decline) are.
Very short-term outlook: mixed
Short-term outlook: mixed
MT outlook: mixed
LT outlook: mixed
Trading position (short-term): In our opinion, no positions are justified from the risk/reward perspective at the moment. We will keep you informed should anything change, or should we see a confirmation/invalidation of the above.
USD/JPY
The situation in the medium-term hasn’t changed much as USD/JPY is still trading under the 61.8% Fibonacci retracement. What can we infer from the daily chart? Let’s check.
On Friday, we wrote the following:
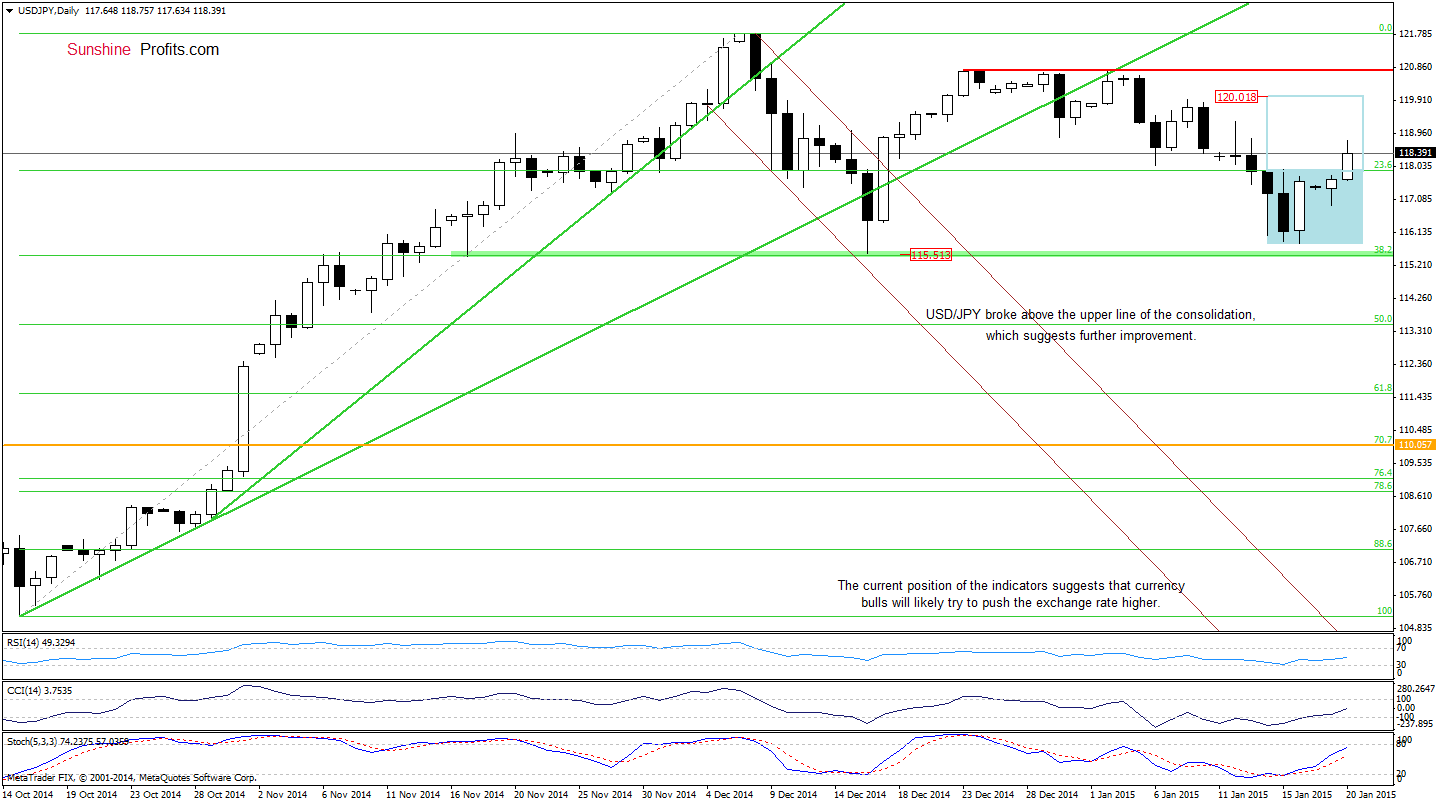
(…) the exchange rate approached our downside target area, which triggered a rebound earlier today. Taking this fact into account, and combining it with the current position of the indicators (the Stochastic Oscillator generated a buy signal, while the CCI is close to doing it), it seems that currency bulls will try to push the exchange higher in the coming day(s). If this is the case, the initial upside target would be the previously-broken 23.6% Fibonacci retracement and yesterday’s high of 117.93.
As you see on the daily chart, currency bulls not only pushed the exchange rate to our upside target, but also triggered a breakout above the upper line of the consolidation (marked with blue). This is a positive signal, which suggests further improvement – especially when we factor in buy signals generated by the indicators. If this is the case, the initial upside target would be around 120, where the size of the upswing will correspond to the height of the formation and where the Jan 8 high is.
Very short-term outlook: bullish
Short-term outlook: mixed
MT outlook: mixed
LT outlook: bullish
Trading position (short-term; our opinion): No positions are justified from the risk/reward perspective at the moment. We will keep you informed should anything change, or should we see a confirmation/invalidation of the above.
USD/CAD
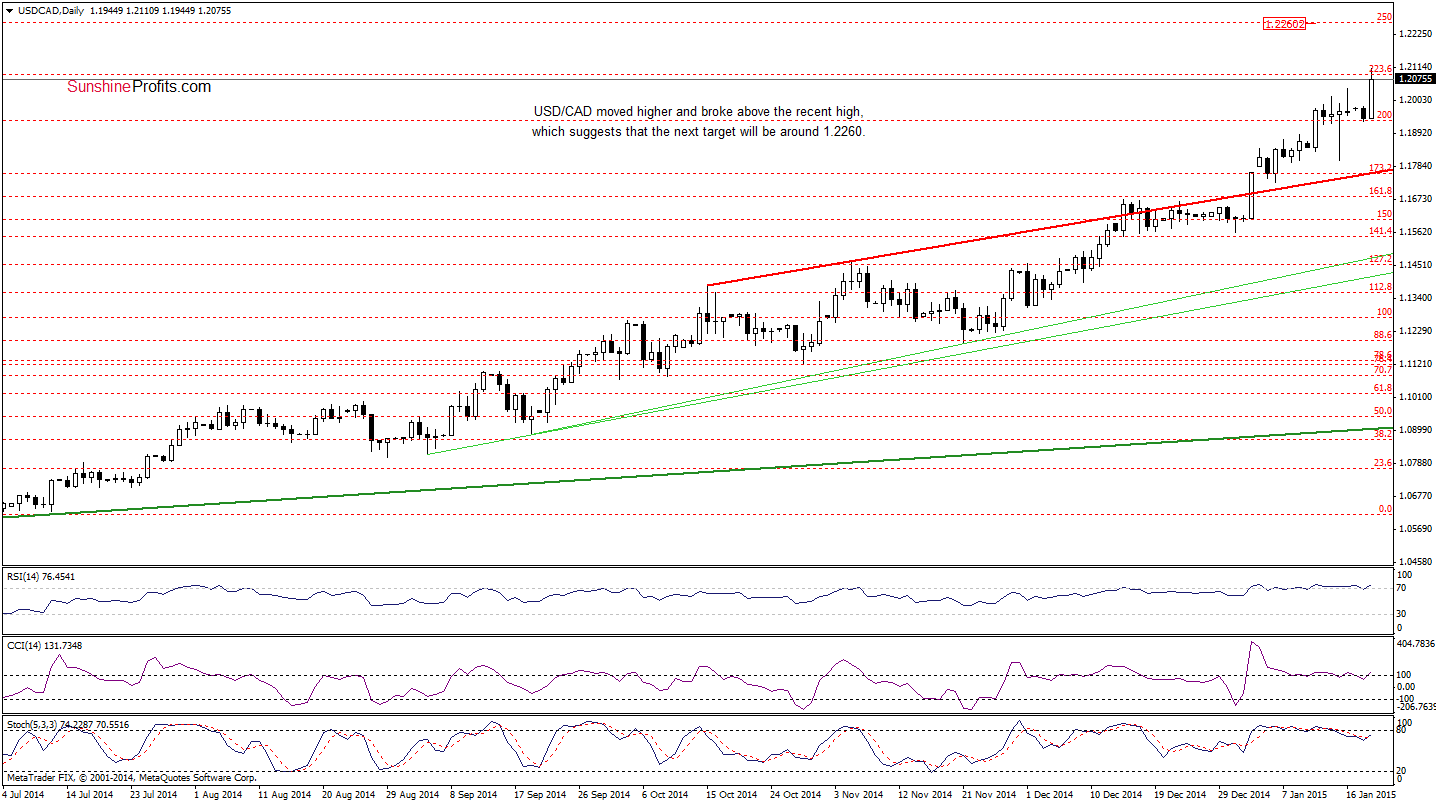
In our last commentary on this currency pair, we wrote:
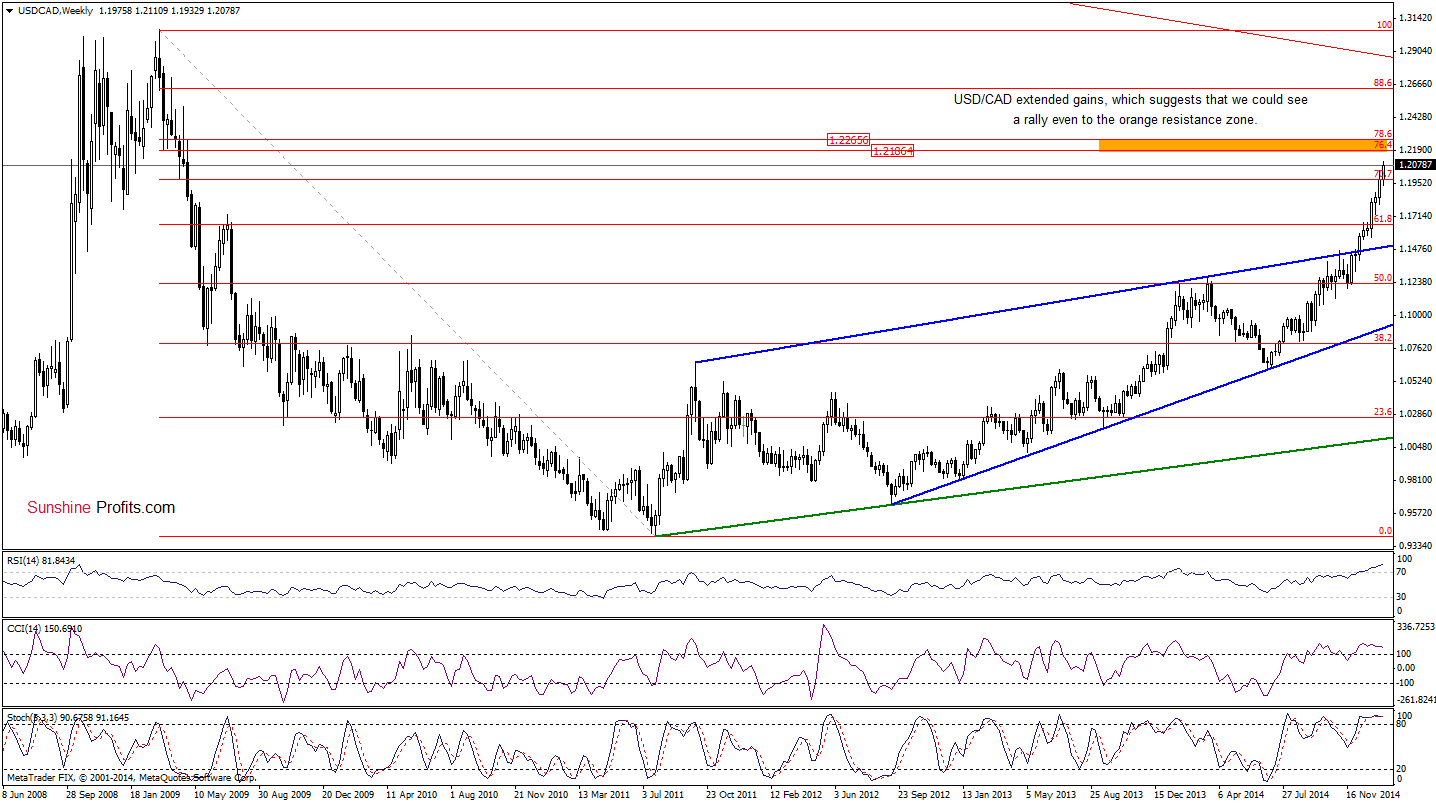
(…) the exchange rate broke above the recent high earlier today, which suggests further improvement and an increase to around 1.2084, where the 223.6% Fibonacci extension is.
On the daily chart, we see that the situation developed in tune with the above-mentioned scenario and USD/CAD reached our upside target. What’s next? In our opinion, if the exchange tare moves higher, we’ll likely see an increase to around 1.2260, where the 250% Fibonacci extension is. However, taking into account a breakout above the 70.7% Fibonacci retracement, it seems that we could see a rally even to 1.2186-1.2265, where the orange resistance zone (marked on the weekly chart) is. Nevertheless, we should keep in mind that there are negative divergences between the exchange rate and the indicators, which suggests that a pause or correction is just around the corner.
Very short-term outlook: bullish
Short-term outlook: mixed with bullish bias
MT outlook: mixed
LT outlook: mixed
Trading position (short-term; our opinion): No positions are justified from the risk/reward perspective at the moment. We will keep you informed should anything change, or should we see a confirmation/invalidation of the above.
Thank you.
Nadia Simmons
Forex & Oil Trading Strategist
Przemyslaw Radomski, CFA
Founder, Editor-in-chief
Gold & Silver Trading Alerts
Forex Trading Alerts
Oil Investment Updates
Oil Trading Alerts

