
Earlier today, the U.S. Commerce Department reported that retail sales declined by 0.9% in Dec, missing expectations for a drop of 0.1%. Additionally, core retail sales (without automobile sales) dropped by 1.0% in the previous month, disappointing forecasts for a 0.1% increase. Thanks to these numbers, USD/JPY declined below the recent lows. Where will the pair head next?
In our opinion the following forex trading positions are justified - summary:
- EUR/USD: none
- GBP/USD: none
- USD/JPY: none
- USD/CAD: none
- USD/CHF: long (stop loss: 0.7940; initial upside target: 0.8230)
EUR/USD
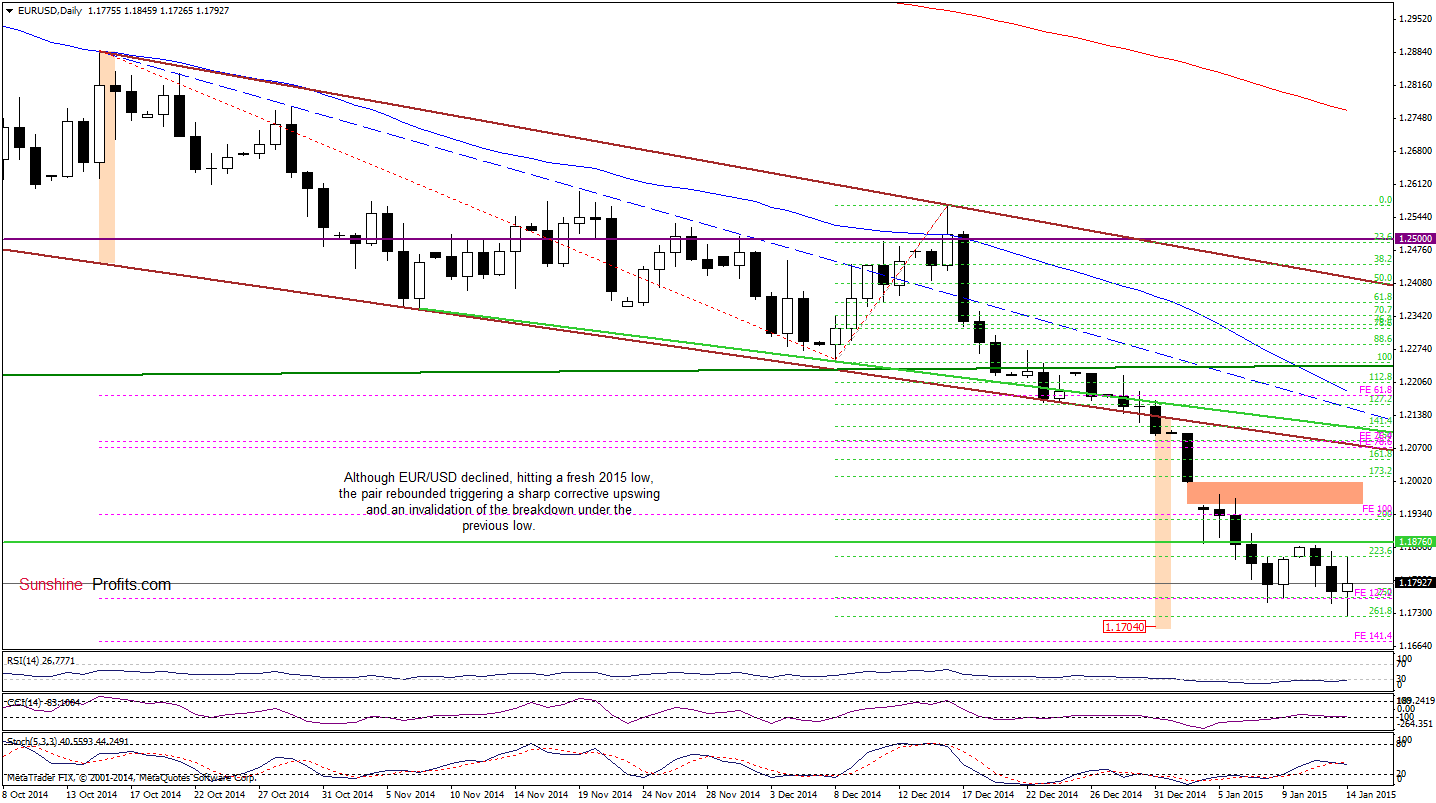
Looking at the daily chart, we see that EUR/USD extended losses and dropped to a fresh 2015 low. Despite this deterioration, the pair rebounded, invalidating the breakdown below the previous low and the support zone created by the 127.2% Fibonacci price projection and the 250% Fibonacci extension. Although this is a bullish signal, which suggests further improvement, we should keep in mind that the overall situation hasn’t changed much as EUR/USD still remains under the previously-broken 2010 low (which serves as the key resistance at the moment). Therefore, we think that as long as there is no invalidation of the breakdown below this important level higher values of the exchange rate are not likely to be seen and another attempt to move lower can’t be ruled out. At this point, it’s worth noting that even if the exchange rate drops once again, it seems that the space for further declines is limited. The reason? Let’s take a look at the weekly chart and find out.
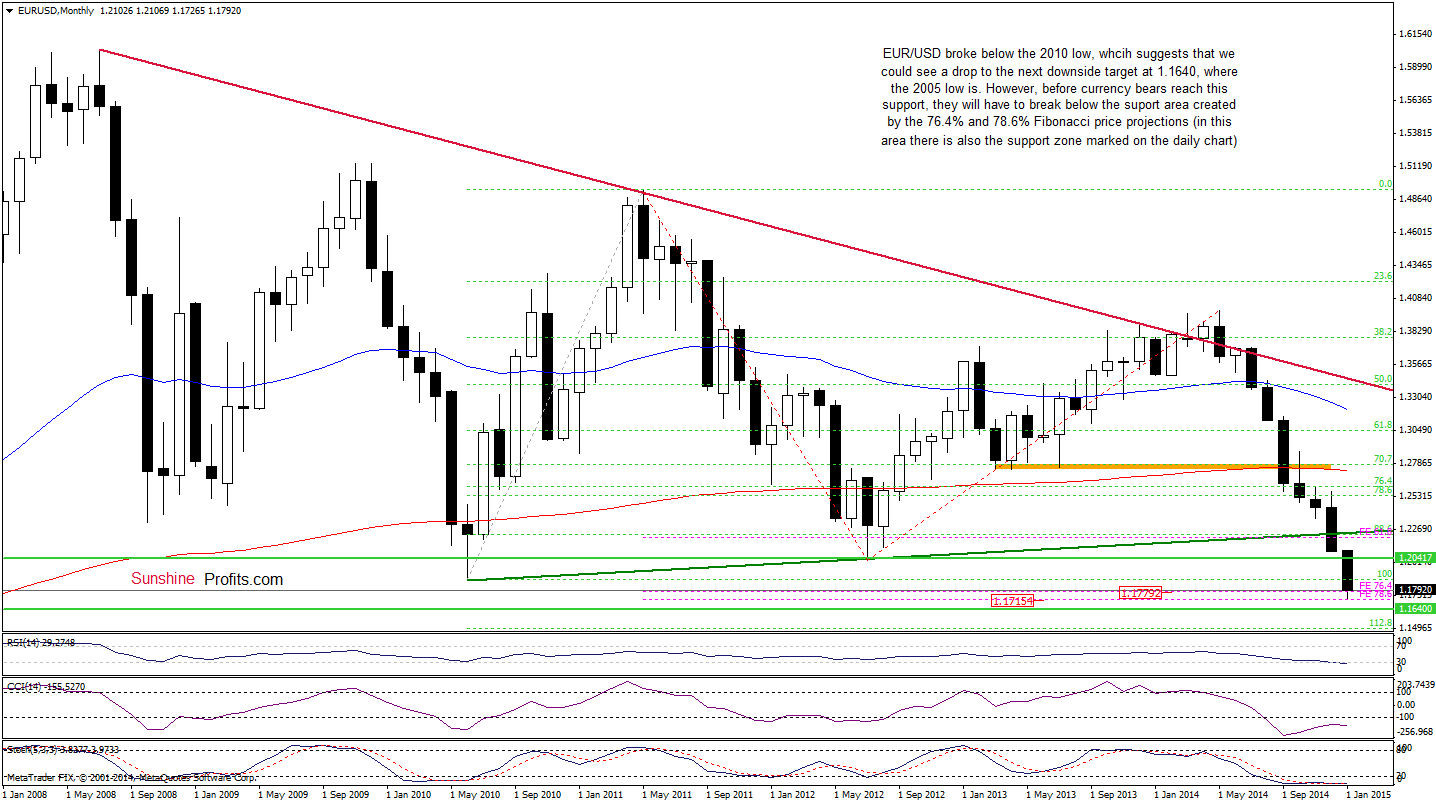
From this perspective, we see that EUR/USD is still trading in a narrow range between the 76.4% and 78.6% Fibonacci price projections. Therefore, we think that as long as the exchange rate remains above 1.17154, declines to the green support line based on the Nov 2005 low of 1.16400 are not a sure bet.
Very short-term outlook: mixed
Short-term outlook: mixed
MT outlook: mixed
LT outlook: mixed
Trading position (short-term): In our opinion, no positions are justified from the risk/reward perspective at the moment. However, if the pair invalidates the breakdown below the 2010 low, we’ll consider opening long positions. We will keep you informed should anything change, or should we see a confirmation/invalidation of the above.
USD/JPY
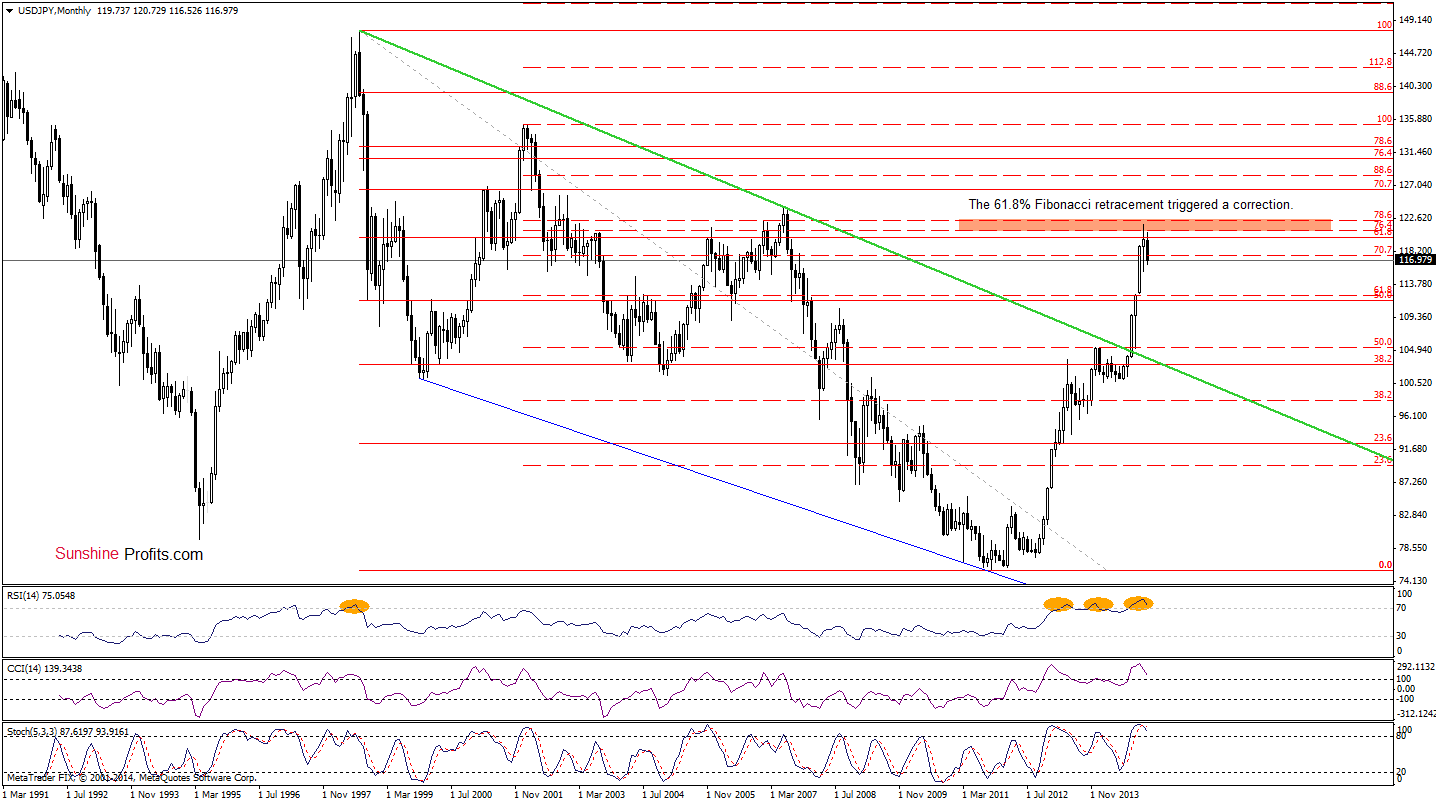
From the medium-term perspective, we see that the 61.8% Fibonacci retracement triggered a correction. How did this move affected the short-term picture? Let’s examine the daily chart and find out.
Quoting our last commentary on this currency pair:
(…) Firstly, the pair is still trading under the 61.8% Fibonacci retracement (based on the entire 1998-2011 declines), which successfully supports the resistance area marked on the daily chart. Secondly, although the USD Index hit fresh multi-year highs in the recent days, USD/JPY didn’t follow this move and still remains under the 2014 high. We saw similar price action at the beginning of Oct (marked with orange). Back then, such lack of a new high translated to lower values of the exchange rate. Therefore, we think that we could see a correction from here in the coming days .
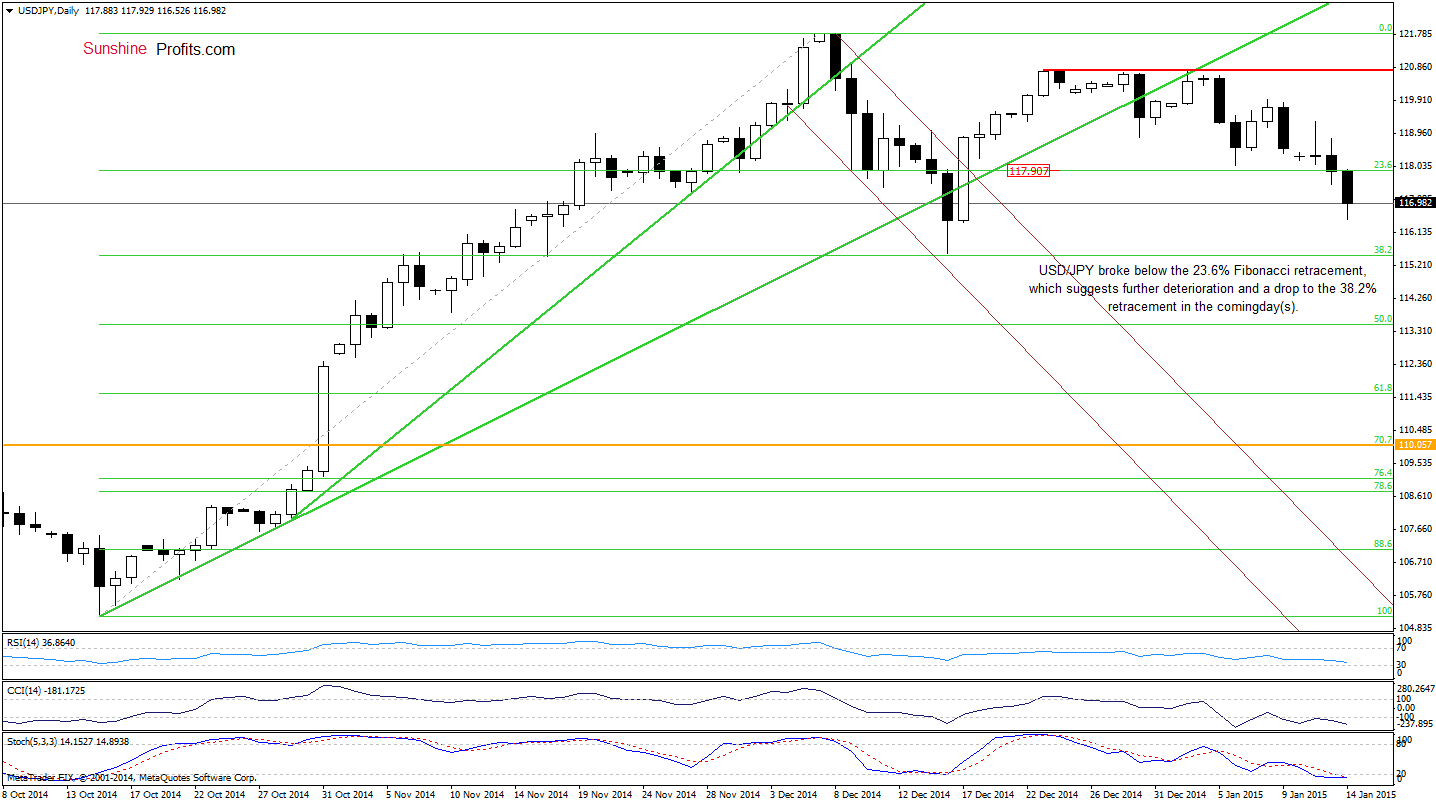
As you see on the daily chart, the situation developed in tune with the above-mentioned scenario as USD/JPY broke below the last week’s low and the 23.6% Fibonacci retracement. Taking this fact into account, we think that the pair will extend losses in the coming days and the initial downside target will be the 38.2% retracement at 115.51. At this point, it’s worth noting that this area is supported by the Dec 16 low, which suggests that the pair could rebound from here later this week.
Very short-term outlook: mixed with bearish bias
Short-term outlook: mixed with bearish bias
MT outlook: mixed
LT outlook: bullish
Trading position (short-term; our opinion): No positions are justified from the risk/reward perspective at the moment. We will keep you informed should anything change, or should we see a confirmation/invalidation of the above.
AUD/USD
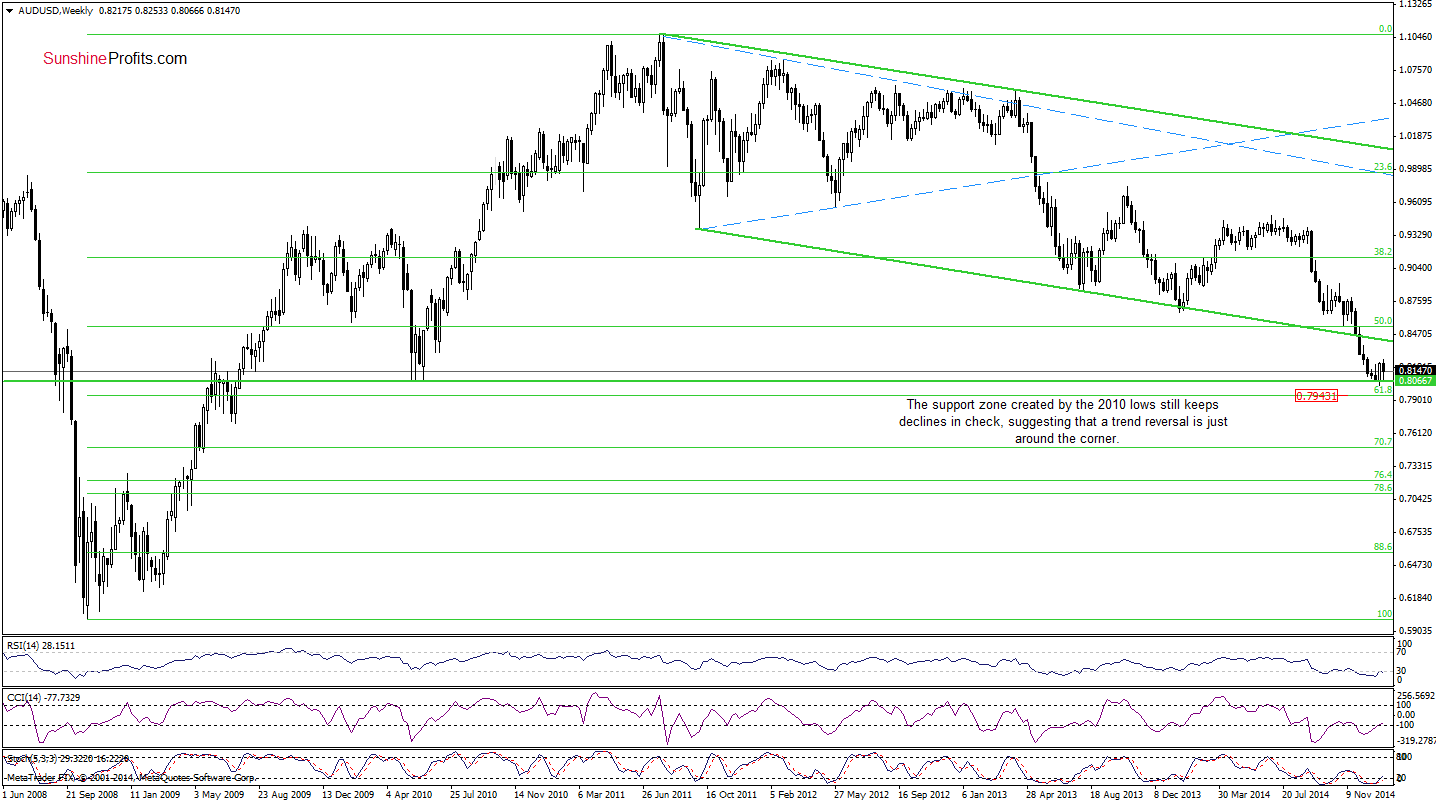
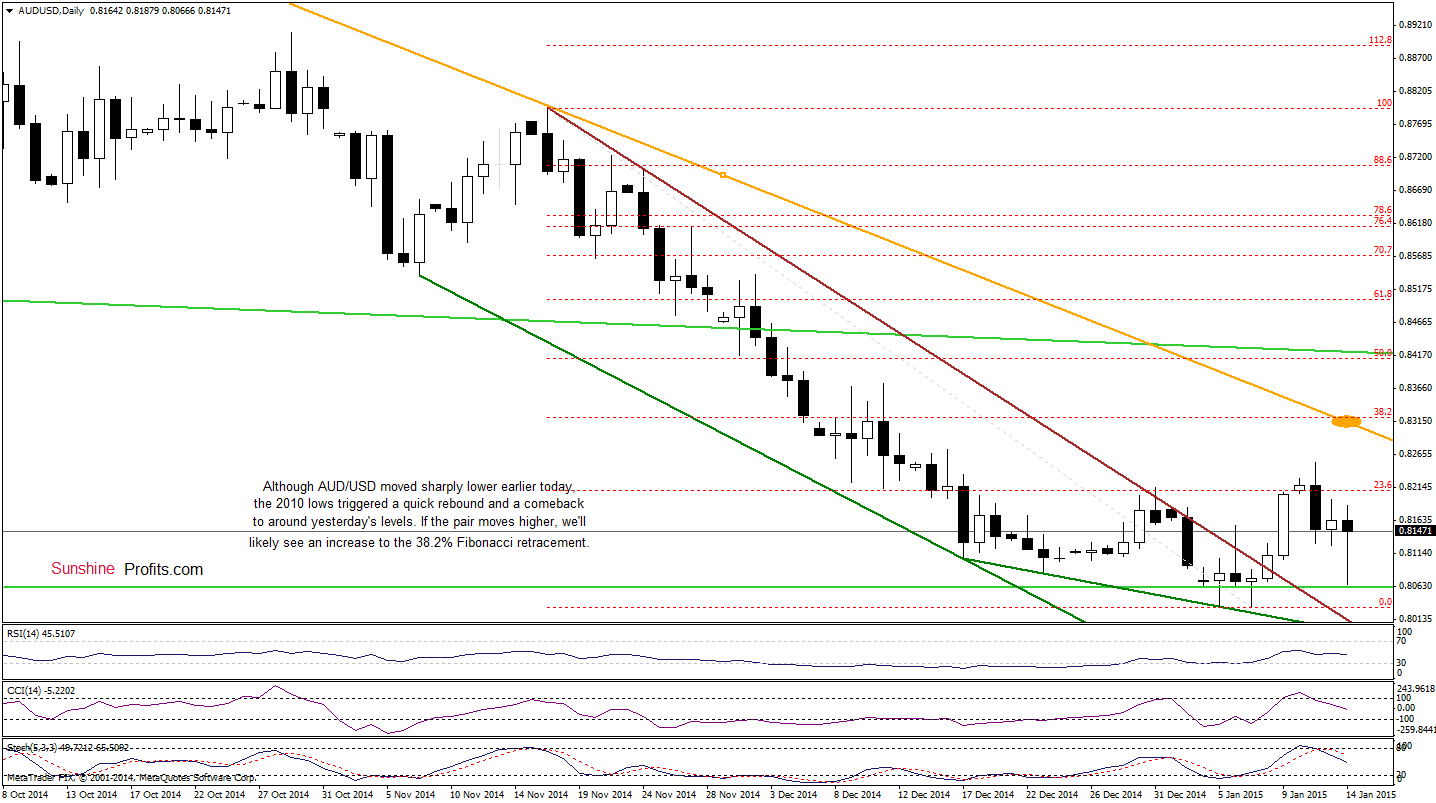
The first thing that catches the eye on the above charts is a drop to the 2010 lows (marked with green horizontal line). As you see, this key support withstood the selling pressure and triggered a sharp rebound earlier today. In this way, the exchange rate came back to yesterday’s levels, which suggests that if the pair climbs above the 23.6% Fibonacci retracement once again, we’ll see further improvement and an increase to the 38.2% Fibonacci retracement and the orange declining resistance line (currently around 0.8320) in the coming days.
Very short-term outlook: bullish
Short-term outlook: mixed with bullish bias
MT outlook: mixed
LT outlook: mixed
Trading position (short-term; our opinion): Long positions with a stop-loss order at 0.7940 and an initial upside target at 0.8230. We will keep you informed should anything change, or should we see a confirmation/invalidation of the above.
Thank you.
Nadia Simmons
Forex & Oil Trading Strategist
Przemyslaw Radomski, CFA
Founder, Editor-in-chief
Gold & Silver Trading Alerts
Forex Trading Alerts
Oil Investment Updates
Oil Trading Alerts

