
Earlier today, the USD Index, which tracks the performance of the U.S. currency against a basket of six major rivals, climbed to a fresh 2014 high of 89.87 as yesterday’s solid data from the U.S. Department of Labor and Wednesday’s the Federal Reserve's policy statement continued to support the greenback. How did this rally affect the technical picture of major currency pairs?
In our opinion the following forex trading positions are justified - summary:
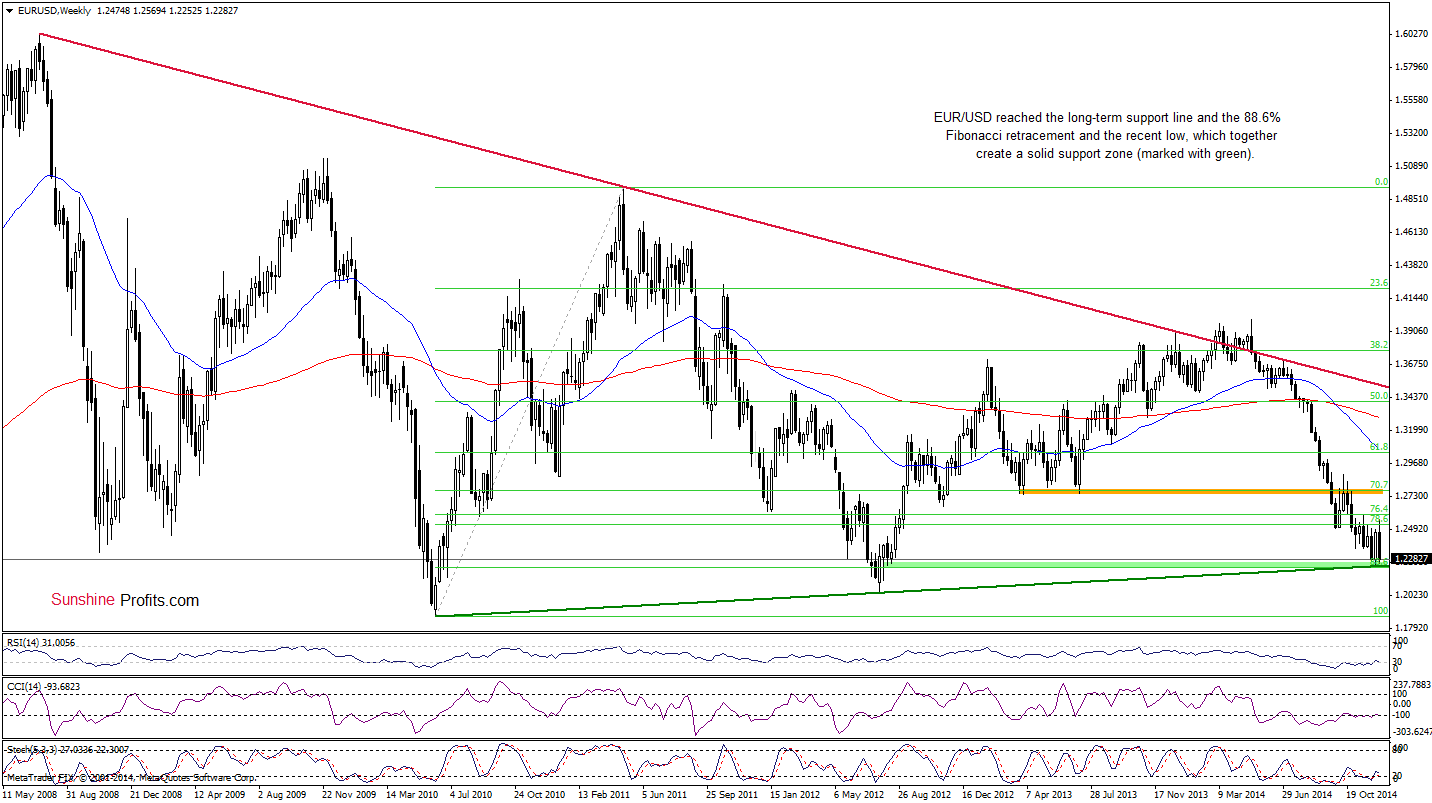
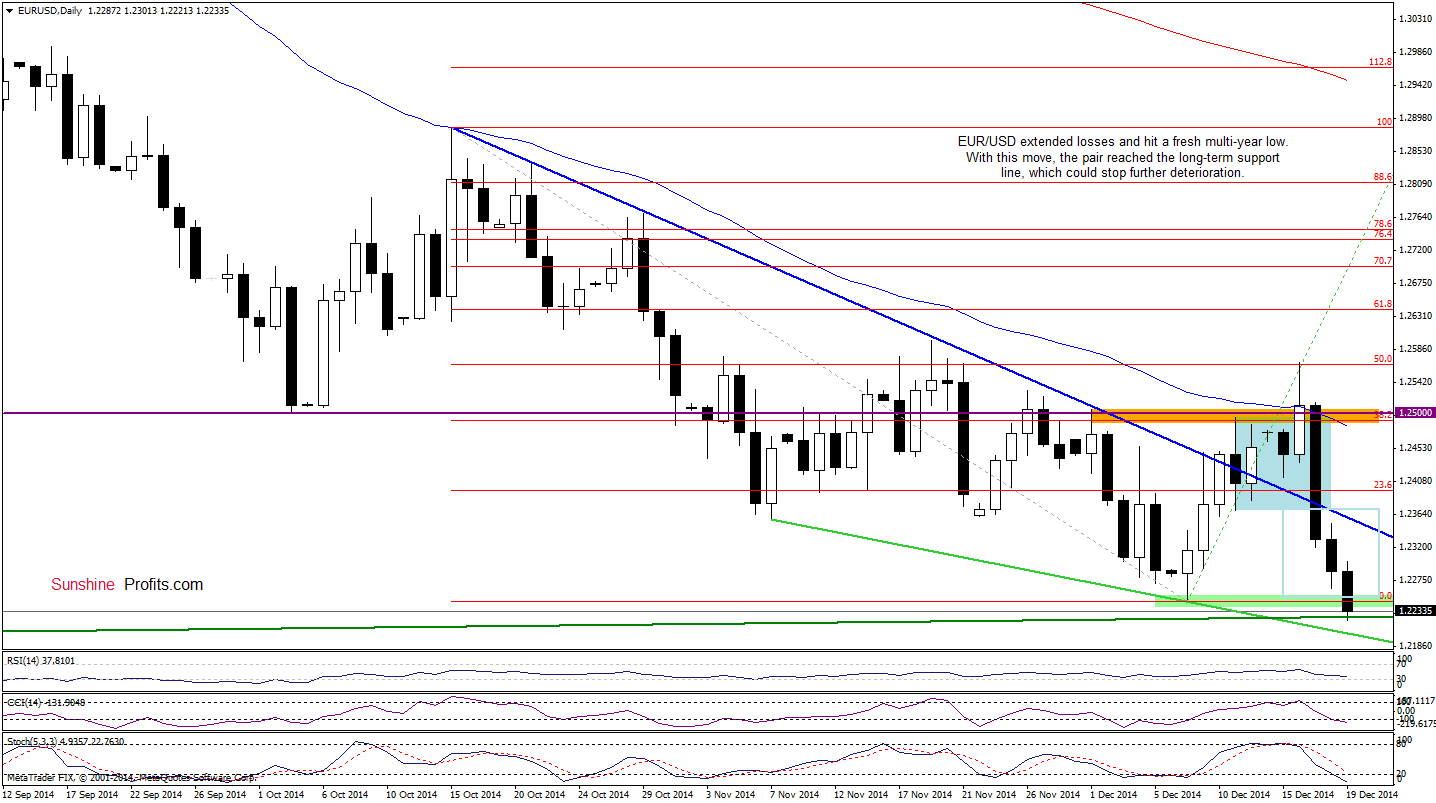
EUR/USD
In our previous Forex Trading Alert, we wrote the following:
(…) EUR/USD reversed and declined, invalidating the breakout above the resistance zone (…) and the blue declining line. These strong bearish signals in combination with a breakdown below the lower border of the consolidation (marked with blue) suggests that the exchange rate will test the strength of the recent low in the coming day (or days). Please note that this scenario is currently reinforced by sell signals generated by the indicators.
Looking at the charts, we see that curency bears not only realized the above-mentioned scenario (as we expected), butalso managed to push the pair to a fresh multi-year low. With this downswing, the exchange rate reached the support zone created by the long-term green support line and the 88.6% Fibonacci retracement. In the previous week, this support area was strong enough to pause further deterioration and trigger a corrective upward move. Taking this fact ino account, it seems to us that we’ll see a similar price action and the pair will rebound in the coming days. If this is the case, the initial upside target would be the blue declining resistance line (marked on the daily chart) around 1.2349. Nevertheless, we should keep in mind that sell signals still support the bearish case, which suggetsts that an intraday drop to the green support line (based on the Nov 7 and Dec 8 lows) can’t be ruled out.
Very short-term outlook: mixed
Short-term outlook: mixed
MT outlook: mixed
LT outlook: bearish
Trading position (short-term): In our opinion, no positions are justified from the risk/reward perspective at the moment. We will keep you informed should anything change, or should we see a confirmation/invalidation of the above.
GBP/USD
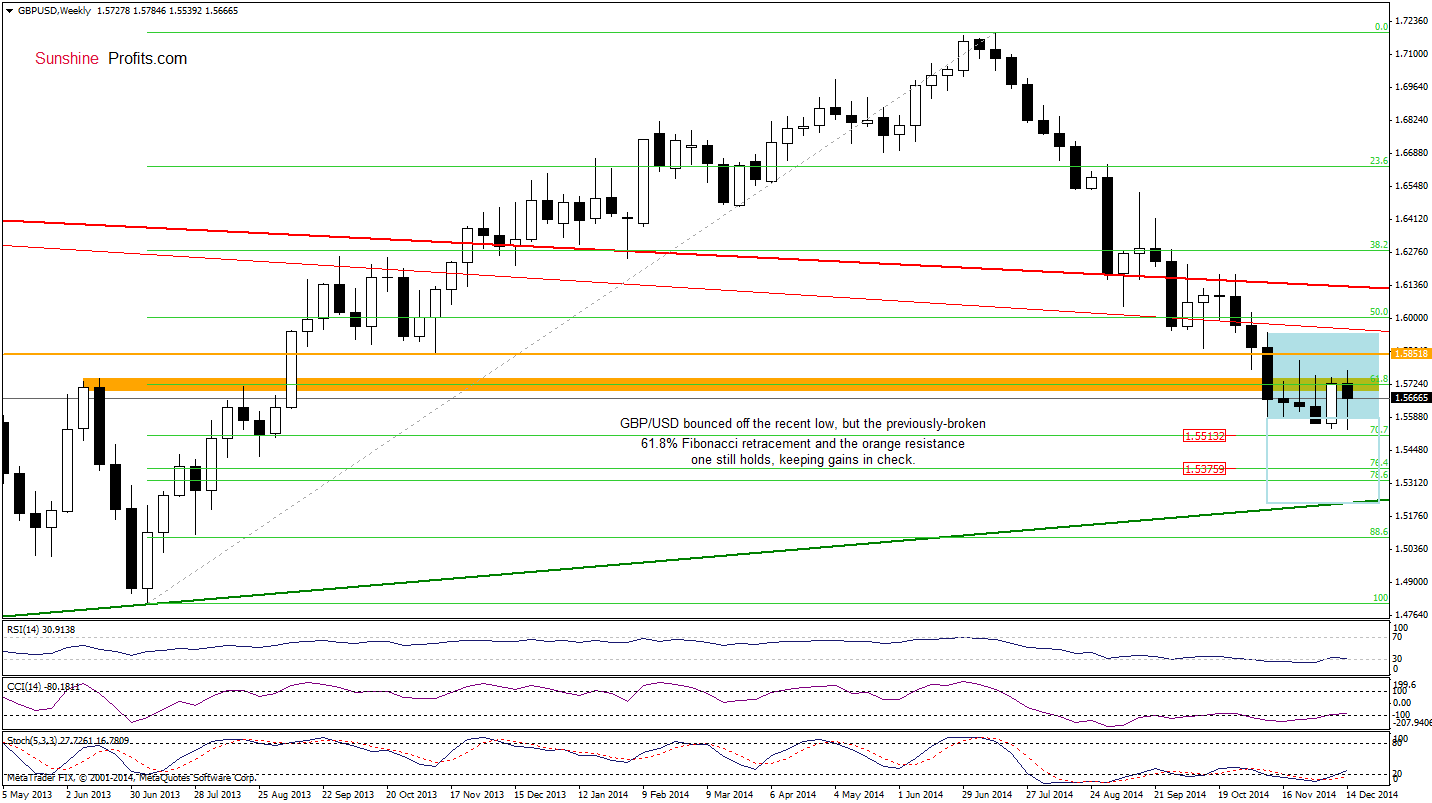
The medium-term outlook remains unchanged as GBP/USD is still trading in the consolidation under the previously-broken 61.8% Fibonacci retracement and the orange resistance zone. Taking this fact into account, we believe that a breakout above the upper line of the formation (or a breakdown below the 70.7% Fibonacci retracement) will show us the direction of future moves.
Will the very short-term chart give us more clues? Let’s check.
On Monday, we wrote the following:
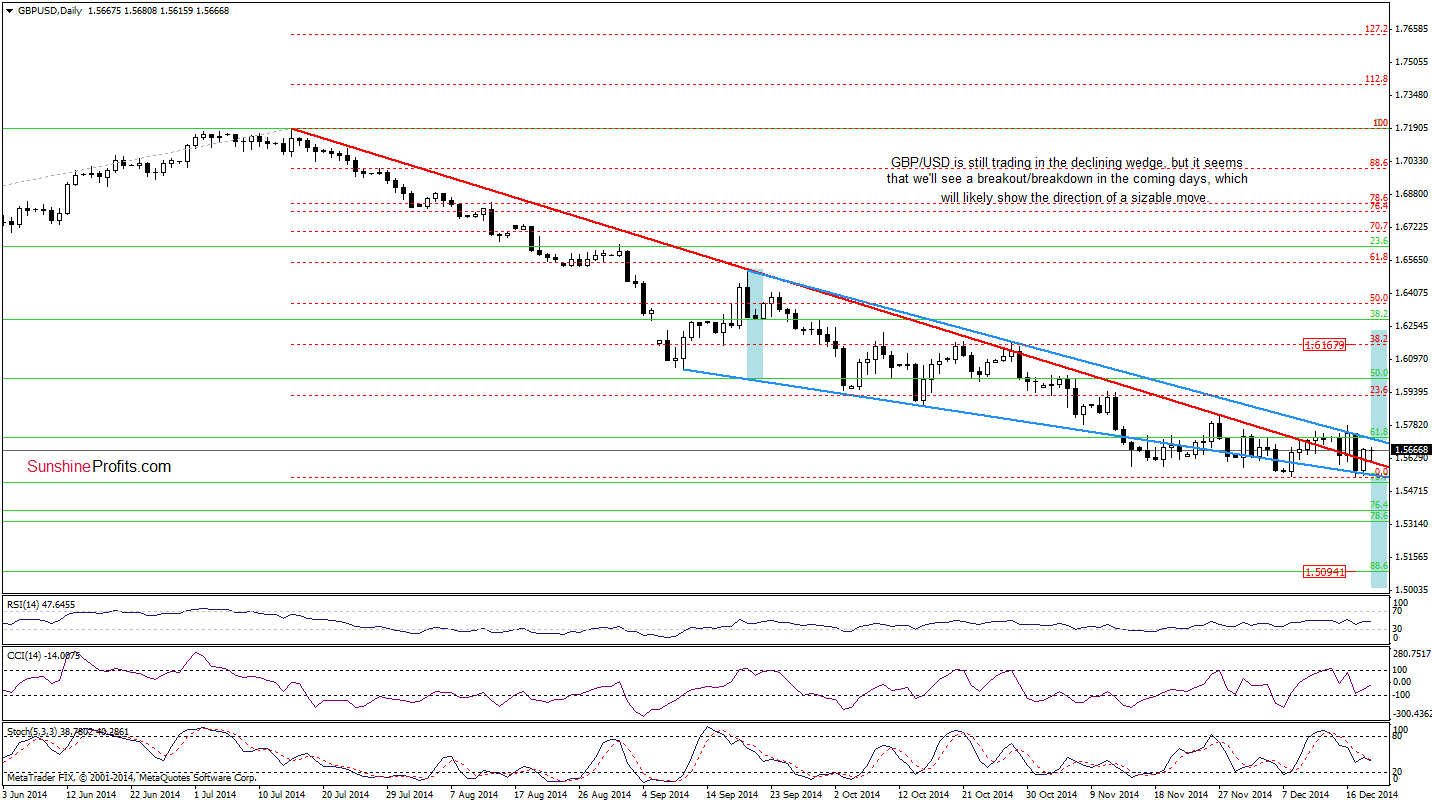
(…) the pair dropped below the red declining line, invalidating earlier breakout. This is a bearish signal that suggests further deterioration and a test of the lower border of the declining wedge (currently around 1.5573) or even the Dec 8 low of 1.5540. Please note that this scenario is currency reinforced by the position of the indicators (the CCI and Stochastic Oscillator generated sell signals, supporting the bearish case).
As you see on the daily chart, the situation developed in line with the above-mentioned scenario as GBP/USD declined sharply, hitting a fresh multi-month low. Since then, the pair is trading in a consolidation not only between Monday’s high and low, but also between the upper and lower border of the declining wedge. Therefore, we believe that a breakout/breakdown will be a strong buy/sell signal, which will trigger a sizable upward/downward move. If currency bulls win, we could see an upward move to (at least) the 38.2% Fibonacci retracement based on the entire Jul-Dec decline (around 1.6167). If they fail, and the pair drops below the 70.7% Fibonacci retracement, GBP/USD could decline to around 1.5235, where the green long-term support line (marked on the weekly chart) is.
Very short-term outlook: mixed
Short-term outlook: mixed
MT outlook: mixed
LT outlook: mixed
Trading position (short-term): In our opinion, no positions are justified from the risk/reward perspective at the moment. We will keep you informed should anything change, or should we see a confirmation/invalidation of the above.
USD/JPY
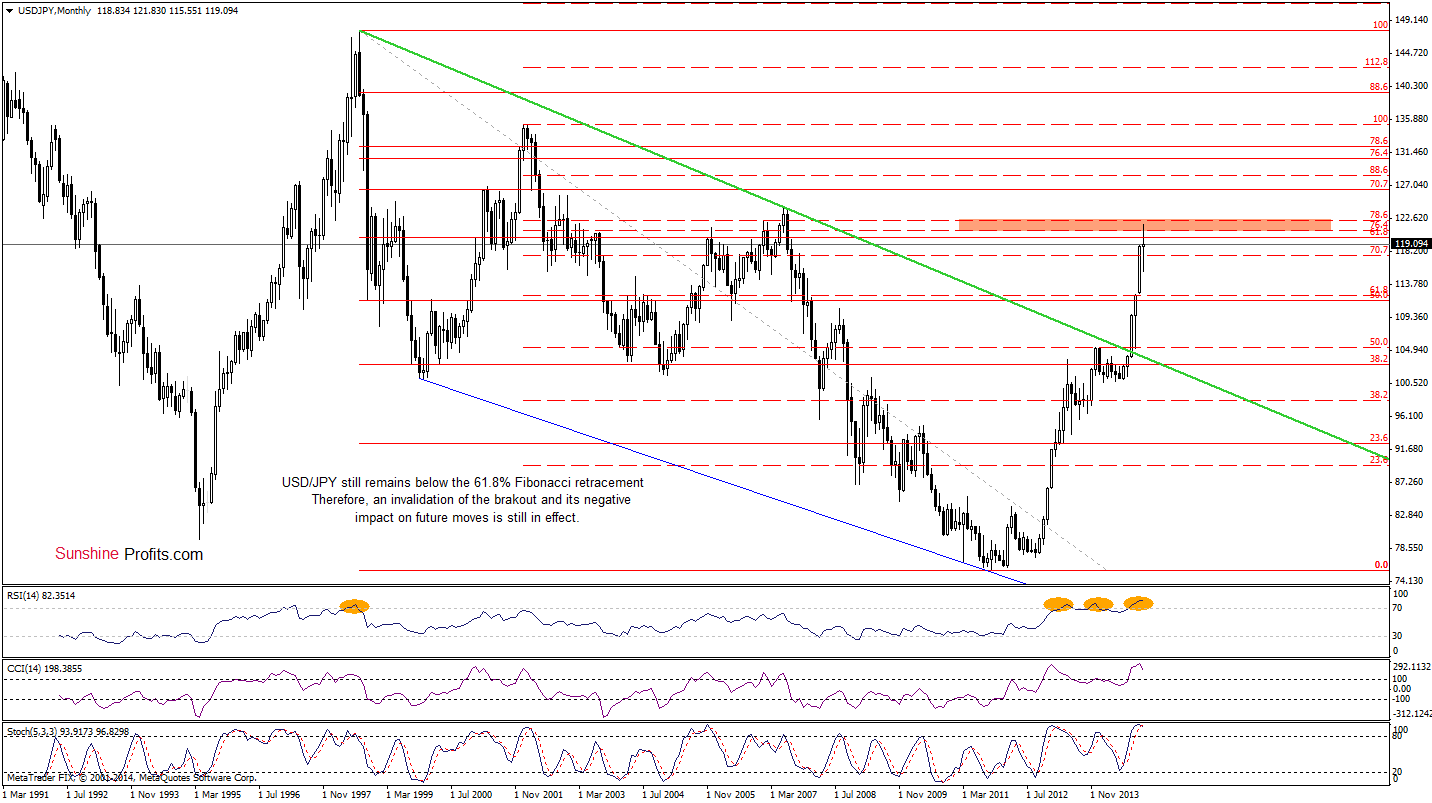
The situation in the long-term hasn’t changed much as an invalidation of the breakout above the 61.8% Fibonacci retracement and its potential negative impact on future moves is still in effect.
Can we infer something more from the daily chart? Let’s check.
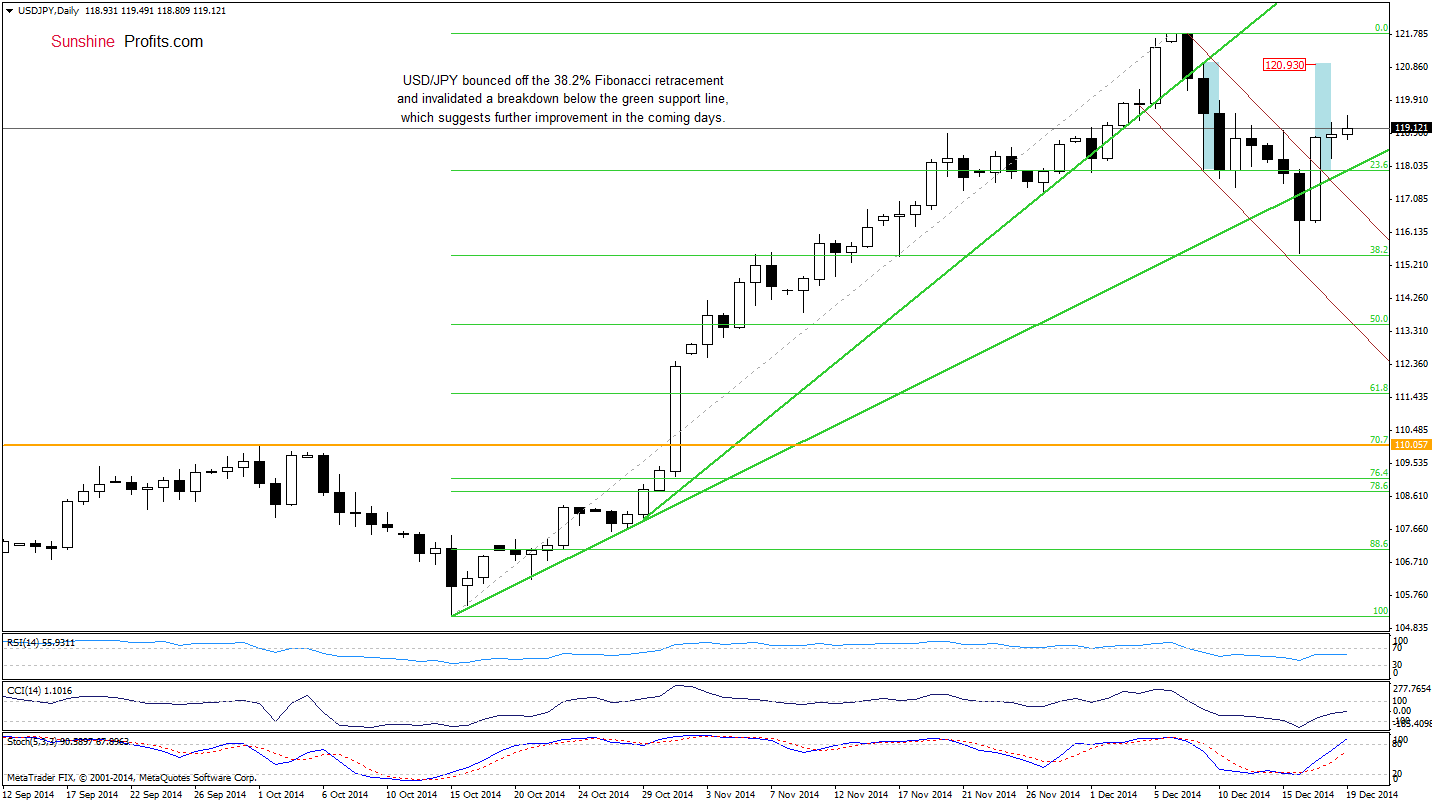
On the daily chart, we see that although USD/JPY extended losses at the beginning of the week, the 38.2% Fibonacci retracement successfully stopped further deterioration, triggering an upswing. With this move, the pair invalidated a breakdown below the green support line, which accelerated further improvement. Additionally, this sharp comeback took USD/JPY above the upper line of the declining trend channel (marked with brown), which suggests that we’ll see higher values of the exchange rate. If this is the case, the initial upside target would be around 120.93, where the size of the upswing will correspond to the height of the trend channel. This scenario is also supported by the current position of the indicators.
Very short-term outlook: bullish
Short-term outlook: mixed with bullish bias
MT outlook: mixed
LT outlook: bullish
Trading position (short-term; our opinion): No positions are justified from the risk/reward perspective at the moment. We will keep you informed should anything change, or should we see a confirmation/invalidation of the above.
USD/CAD
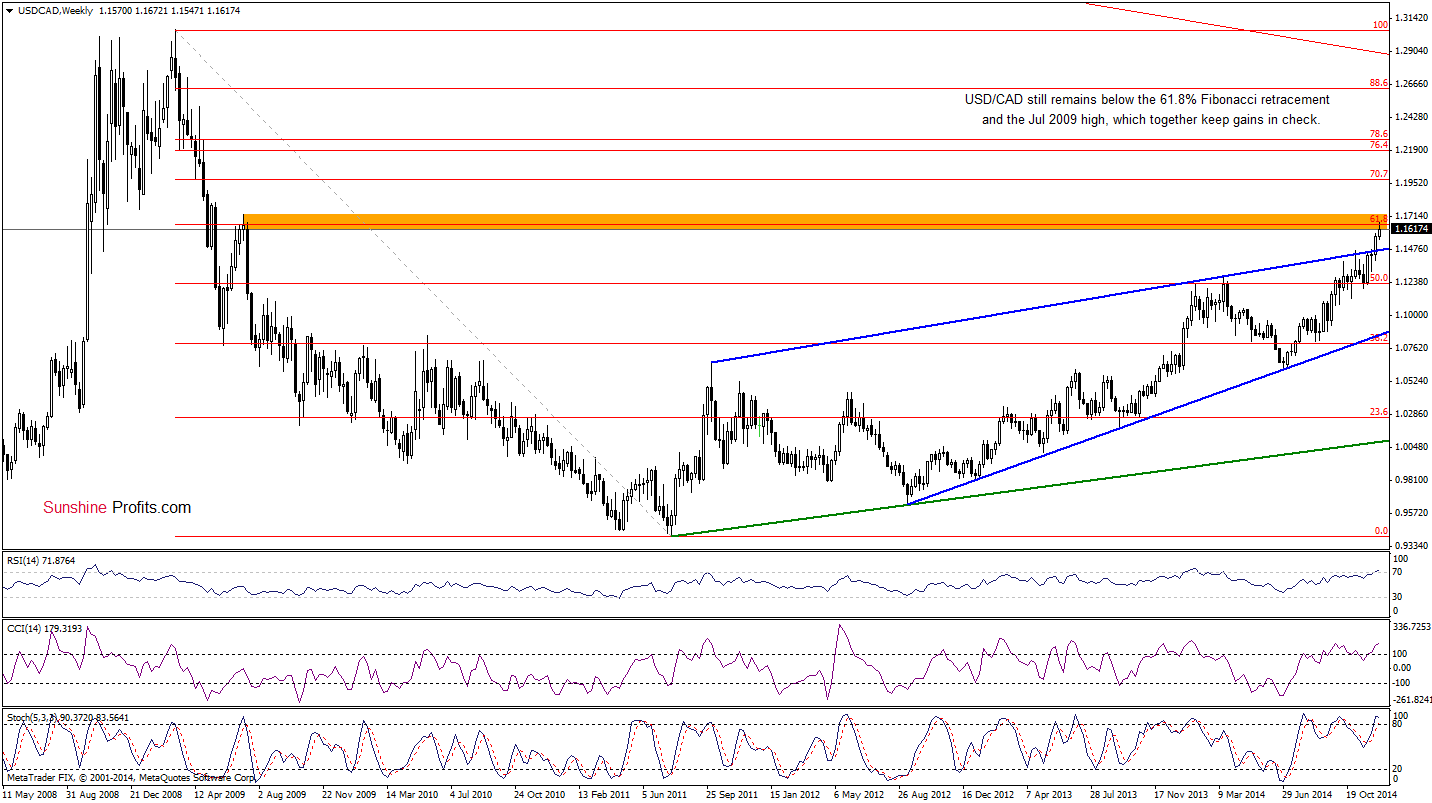
The situation in the medium term hasn’t changed much since our last commentary on this currency pair was posted as USD/CAD is still trading below the orange resistance zone (created by the 61.8% Fibonacci retracement and the Jul 2009 high), which keeps gains in check.
Having say that, let’s examine the daily chart.
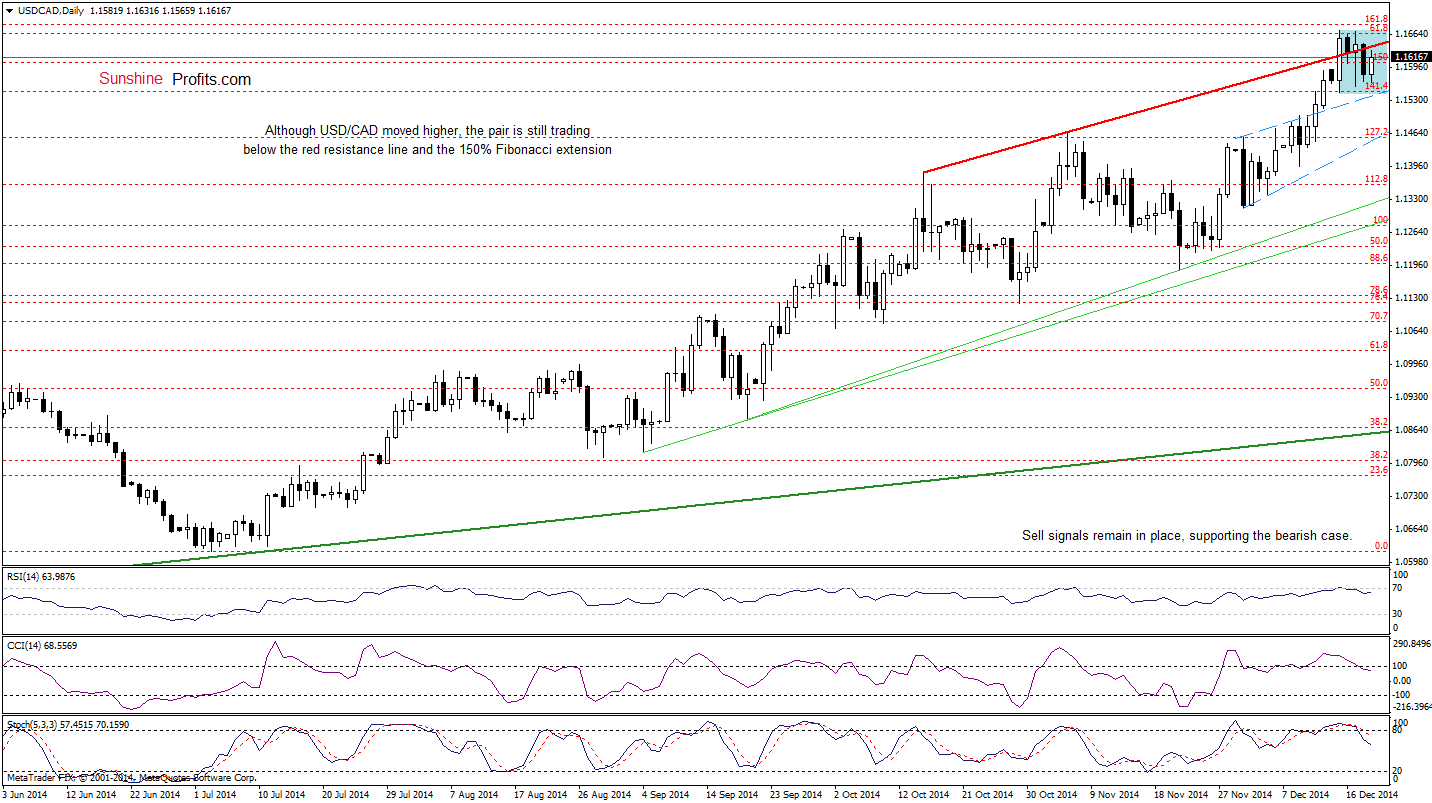
From this perspective, we see that although USD/CAD rebounded earlier today, the pair is still trading in a consolidation below the previously-broken red resistance line. Therefore, our last commentary on this currency pair is up-to-date:
(…) the pair declined, invalidating earlier breakout, which is a bearish signal that suggests lower values of the exchange rate (especially when we factor in sell signals generated by the indicators). Nevertheless, we think that further declines will be more likely if USD/CAD breaks below the lower border of the consolidation (marked with blue) at 1.1547.
Very short-term outlook: mixed with bearish bias
Short-term outlook: mixed
MT outlook: mixed
LT outlook: mixed
Trading position (short-term; our opinion): No positions are justified from the risk/reward perspective at the moment. We will keep you informed should anything change, or should we see a confirmation/invalidation of the above.
USD/CHF
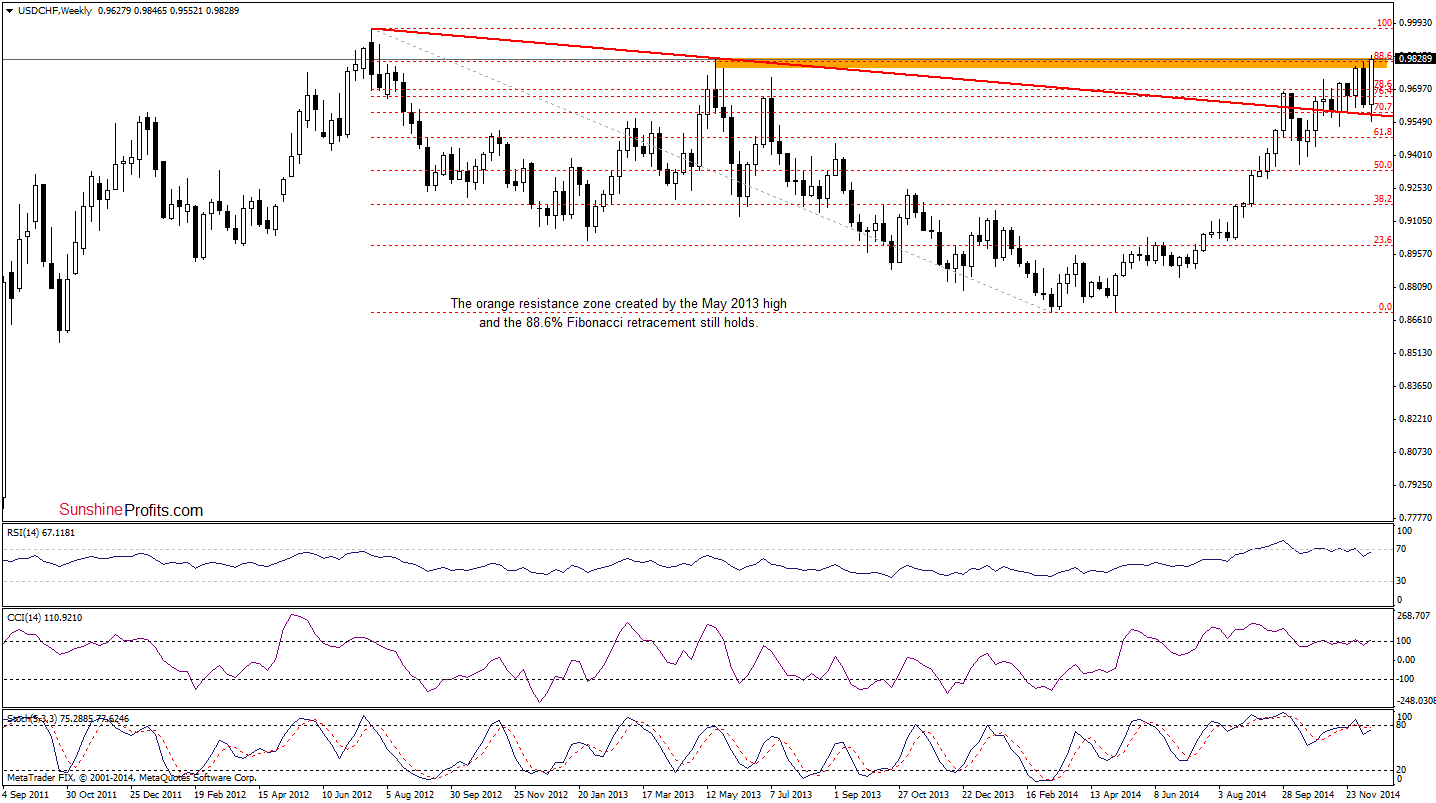
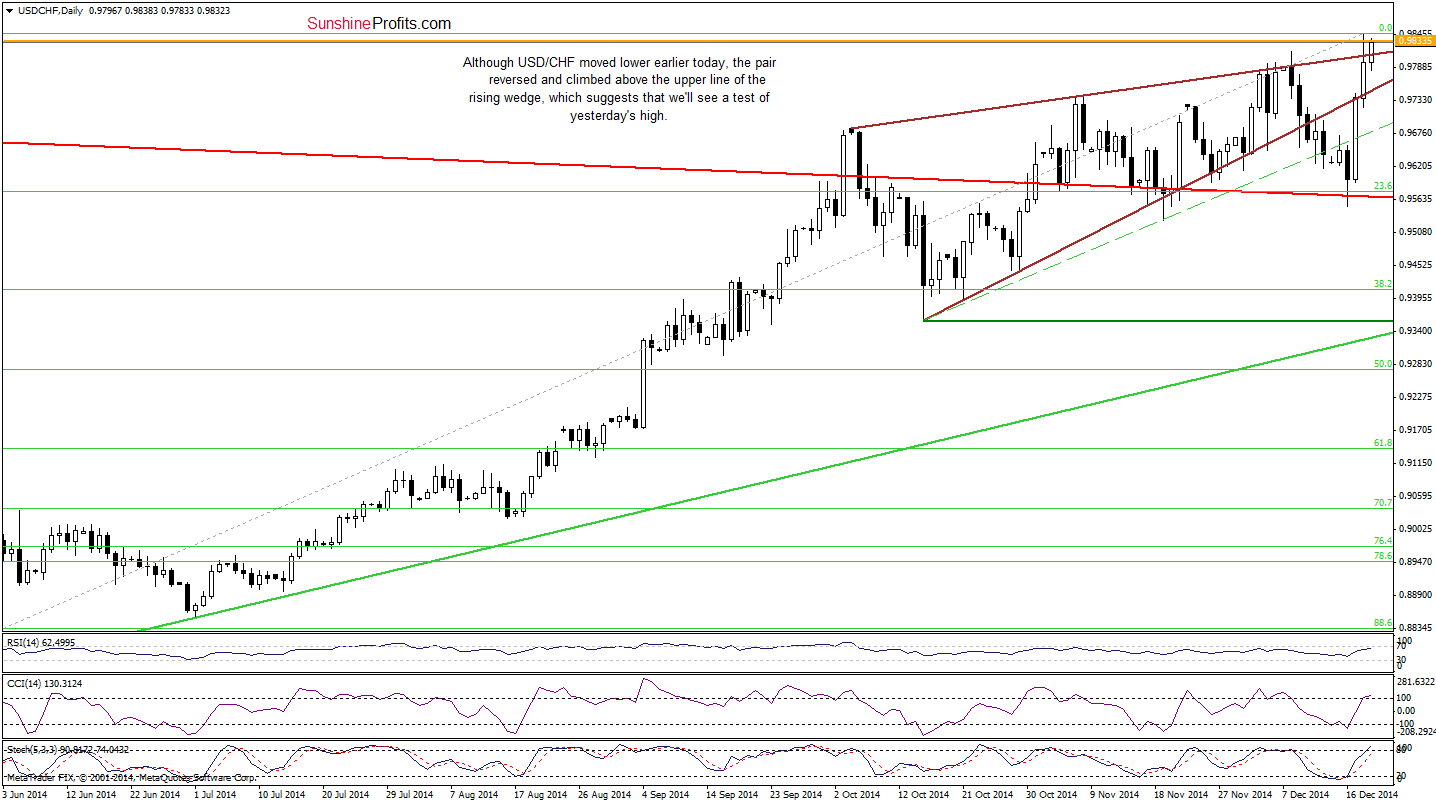
Looking at the above charts, we see that although USD/CHF moved lower earlier today, the pair reversed and climbed above the upper line of the rising wedge (marked with brown) and reached the orange resistance zone (marked on the weekly chart) once again. This is a bullish signal that suggests a test of yesterday’s high of 0.9846. If it holds, we’ll see a pullback and an invalidation of the breakout, which will likely translate to a test of the lower border of the rising wedge. However, taking into account the fact that there are no sell signals on the daily indicators, we could see a rally even to around 0.9970, where the Jul 2012 high is.
Very short-term outlook: mixed with bullish bias
Short-term outlook: mixed
MT outlook: mixed
LT outlook: bearish
Trading position (short-term; our opinion): No positions are justified from the risk/reward perspective at the moment. We will keep you informed should anything change, or should we see a confirmation/invalidation of the above.
AUD/USD
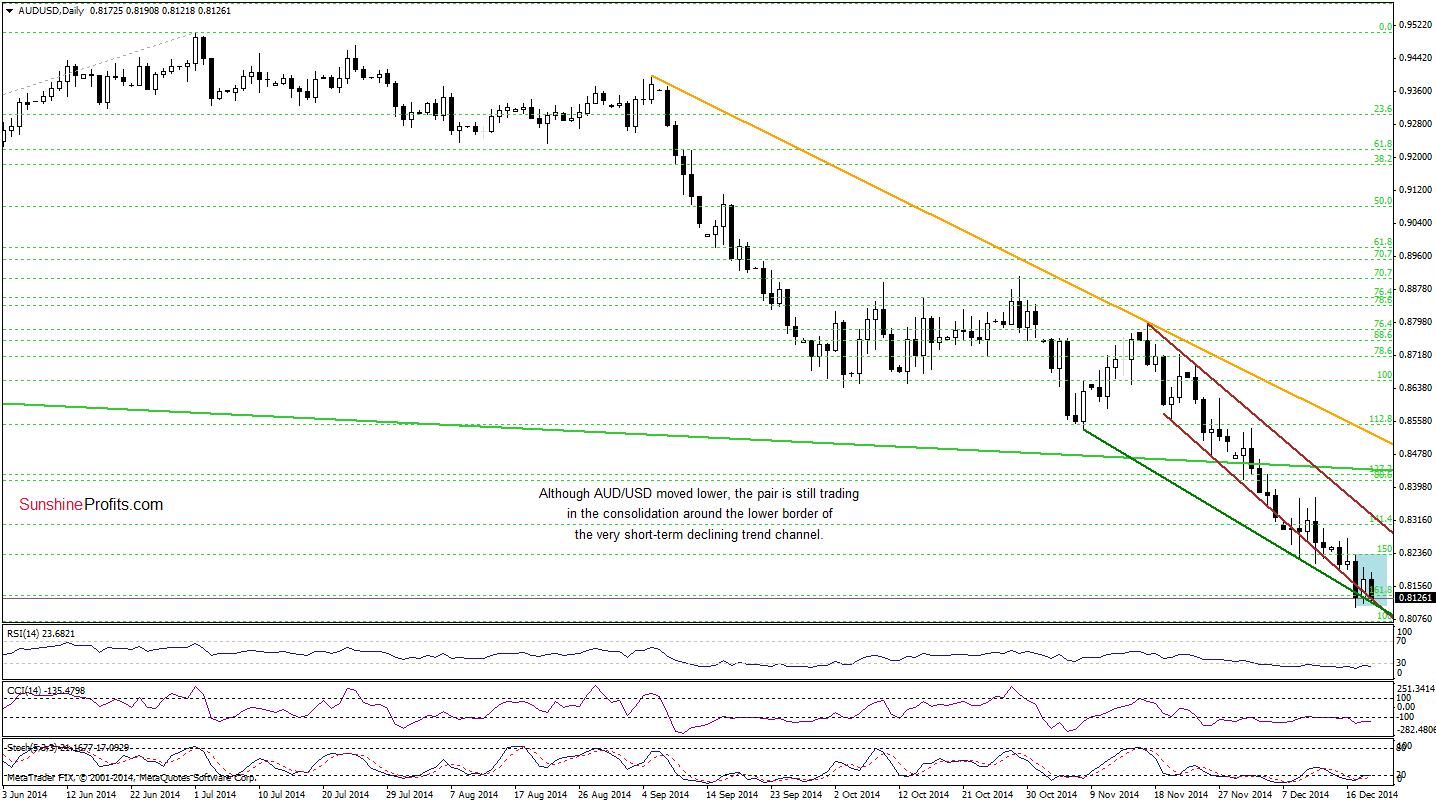
On the above chart, we see that although AUD/USD reversed, the pair is trading in a consolidation (marked with blue) between Wednesday’s high and low. Taking this fact into account, we think that as long as there is no breakout/breakdown, bigger upswing/downswing is not likely to be seen. At this point, it’s worth noting the pair remains not only above the lower line of the declining trend channel, but also above the green support line (based on the Nov 7 and Dec 9 lows), which together could trigger a rebound from here. This scenario is also reinforced by the medium-term picture.
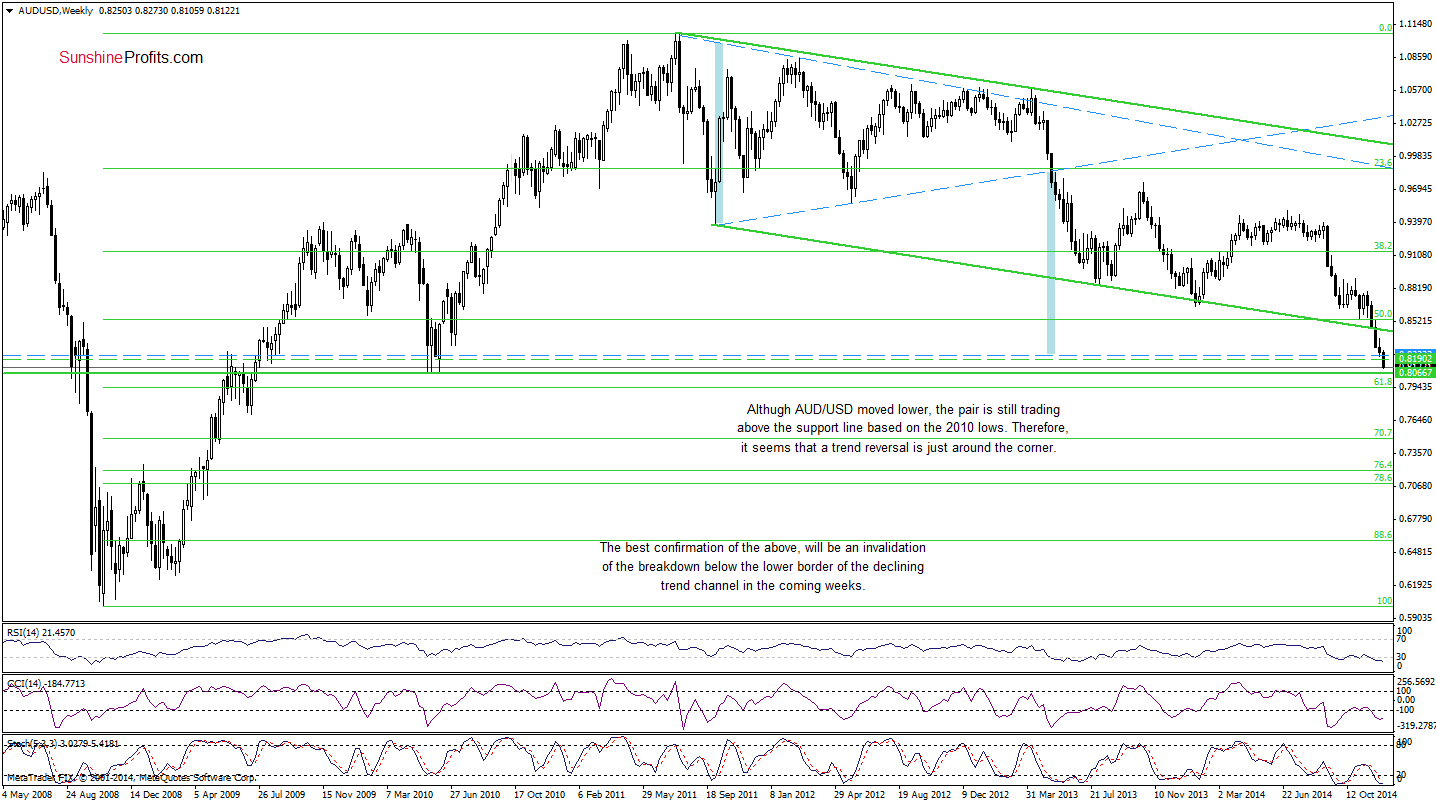
From this perspective, we see that although AUD/USD moved lower, the pair remains above the green support line based on the 2010 lows, which suggests that the space for further declines seems limited and a trend reversal might be just around the corner.
Very short-term outlook: mixed with bullish bias
Short-term outlook: mixed
MT outlook: mixed
LT outlook: mixed
Trading position (short-term): In our opinion, no positions are justified from the risk/reward perspective at the moment. We will keep you informed should anything change, or should we see a confirmation/invalidation of the above.
Thank you.
Nadia Simmons
Forex & Oil Trading Strategist
Przemyslaw Radomski, CFA
Founder, Editor-in-chief
Gold & Silver Trading Alerts
Forex Trading Alerts
Oil Investment Updates
Oil Trading Alerts

