
In our opinion the following forex trading positions are justified - summary:
All of the currency pairs that we cover in our Forex Trading Alerts have one thing in common – all of them involve the US Dollar. In today’s issue we will focus on this particular currency by analyzing the USD Index from several perspectives. This will put the most recent price swings in a bigger picture and should help to differentiate between important and rather random moves. Let’s start with the long-term chart (charts courtesy of http://stockcharts.com).
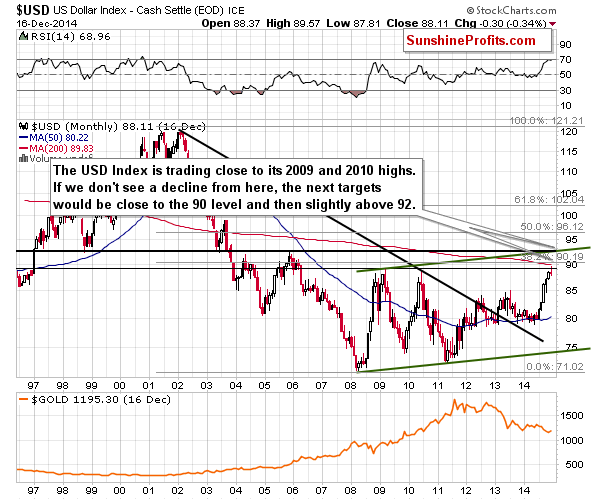
The long-term chart tells us 2 major things:
- The current rally has been significant and since it encountered resistance in the form of the 2009 and 2010 highs, we could see a move lower from these levels.
- There is another resistance level right at the 92 level, which means that the USD Index could still move even higher in the short term (thus moving from overbought to more overbought).
Has the top formed in the USD Index? The above chart doesn’t provide one clear answer. Instead, it tells us that the risk of the top being formed increases with each small move higher and is at already higher levels. From a long-term point of view, it seems that buying now is not buying at the bottom – it’s buying close to at least a local top.
From the short-term perspective, however, the situation looks a bit different. We have commented on it in today’s Gold & Silver Trading Alert, so we will quote the description below:
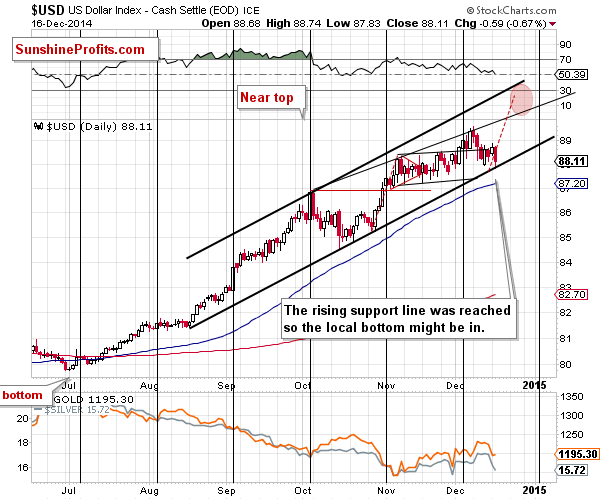
In short, the USD Index reached the rising support line, which means that a local bottom is likely in and we will see another move higher relatively soon.
Please note that the November – early December period could be viewed as a rising form of consolidation. The rally didn’t end and there was no big correction after the late-October rally. Instead, we saw USD Index trading sideways. Keeping the above in mind, one can expect the move that is about to take place – after the end of the consolidation – to be rather similar to the move that preceded it. This means that we could see the USD Index a few index point higher relatively soon. The long-term chart tells us that the next strong resistance is close to 92, so this is where the next stop or pause or top could be seen.
Summing up, it seems quite likely that the USD Index will move even higher before forming a major top. The situation in the individual currency pairs, however, is too unclear at this time to justify opening speculative positions in our view. Once we see that the USD Index is indeed rallying (in addition to today’s daily upswing) and we see confirmations from individual currency pairs, we will most likely open new positions. For now it seems that waiting on the sidelines is a better idea.
Thank you.
Nadia Simmons
Forex & Oil Trading Strategist
Forex Trading Alerts
Oil Investment Updates
Oil Trading Alerts

