
Earlier today, official data showed that industrial production rose 1.3% in the previous month, beating expectations for a 0.7% gain, which pushed the greenback higher. In response, EUR/USD gave up some gains, but is still trading in a consolidation. Is this a sign of strength?
In our opinion the following forex trading positions are justified - summary:
EUR/USD
The situation in the medium term hasn’t changed much as EUR/USD is still trading above the long-term support line and the 88.6% Fibonacci retracement. Today, we’ll focus on the very short-term changes.
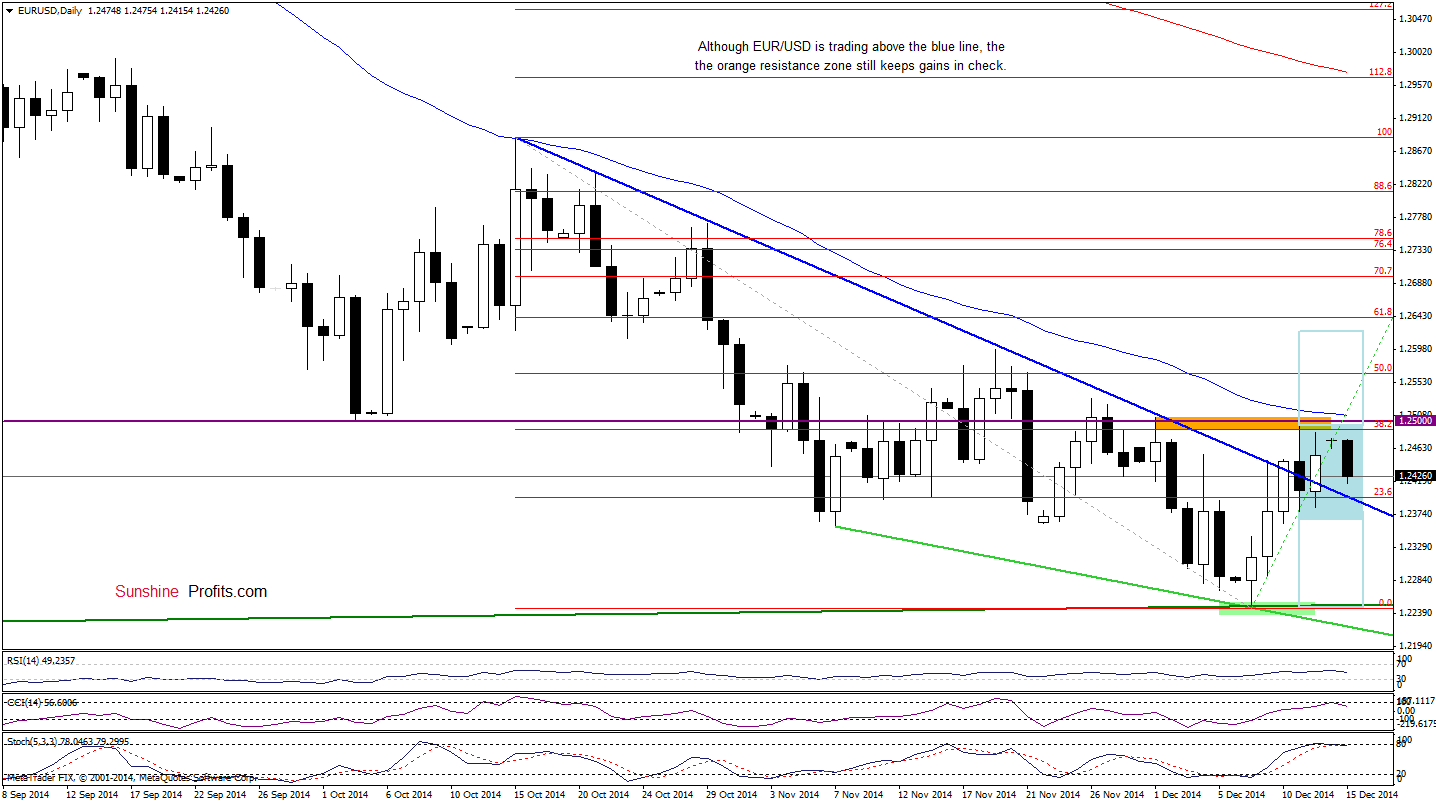
Looking at the daily chart, we see that although EUR/USD gave up some gains, the exchange rate is still trading in a consolidation between the previously-broken support/resistance blue line and the orange resistance zone. Therefore, we believe that our last commentary on this currency pair is up-to-date:
(…) we think that as long as the pair remains below the orange resistance zone (created by the 38.2% Fibonacci retracement based on the Oct-Dec decline, the barrier of 1.2500 and the Dec high) further improvement is questionable and another attempt to move lower can’t be ruled out. (…) slightly above the nearest resistance zone there is also the previously-broken 50-day moving average, which reinforces this area. As you see on the above chart, in mid-Oct it was one of the factors, which pushed the pair lower. Therefore, a sizable upward move will be more likely if EUR/USD climbs above it in the coming week.
Before we move on to the next currency pair, please note that the current position of the indicators suggests further deterioration and a test of the blue line in the coming days.
Very short-term outlook: mixed with bearish bias
Short-term outlook: mixed
MT outlook: mixed
LT outlook: bearish
Trading position (short-term): In our opinion, no positions are justified from the risk/reward perspective at the moment. However, we’ll consider opening long positions if we see a successful breakout above the key resistance zone. We will keep you informed should anything change, or should we see a confirmation/invalidation of the above.
GBP/USD
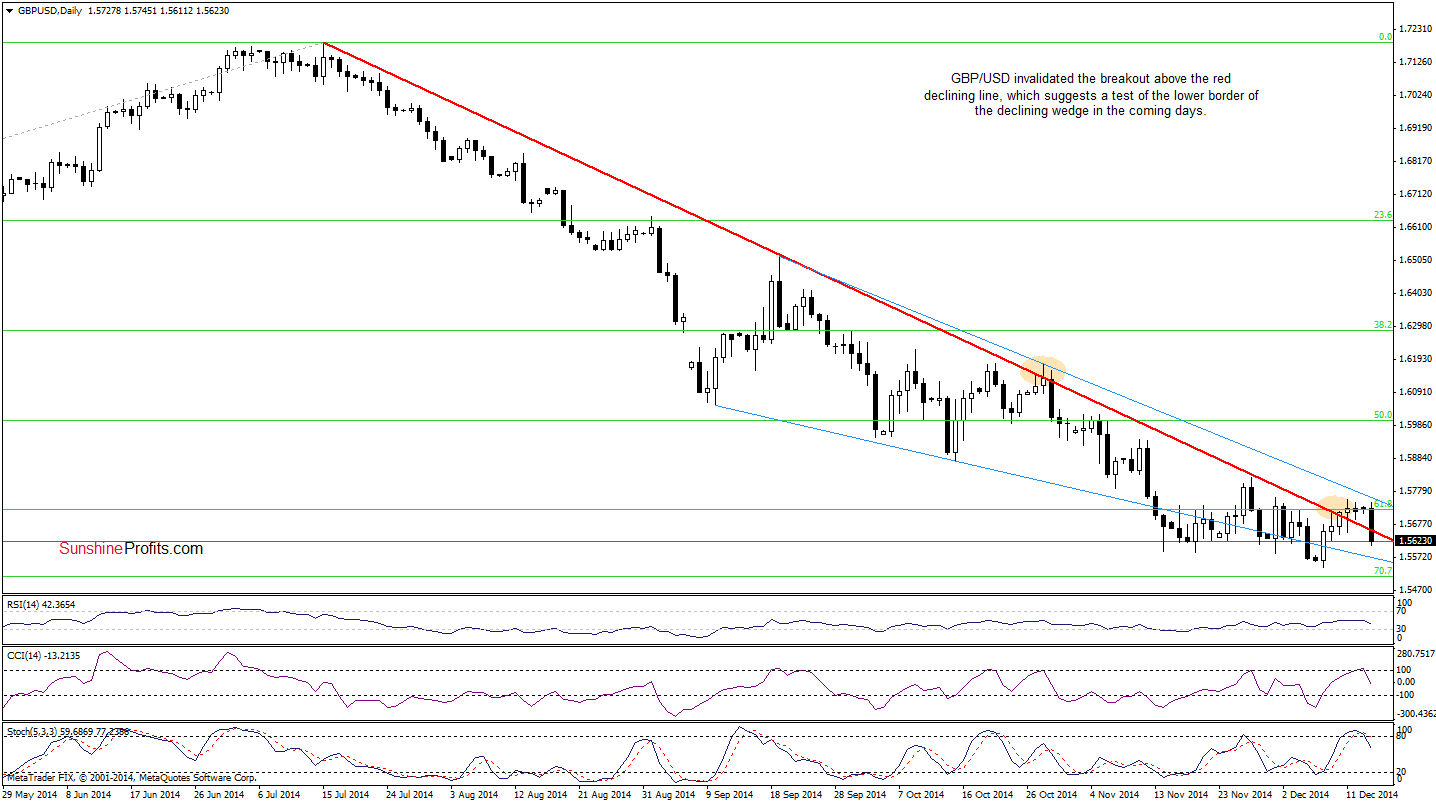
The medium-term outlook remains unchanged as GBP/USD still remains under the previously-broken 61.8% Fibonacci retracement and the orange resistance zone. Will the very short-term chart give us more clues about future moves? Let’s check.
On Thursday, we wrote the following:
(…) GBP/USD extended gains and broke above the red declining resistance line earlier today. Although this is a bullish signal at the first glance, we should keep in mind that we saw similar price action at the end of Oct. Back then, the breakout was invalidated on the following trading day, which triggered a sharp decline. Therefore, we think that as long as we don’t see a confirmation of today’s breakout (…), a sizable rally is not likely to be seen. Please keep in mind that despite today’s increase, the exchange rate is still trading in a declining wedge (marked with blue), which means that before we see further improvement, currency bulls will have to push the pair also above this resistance.
Looking at the above chart, we see that the proximity to the upper line of the declining wedge encouraged currency bears to act, which resulted in a sharp pullback earlier today (similarly to what we saw at the end of Oct). As you see, with this downswing, the pair dropped below the red declining line, invalidating earlier breakout. This is a bearish signal that suggests further deterioration and a test of the lower border of the declining wedge (currently around 1.5573) or even the Dec 8 low of 1.5540. Please note that this scenario is currency reinforced by the position of the indicators (the CCI and Stochastic Oscillator generated sell signals, supporting the bearish case).
Very short-term outlook: bearish
Short-term outlook: mixed
MT outlook: mixed
LT outlook: mixed
Trading position (short-term): In our opinion, no positions are justified from the risk/reward perspective at the moment. We will keep you informed should anything change, or should we see a confirmation/invalidation of the above.
USD/JPY
The situation in the long-term hasn’t changed much as an invalidation of the breakout above the 61.8% Fibonacci retracement and its potential negative impact on future moves is still in effect.
Can we infer something ore from the daily chart. Let’s check.
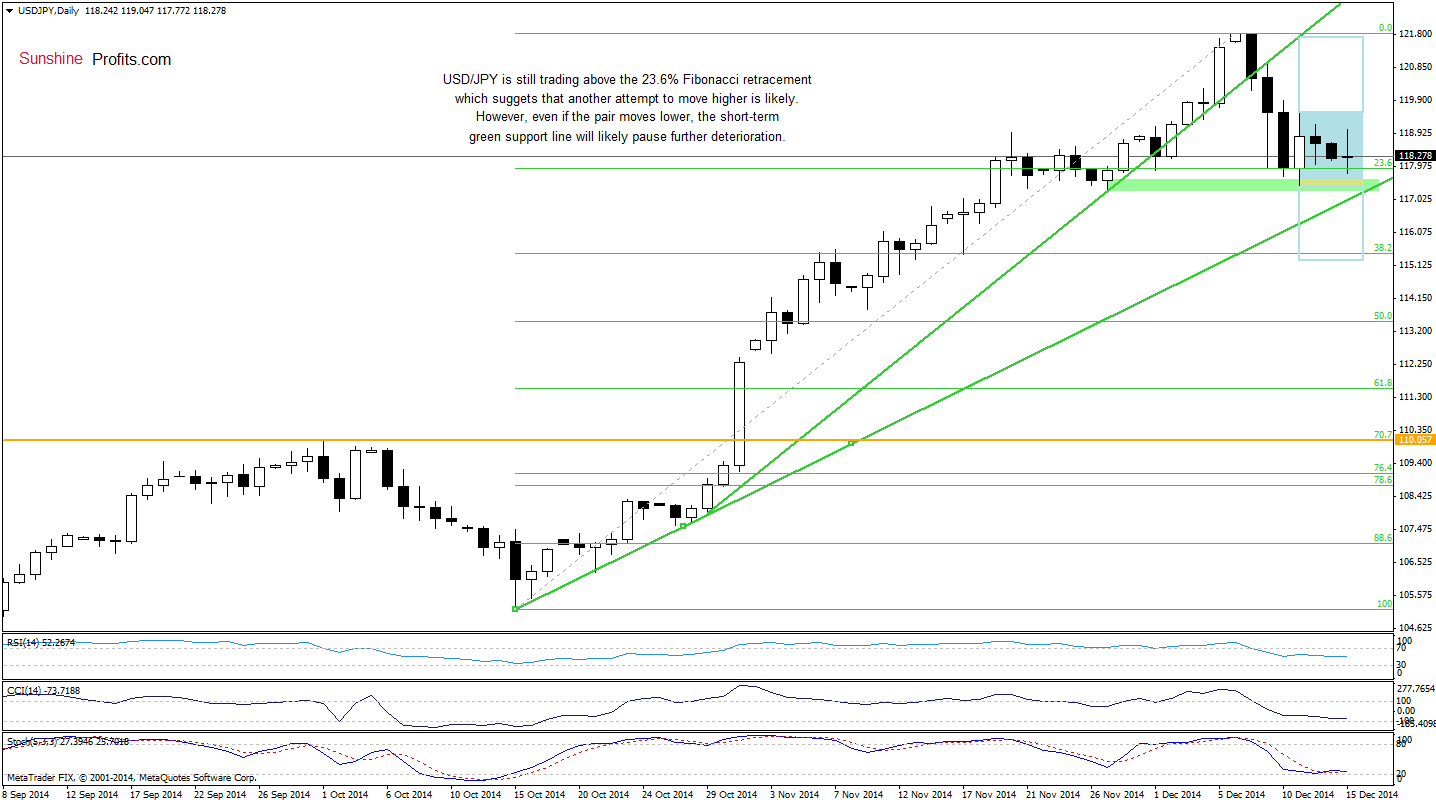
As you see on the above chart, although USD/JPY gave up some gains, the pair is trading in a consolidation (marked with blue), slightly above the 23.6% Fibonacci retracement and the bottom of the previous correction. Therefore, in our opinion, as long as there is no breakout above the upper line of the formation (or breakdown below the lower line) another bigger move is not likely to be seen. Please note that if the pair moves higher, the initial upside target would be around the Dec high of 121.83. On the other hand, if we see a move to the downside, it seems that the short-term green support line (currently around 117.04) will pause further deterioration.
Very short-term outlook: mixed
Short-term outlook: mixed
MT outlook: mixed
LT outlook: bullish
Trading position (short-term; our opinion): No positions are justified from the risk/reward perspective at the moment. We will keep you informed should anything change, or should we see a confirmation/invalidation of the above.
Thank you.
Nadia Simmons
Forex & Oil Trading Strategist
Przemyslaw Radomski, CFA
Founder, Editor-in-chief
Gold & Silver Trading Alerts
Forex Trading Alerts
Oil Investment Updates
Oil Trading Alerts

