
Earlier today, the U.S. Department of Labor showed that the U.S. producer price index fell 0.2% last month, while core producer price inflation (without food, energy and trade), was flat in November, missing analysts’ expectations. Although the Thomson Reuters/University of Michigan preliminary consumer sentiment index climbed to an almost eight-year high of 93.8 this month, the data released earlier continued to weigh on investors’ sentiment and pushed the greenback lower. How did this drop affect the technical picture of major currency pairs?
In our opinion the following forex trading positions are justified - summary:
EUR/USD
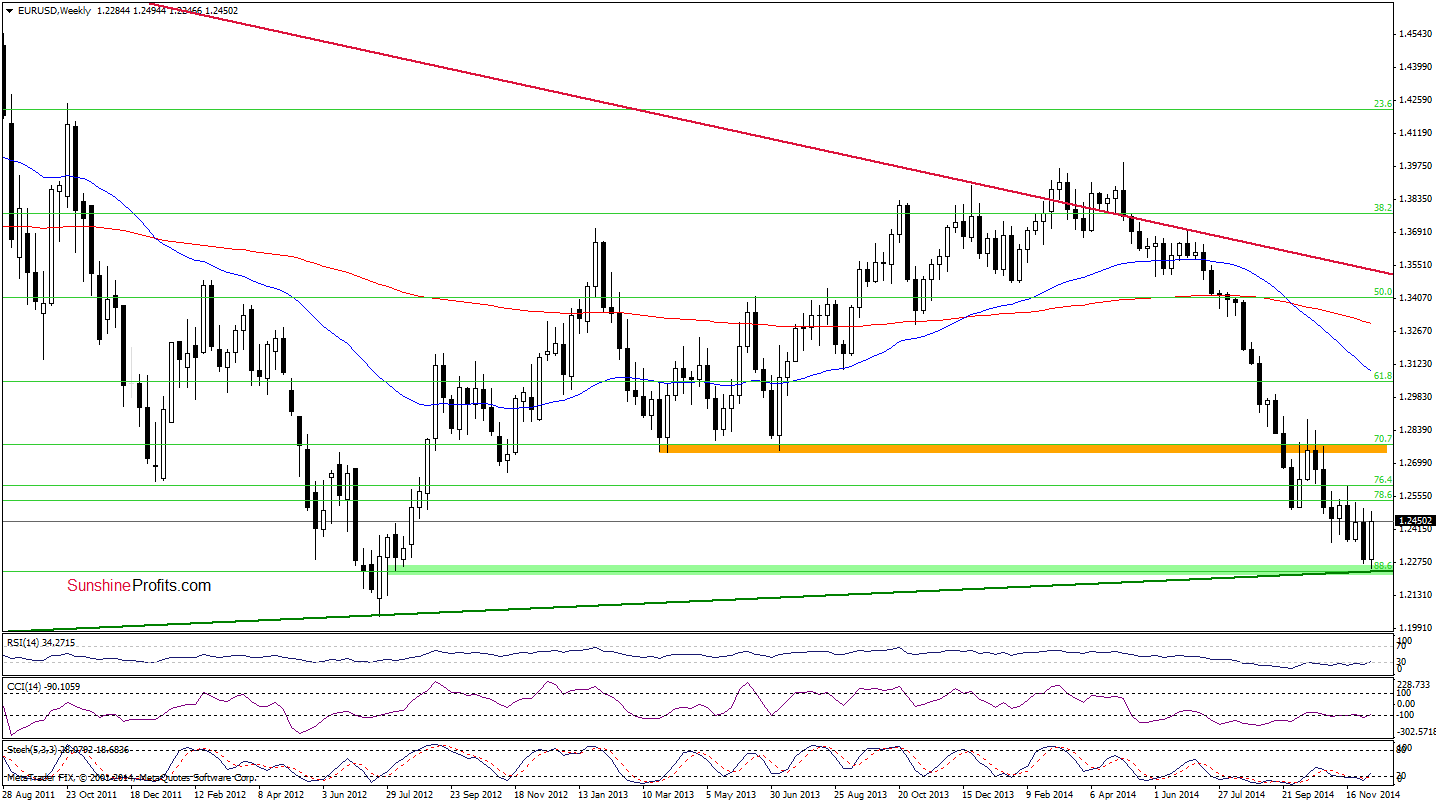
The situation in the medium term hasn’t changed much as EUR/USD is still trading above the long-term support line and the 88.6% Fibonacci retracement. An invalidation of the breakdown below the latter and its positive impact on the exchange rate is still in effect.
Having say that, let’s focus on the daily chart.
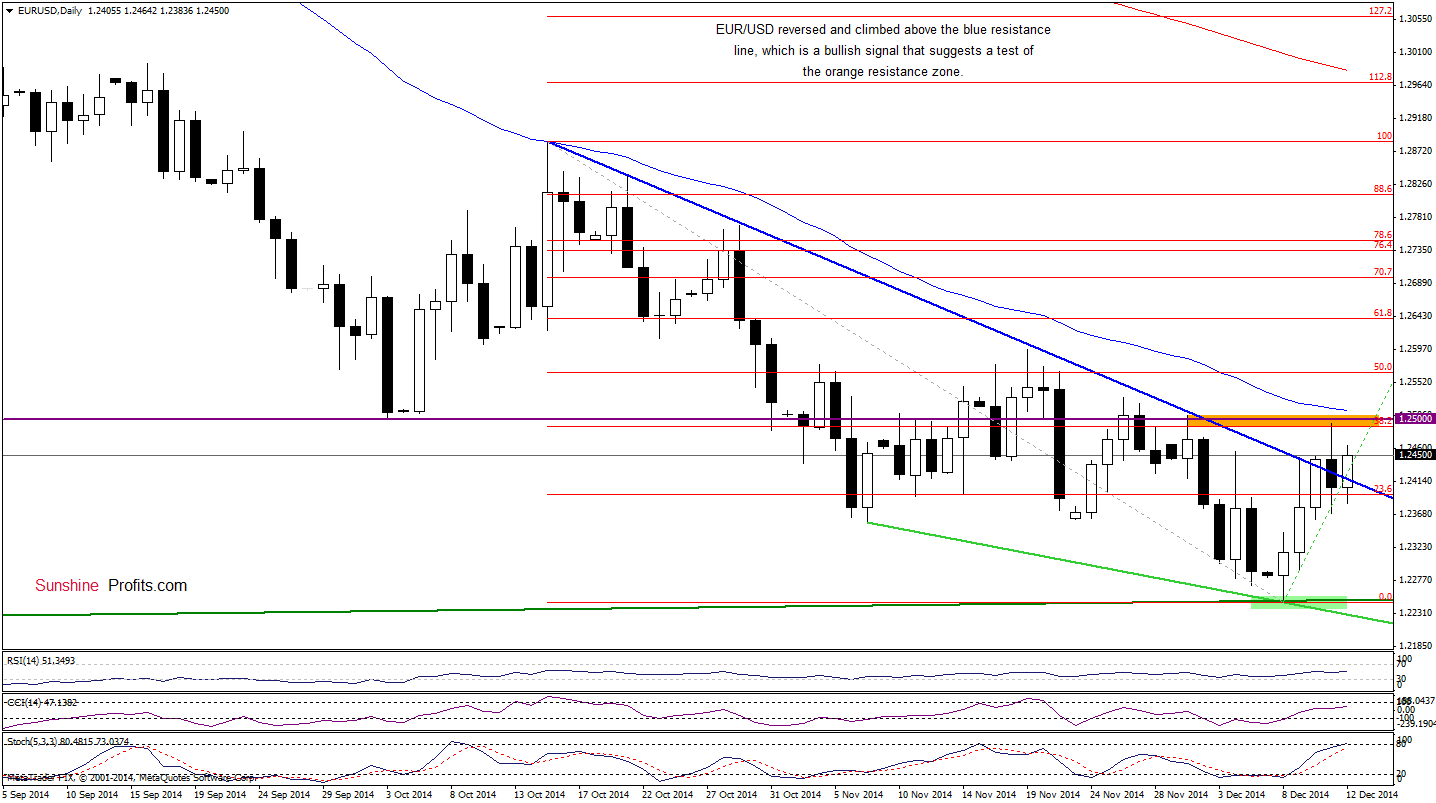
From this perspective, we see that although EUR/USD invalidated the breakout above the blue declining resistance line, the exchange rate rebounded, which resulted in a comeback above this key line. This is a positive signal, however, we think that as long as the pair remains below the orange resistance zone (created by the 38.2% Fibonacci retracement based on the Oct-Dec decline, the barrier of 1.2500 and the Dec high) further improvement is questionable and another attempt to move lower can’t be ruled out. Before we move on to the next currency pair, please note that slightly above the nearest resistance zone there is also the previously-broken 50-day moving average, which reinforces this area. As you see on the above chart, in mid-Oct it was one of the factors, which pushed the pair lower. Therefore, a sizable upward move will be more likely if EUR/USD climbs above it in the coming week.
Very short-term outlook: mixed
Short-term outlook: mixed with bullish bias
MT outlook: mixed
LT outlook: bearish
Trading position (short-term): In our opinion, no positions are justified from the risk/reward perspective at the moment. However, we’ll consider opening long positions if we see a successful breakout above the key resistance zone. We will keep you informed should anything change, or should we see a confirmation/invalidation of the above.
GBP/USD
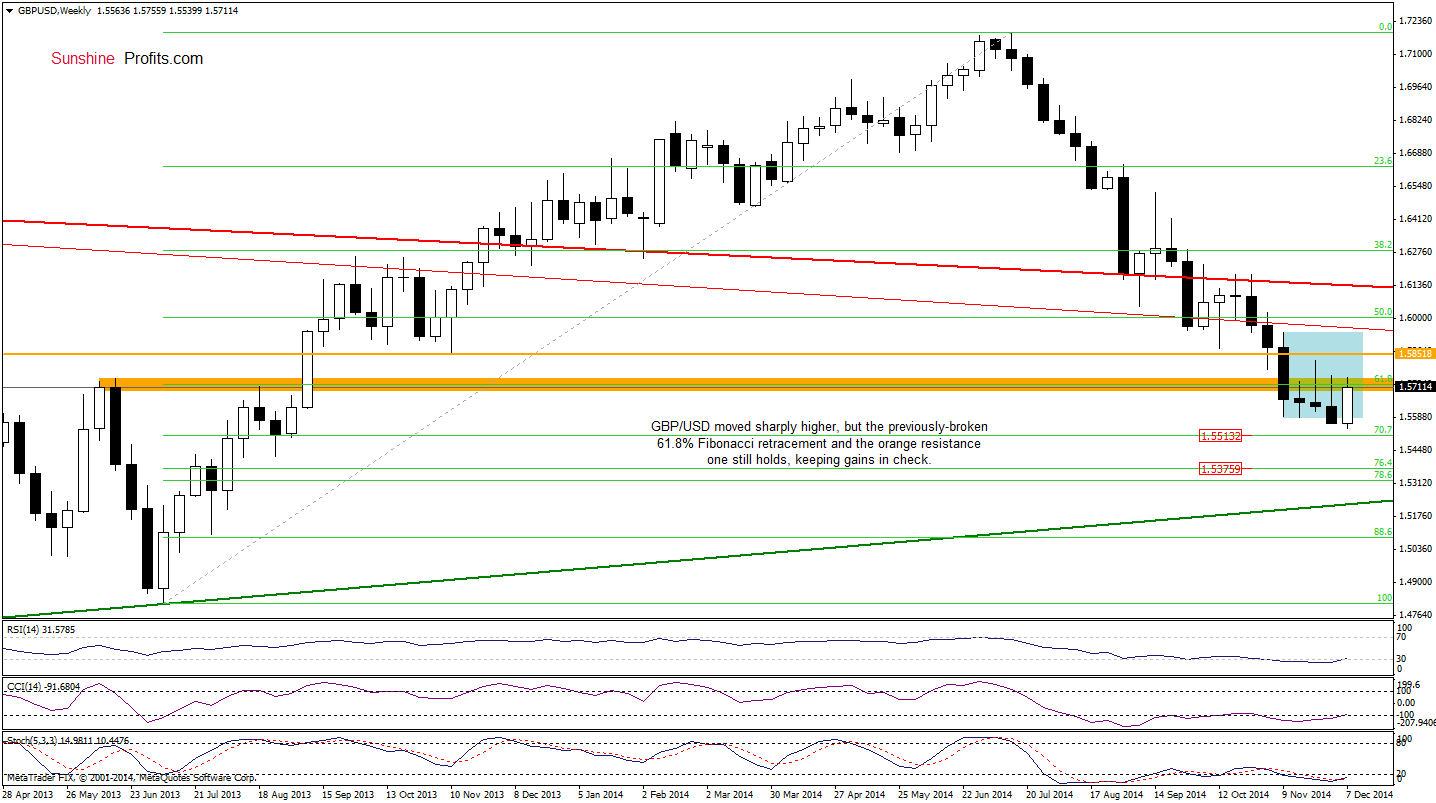
From the medium-term perspective, we see that although GBP/USD moved sharply higher, the previously-broken 61.8% Fibonacci retracement and the orange resistance zone still holds, keeping gains in check. Will we see a breakout in the coming week? Let’s examine the very short-term chart and look for more clues about future moves.
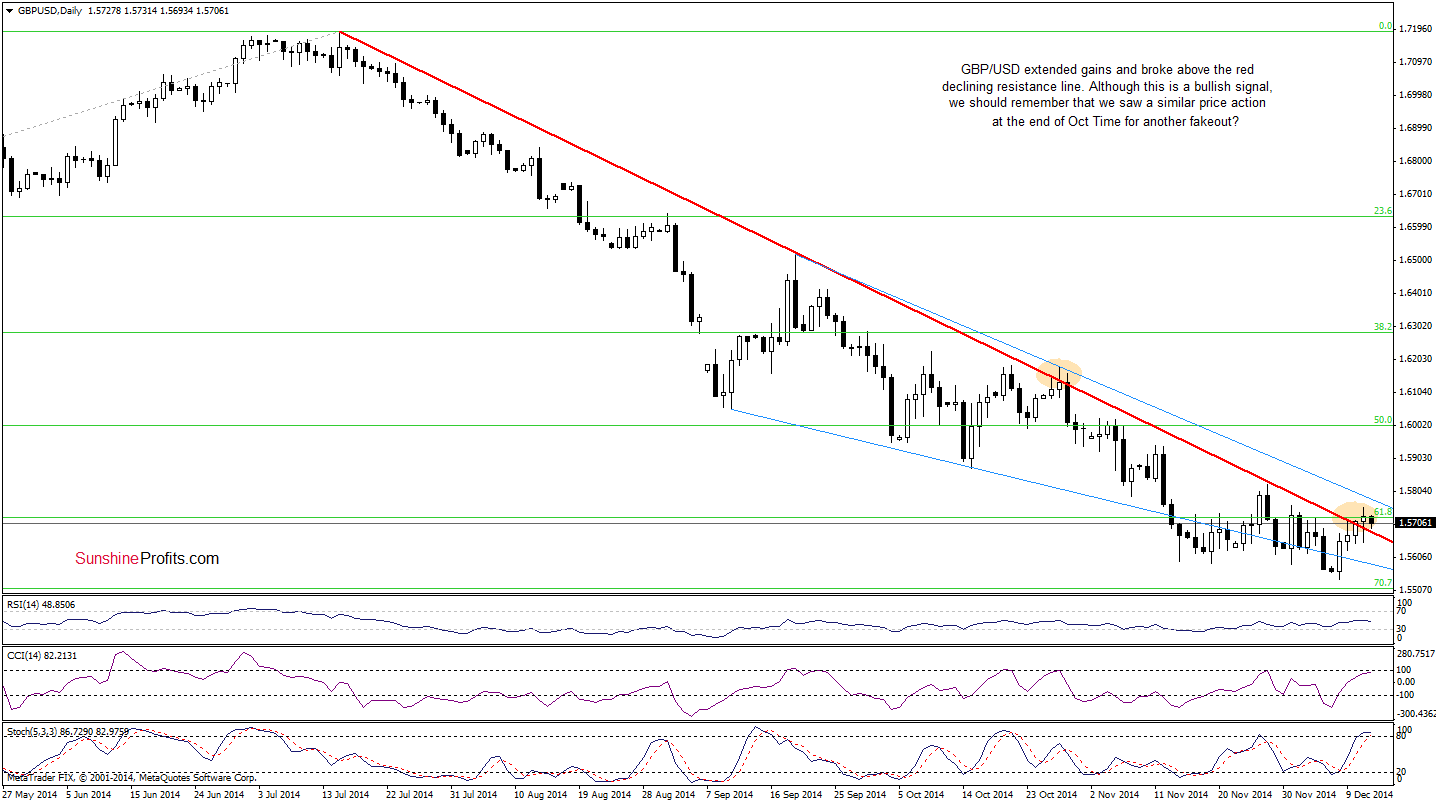
Looking at the above chart, we see that although GBP/USD moved little lower earlier today, the pair is still trading above the red declining resistance line. Therefore, what we wrote yesterday is up-to-date:
(…) Although this is a bullish signal at the first glance, we should keep in mind that we saw similar price action at the end of Oct. Back then, the breakout was invalidated on the following trading day, which triggered a sharp decline. Therefore, we think that as long as we don’t see a confirmation of today’s breakout (by three consecutive daily closures above this line), a sizable rally is not likely to be seen. Please keep in mind that despite today’s increase, the exchange rate is still trading in a ill declining wedge (marked with blue), which means that before we see further improvement, currency bulls will have to push the pair also above this resistance. Until this time, waiting on the sidelines for the confirmation/invalidation of the above is the best choice.
Very short-term outlook: mixed
Short-term outlook: mixed
MT outlook: mixed
LT outlook: mixed
Trading position (short-term): In our opinion, no positions are justified from the risk/reward perspective at the moment. We will keep you informed should anything change, or should we see a confirmation/invalidation of the above.
USD/JPY
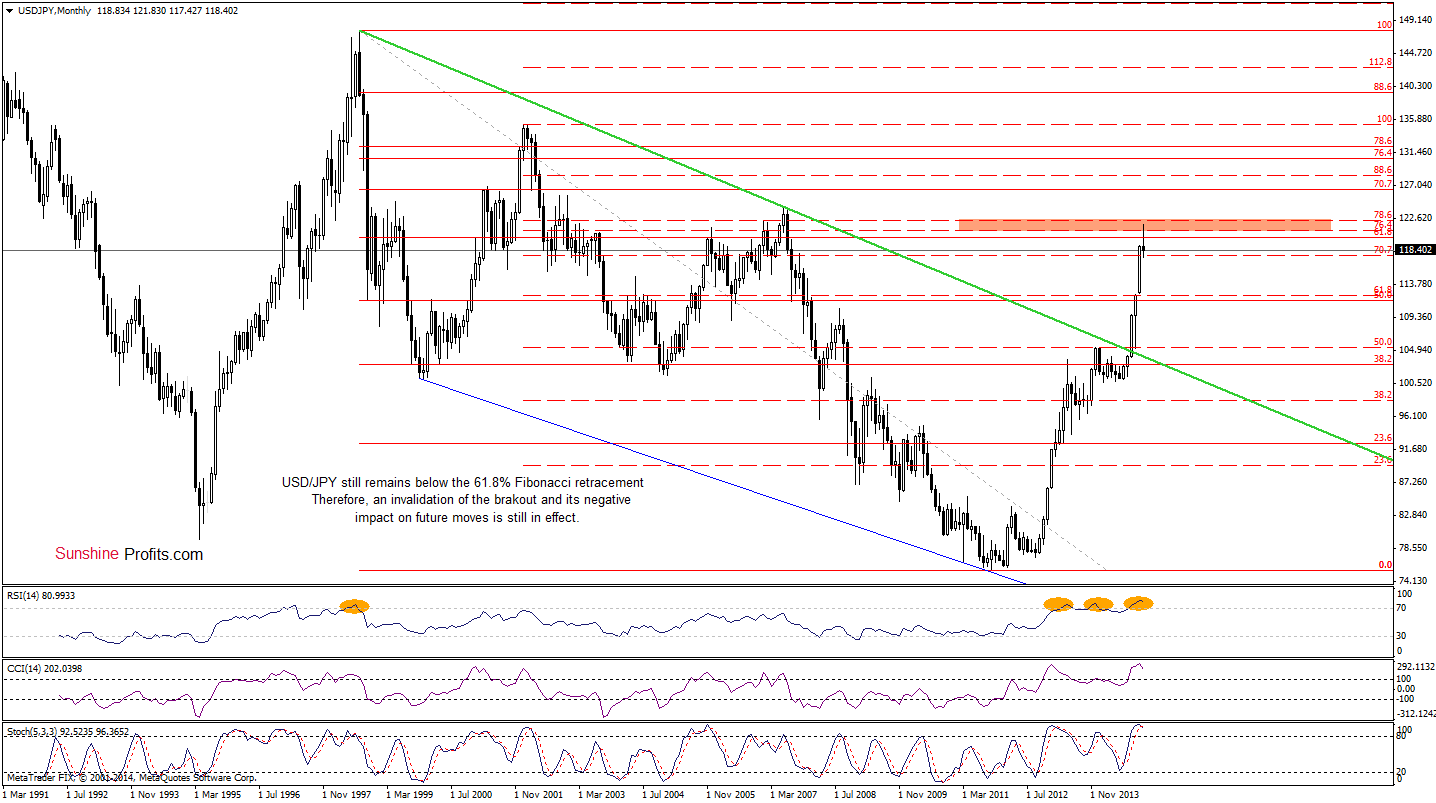
The situation in the long-term hasn’t changed much as an invalidation of the breakout above the 61.8% Fibonacci retracement and its potential negative impact on future moves is still in effect.
Can we infer something ore from the daily chart. Let’s check.
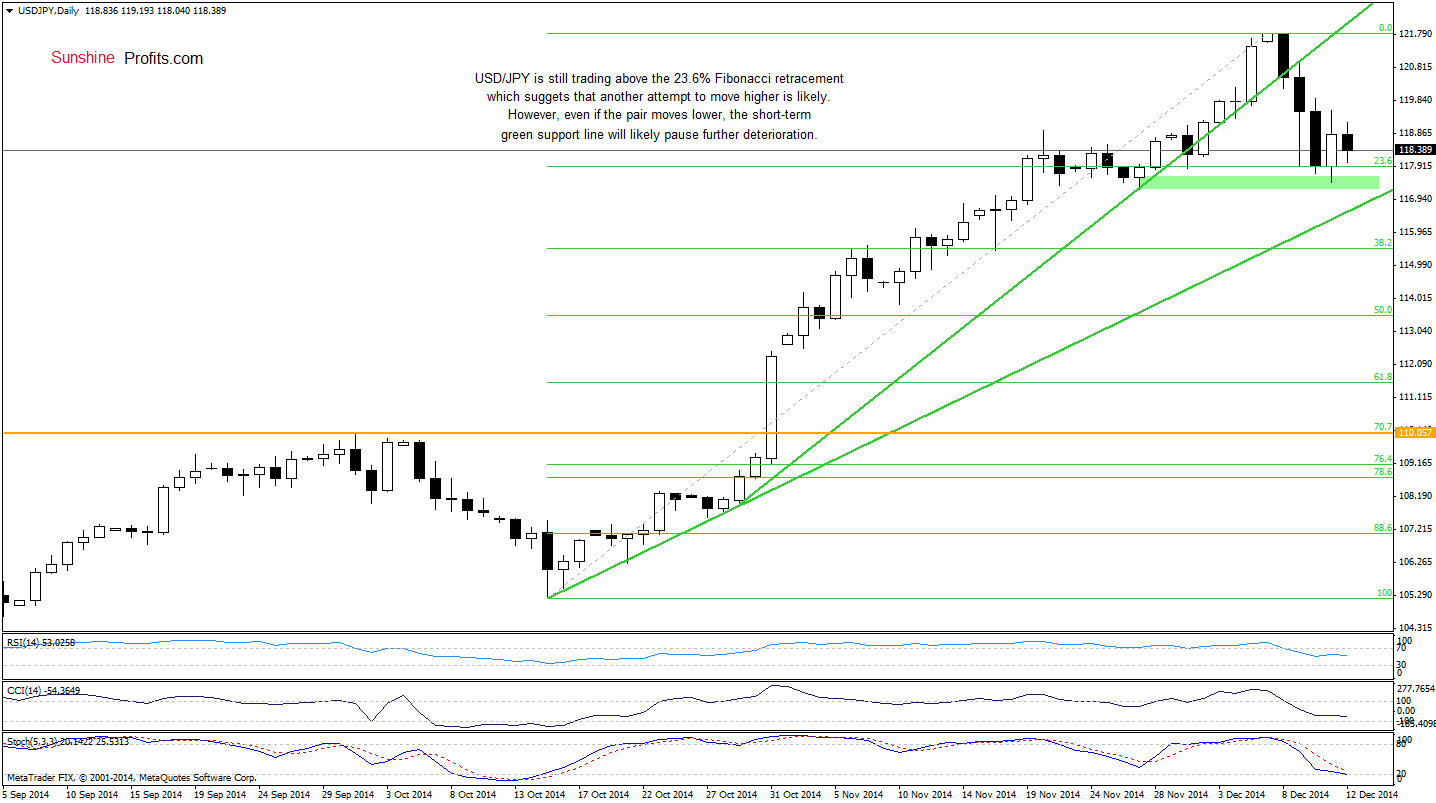
From this perspective we see that although USD/JPY moved lower earlier today, the pair is still trading above the support zone created by the 23.6% Fibonacci retracement and the bottom of the previous correction. This suggests that as long as the pair remains above this area, another attempt to move higher is likely. In our opinion, this scenario will be even more likely if the Stochastic Oscillator generates a buy signal. Finishing this part of today’s alert, please note that even if the exchange rate moves lower, it seems that the short-term green support line will pause further deterioration.
Very short-term outlook: bullish
Short-term outlook: mixed
MT outlook: mixed
LT outlook: bullish
Trading position (short-term; our opinion): No positions are justified from the risk/reward perspective at the moment. We will keep you informed should anything change, or should we see a confirmation/invalidation of the above.
USD/CAD
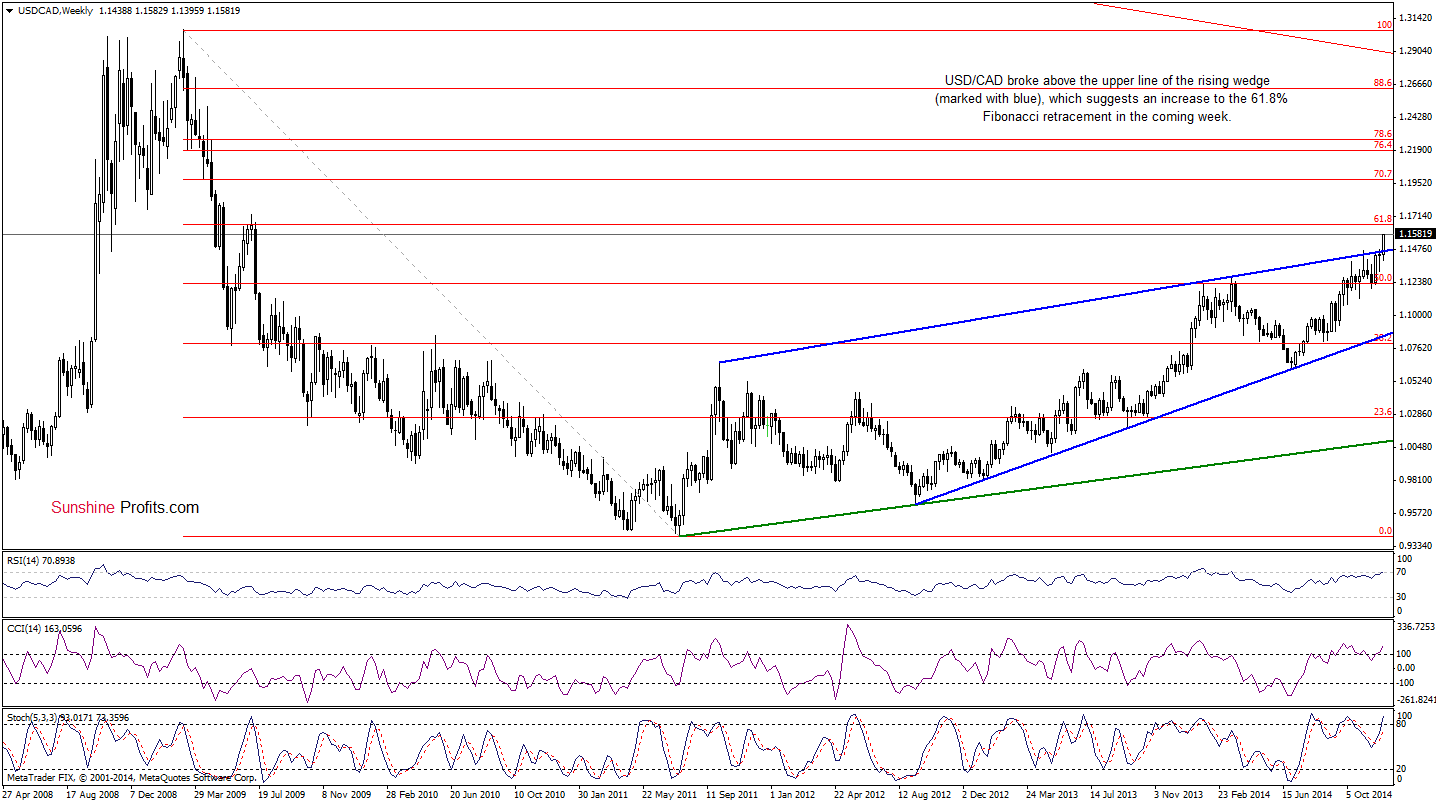
The first thing that catches the eye on the above chart is a breakout above the upper line of the rising wedge (marked with blue). This is a bullish signal, which suggests that we could see an increase to the 61.8% Fibonacci retracement (around 1.1649). At this point, it’s worth noting that slightly above this level is also the Jul 2009 high, which reinforces this area.
Are there any short-term resistance levels that could hinder the realization of this pro growth scenario? Let’s examine the daily chart and find out.
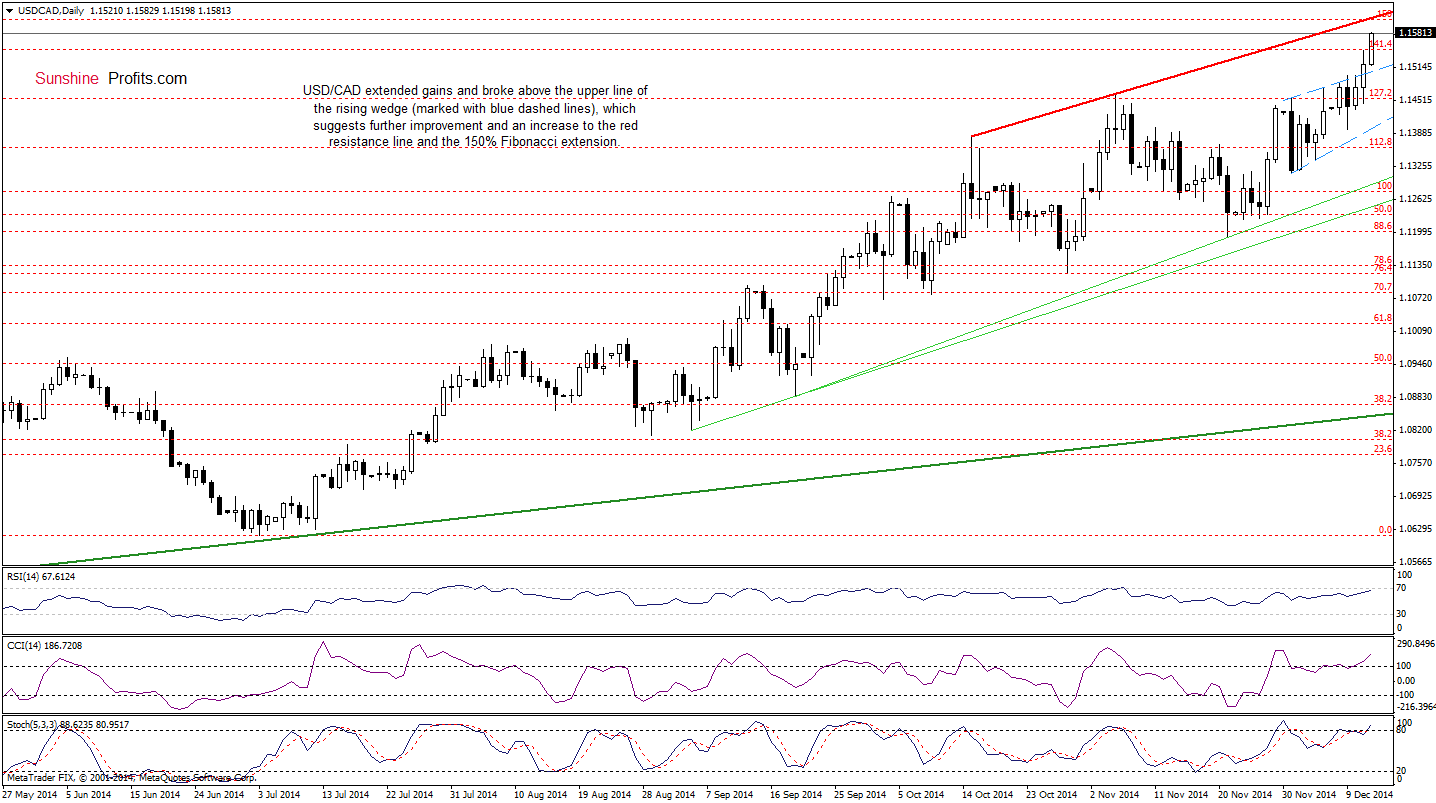
Looking at the above chart, we see that USD/CAD extended gains and hit a fresh 2014 high, breaking above the upper line of the very short-term rising wedge (market with blue dashed lines). This is a bullish signal, which suggests further improvement to around 1.1603, where the red resistance line (based on the Oct and Nov highs) and the 150% Fibonacci extension are. In our opinion, USD/CAD will climb to the 61.8% Fibonacci retracement only if the pair breaks above this resistance area. Please keep in mind that the CCI is overbought, while the RSI and Stochastic Oscillator approached their important levels (additionally there is a negative divergence between the latter and the exchange rate), which suggests that the space for further gains might be limited.
Very short-term outlook: bullish
Short-term outlook: mixed
MT outlook: mixed
LT outlook: mixed
Trading position (short-term; our opinion): No positions are justified from the risk/reward perspective at the moment. We will keep you informed should anything change, or should we see a confirmation/invalidation of the above.
USD/CHF
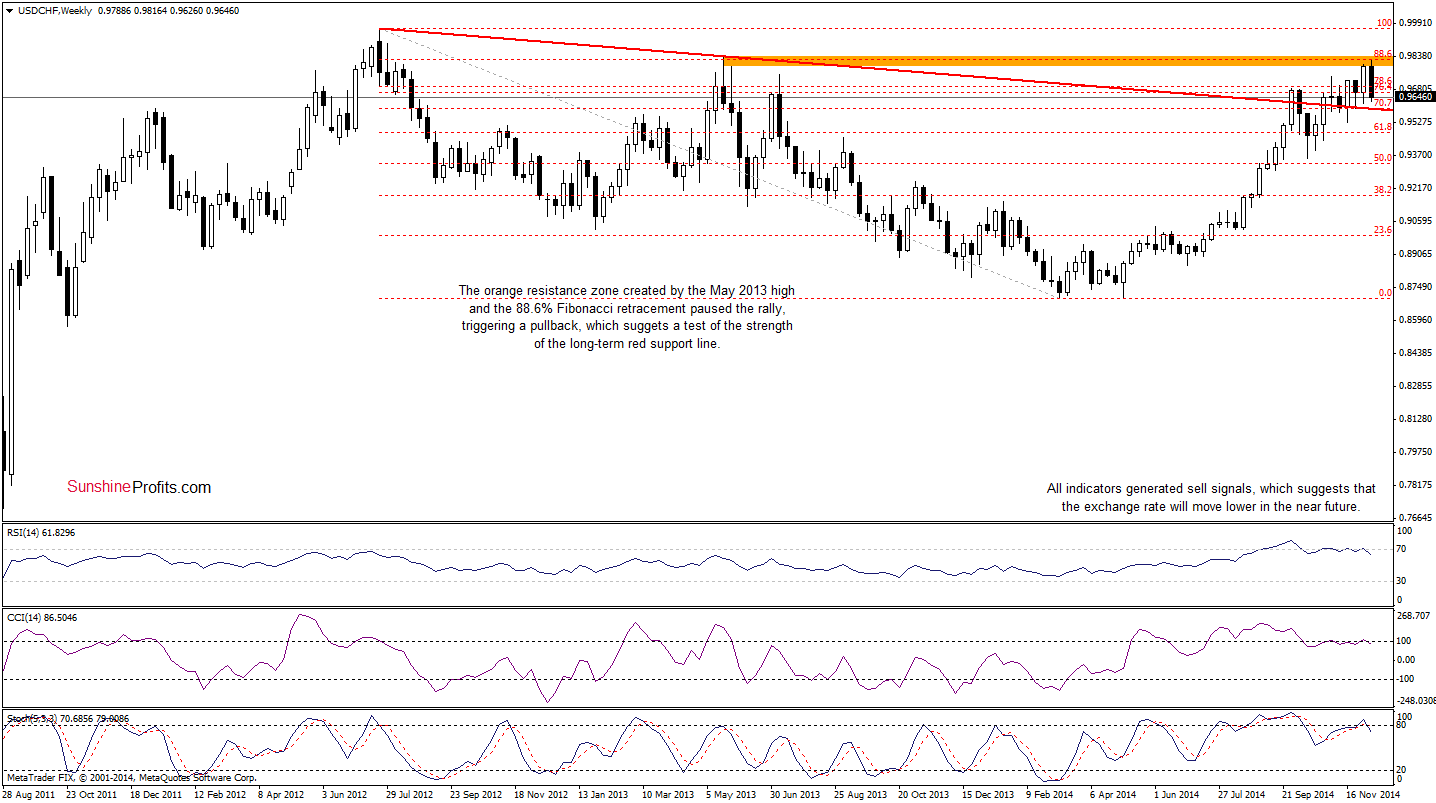
Looking at the above chart, we see that the USD/CHF reversed and declined below the Nov high and the 78.6% Fibonacci retracement, which suggests a drop to the long-term red declining support line. However, we think that this scenario will be more likely if the pair drops below the short-term key support line. Let’s move on to the daily chart, to see it more clearly.
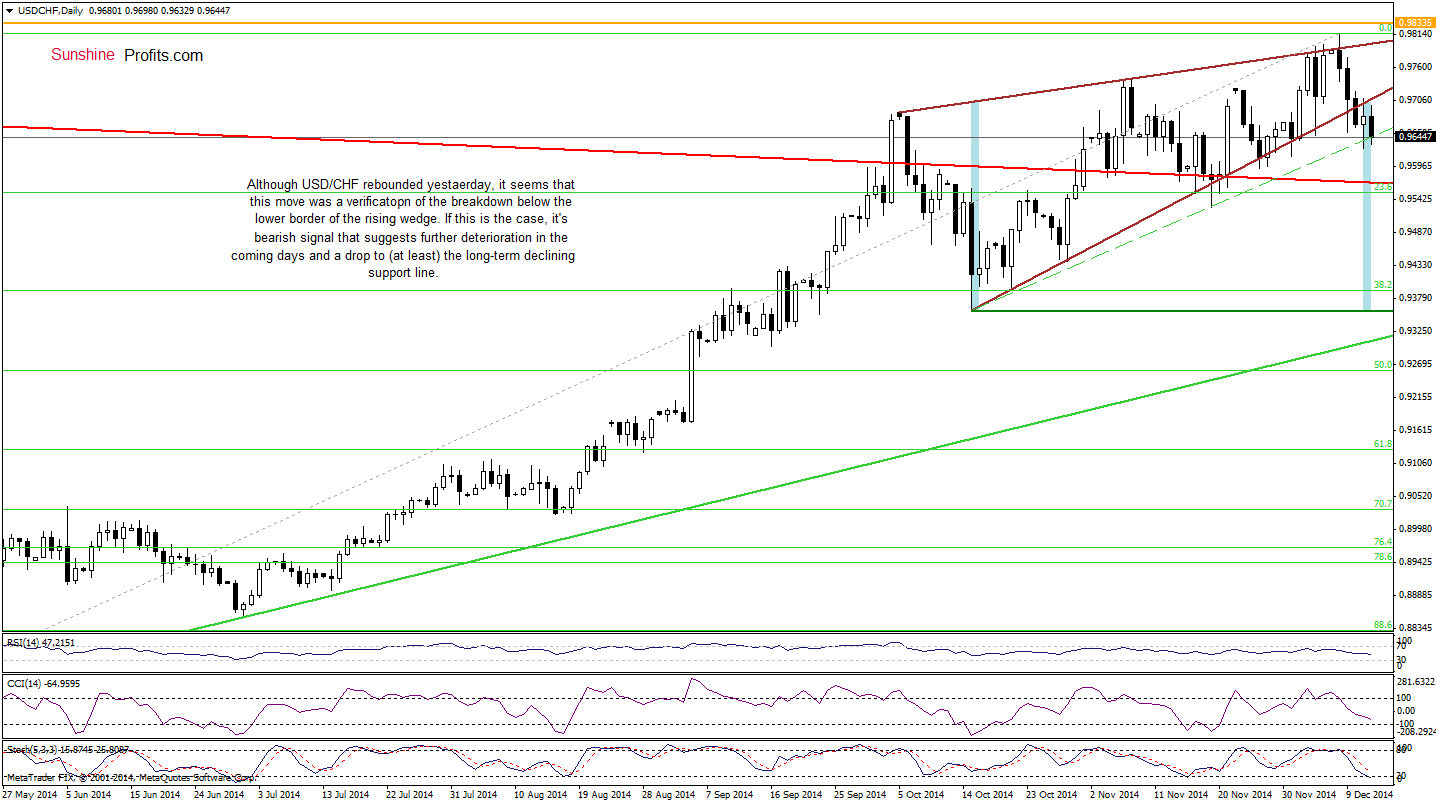
Although USD/CHF rebounded yesterday, it seems that this move was a verification of the breakdown below the lower border of the lower border of the rising wedge. Therefore, we believe that what we wrote on Wednesday is up-to-date:
(…) a breakdown below this line suggests that we could see a drop even to around the Oct low of 0.9358. The reason? Slightly below this support, the size of the downward move will correspond to the height of the formation. However, before we see a realization of this potential scenario, currency bears will have to push the pair below 0.9595, where the long-term red support line is.
Very short-term outlook: bearish
Short-term outlook: mixed with bearish bias
MT outlook: mixed
LT outlook: bearish
Trading position (short-term; our opinion): No positions are justified from the risk/reward perspective at the moment. We will keep you informed should anything change, or should we see a confirmation/invalidation of the above.
AUD/USD
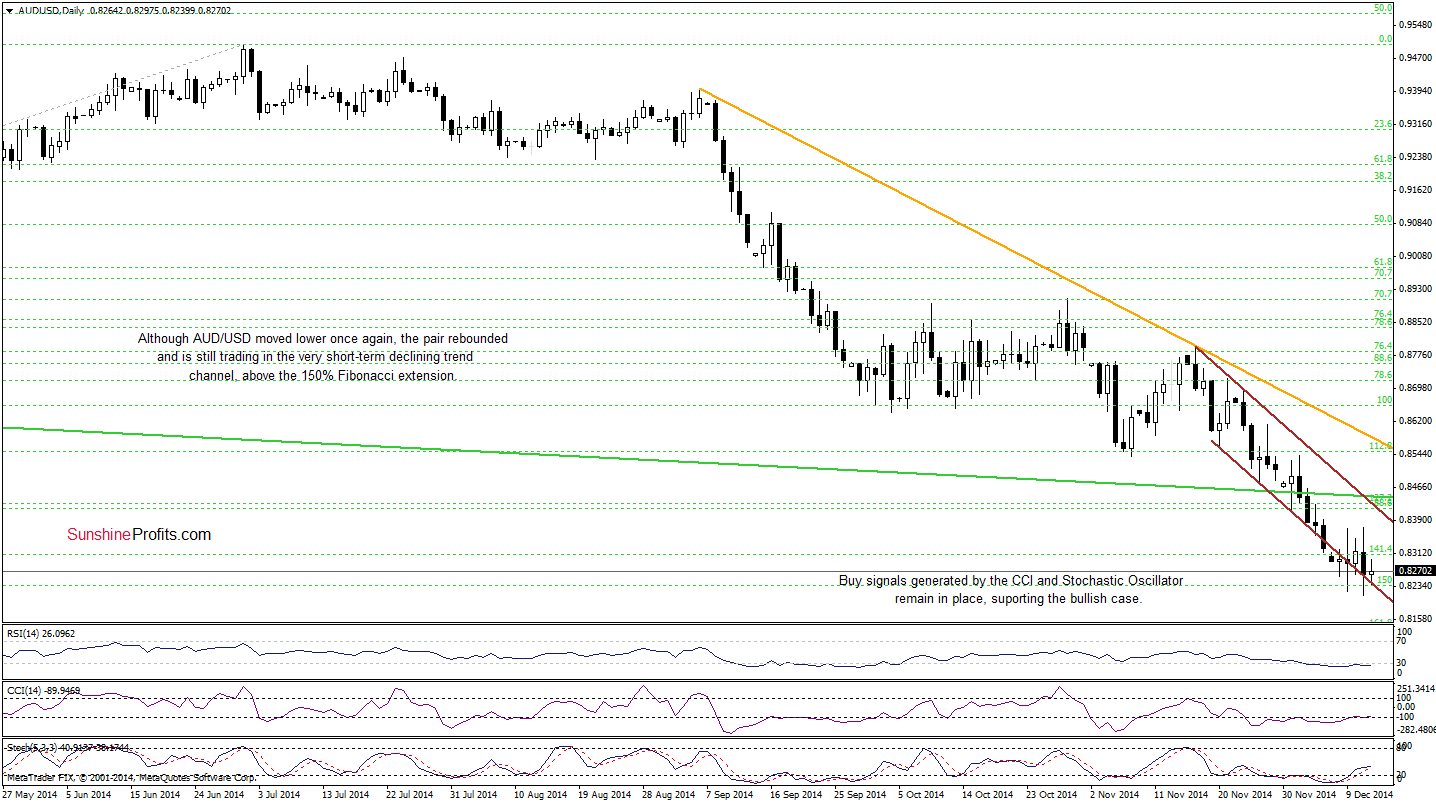
From this perspective, we see that although AUD/USD extended losses and hit a fresh 2014 low, the pair rebounded and is still trading above the lower border of the declining trend channel. Additionally, buy signals generated by the indicators are still in play. Therefore, we think that as long as there is no daily close below this key very short-term support line, bigger downswing is not likely to be seen. This scenario is also reinforced by the medium-term picture. Let’s take a closer look at the weekly chart.
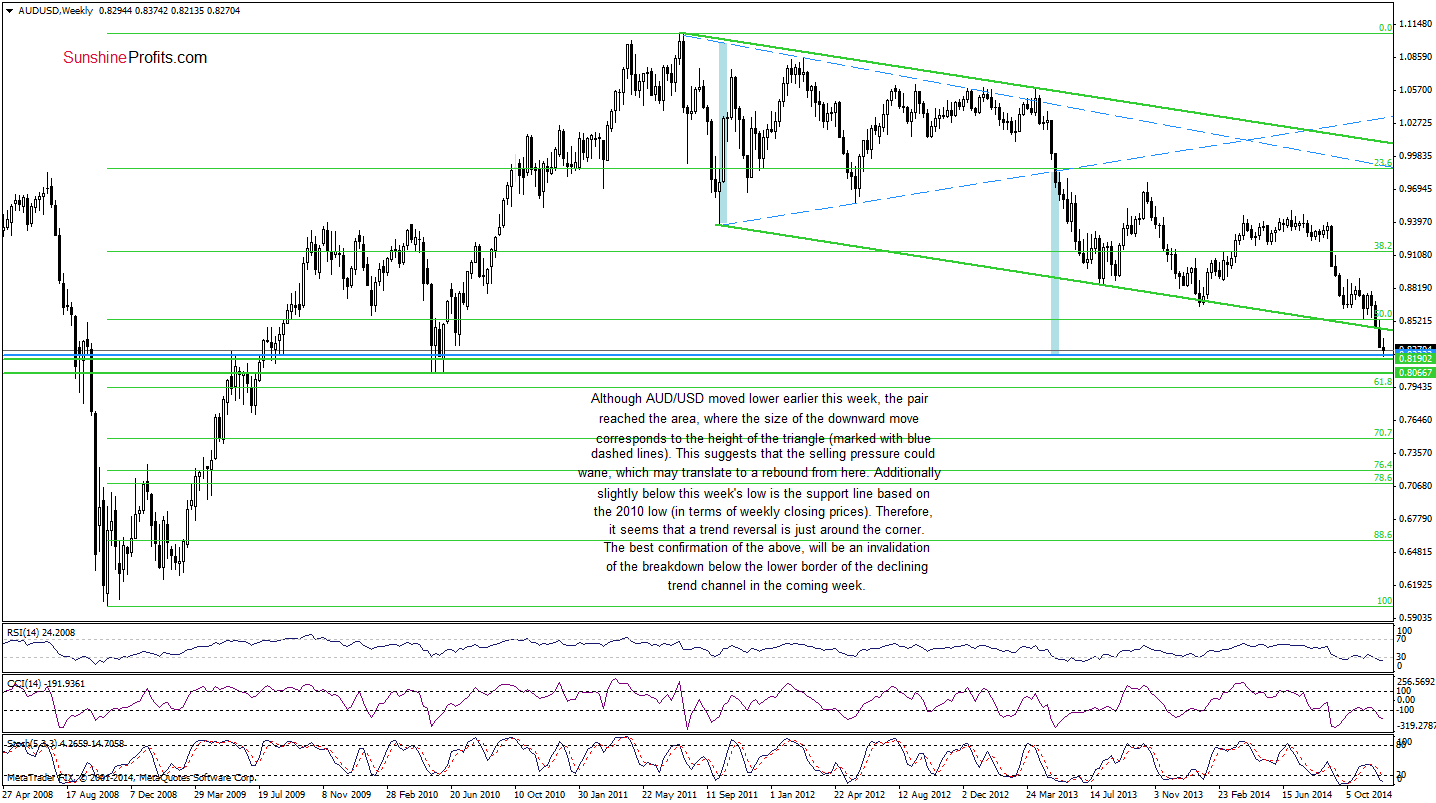
From this perspective, we see that AUD/USD remains above the blue line, which means that our last commentary on this currency pair is still valid:
(…) the pair reached the area, where the size of the downward move corresponds to the height of the triangle (marked with blue dashed lines). This suggests that the selling pressure could wane, which may translate to a rebound from here. Additionally, slightly below this week’s low is the support line based on the 2010 lows (in terms of weekly closing prices). Therefore, it seems to us that the space for further declines is limited and a trend reversal is just around the corner. Nevertheless, we should keep in mind that the best confirmation of the above will be an invalidation of the breakdown below the lower border of the trend channel. In our opinion, if we see such price action, a sizable upward move will be more likely and reliable. Until this time, waiting on the sidelines for the confirmation that the final bottom is in is the best choice at the moment.
Very short-term outlook: mixed with bullish bias
Short-term outlook: mixed
MT outlook: mixed
LT outlook: mixed
Trading position (short-term): In our opinion, no positions are justified from the risk/reward perspective at the moment. We will keep you informed should anything change, or should we see a confirmation/invalidation of the above.
Thank you.
Nadia Simmons
Forex & Oil Trading Strategist
Przemyslaw Radomski, CFA
Founder, Editor-in-chief
Gold & Silver Trading Alerts
Forex Trading Alerts
Oil Investment Updates
Oil Trading Alerts

