
Earlier today, the U.S. Department of Labor reported that the initial jobless claims in the week ending December 6 dropped by 3,000 to 294,000, beating forecast. Additionally, the U.S. Commerce Department showed that retail sales increased by 0.7% last month, beating expectations for a gain of 0.4%, while core retail sales (without automobile sales), increased by 0.5% in November, surpassing forecasts for a 0.1% gain. These bullish numbers supported the greenback and pushed GBP/USD lower, but the pair is still trading close to the key resistance line. What’s next?
In our opinion the following forex trading positions are justified - summary:
EUR/USD
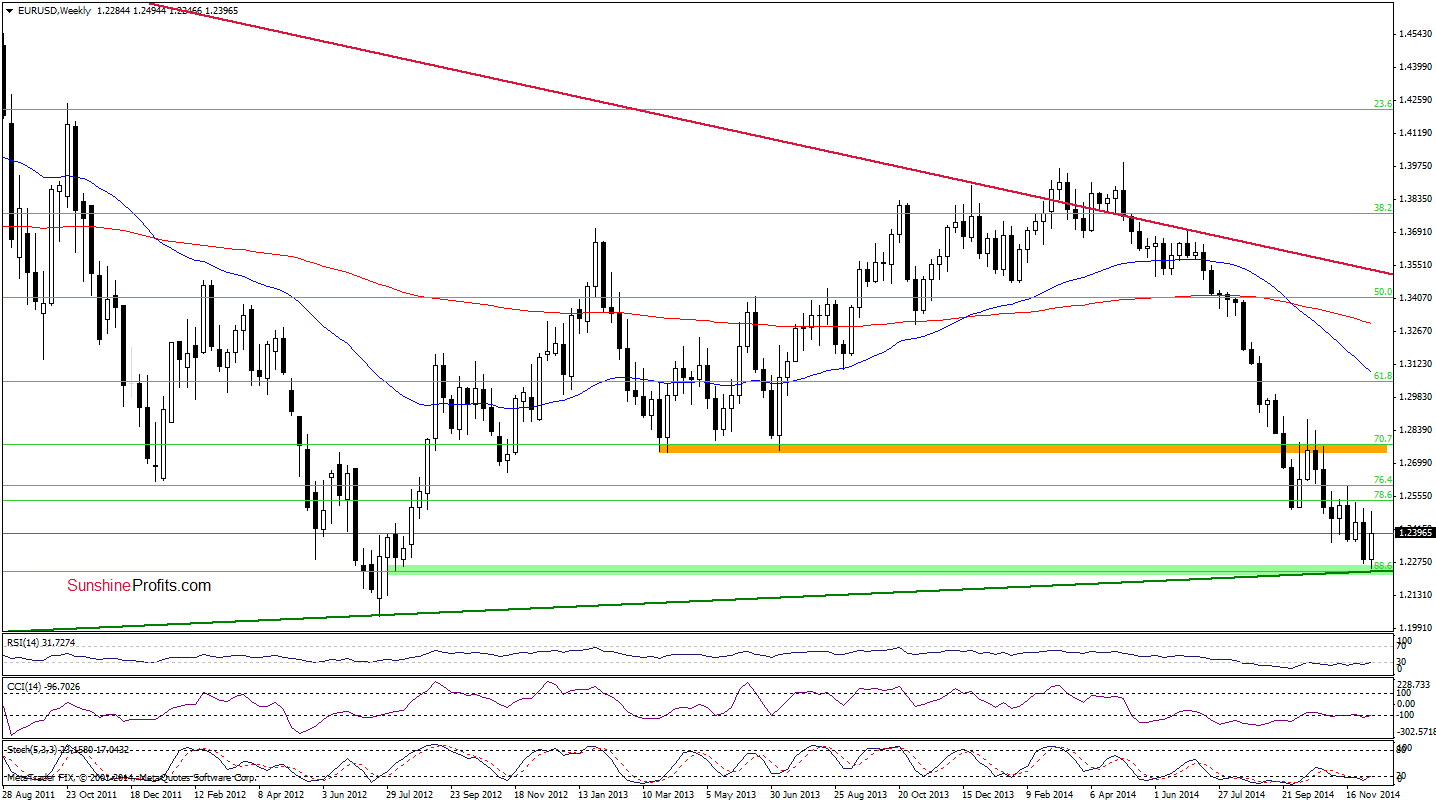
The situation in the medium term hasn’t changed much as EUR/USD is still trading above the long-term support line and the 88.6% Fibonacci retracement. An invalidation of the breakdown below the latter and its positive impact on the exchange rate is still in effect.
Having say that, let’s focus on the daily chart.
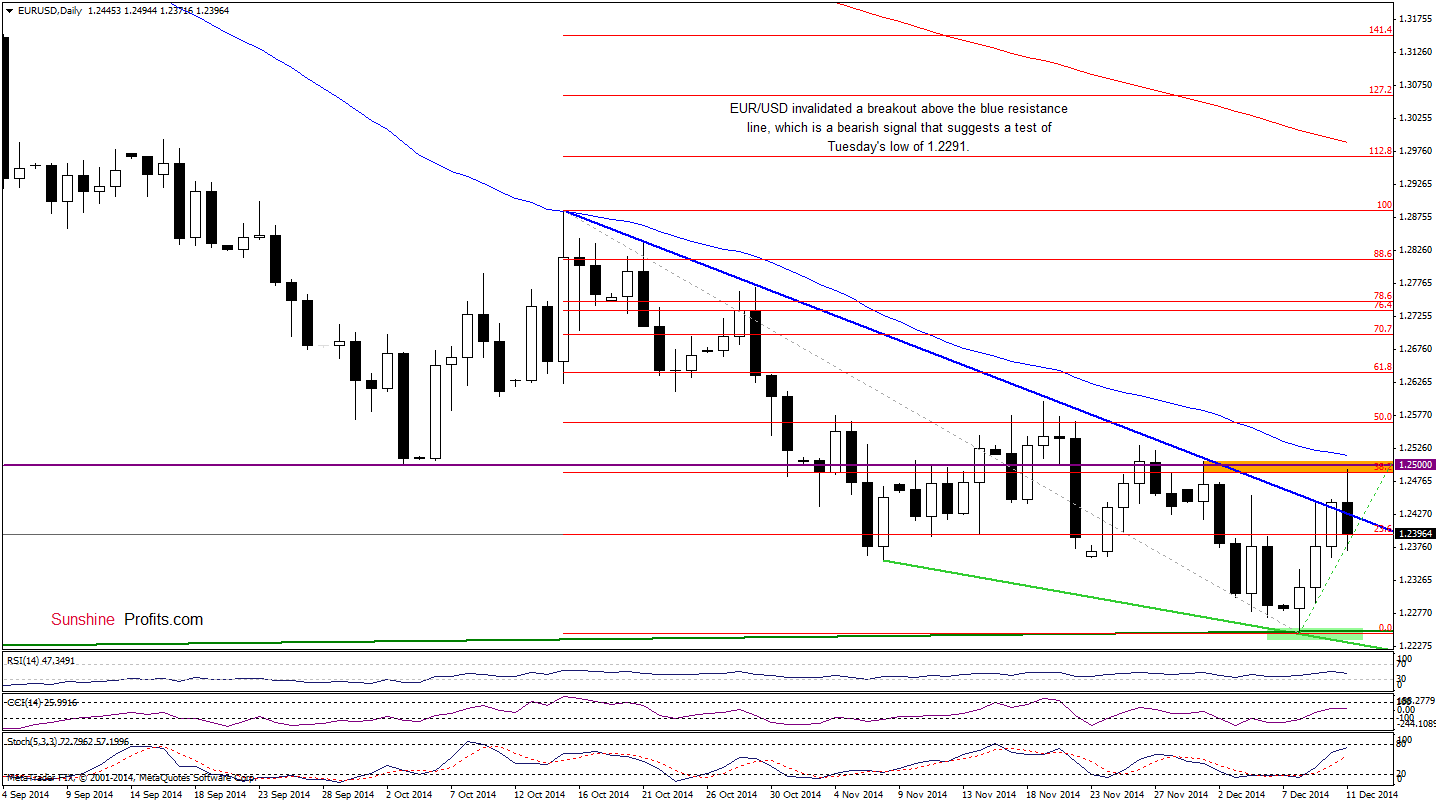
From this perspective, we see that although EUR/USD climbed above the blue declining resistance line, the orange resistance zone (created by the 38.2% Fibonacci retracement based on the Oct-Dec decline, the barrier of 1.2500 and the Dec high) stopped further improvement, triggering a sharp pullback. With this downswing, the exchange rate dropped below the blue line, invalidating earlier breakout. This is a negative signal, which suggests further deterioration and a test of Tuesday’s low of 1.2291 in the near future.
Very short-term outlook: bearish
Short-term outlook: mixed with bullish bias
MT outlook: mixed
LT outlook: bearish
Trading position (short-term): In our opinion, no positions are justified from the risk/reward perspective at the moment. However, we’ll consider opening long positions if we see a successful breakout above the key resistance line. We will keep you informed should anything change, or should we see a confirmation/invalidation of the above.
GBP/USD
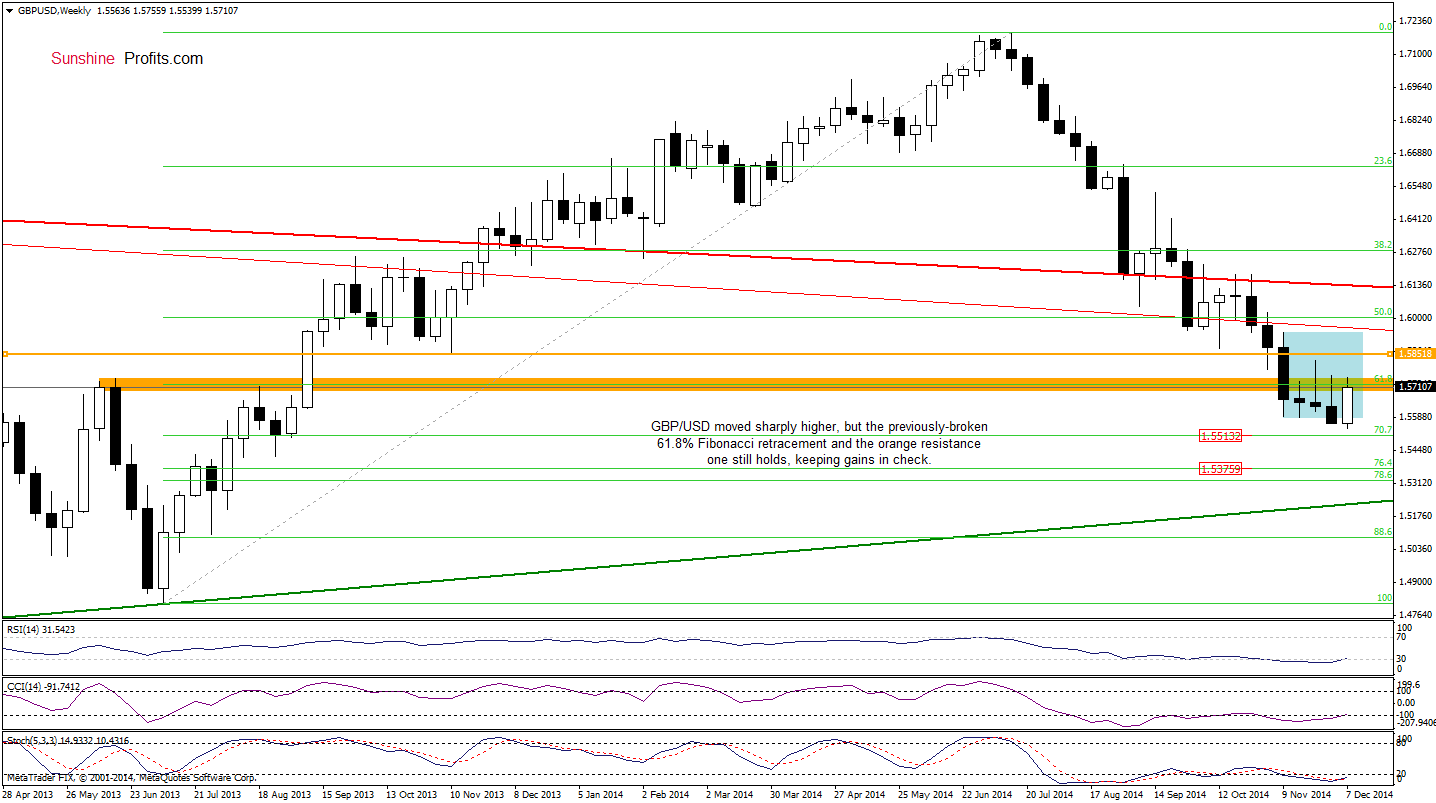
From the medium-term perspective, we see that although GBP/USD moved sharply higher, the previously-broken 61.8% Fibonacci retracement and the orange resistance zone still holds, keeping gains in check. Will we see a breakout in the coming week? Let’s examine the very short-term chart and look for more clues about future moves.
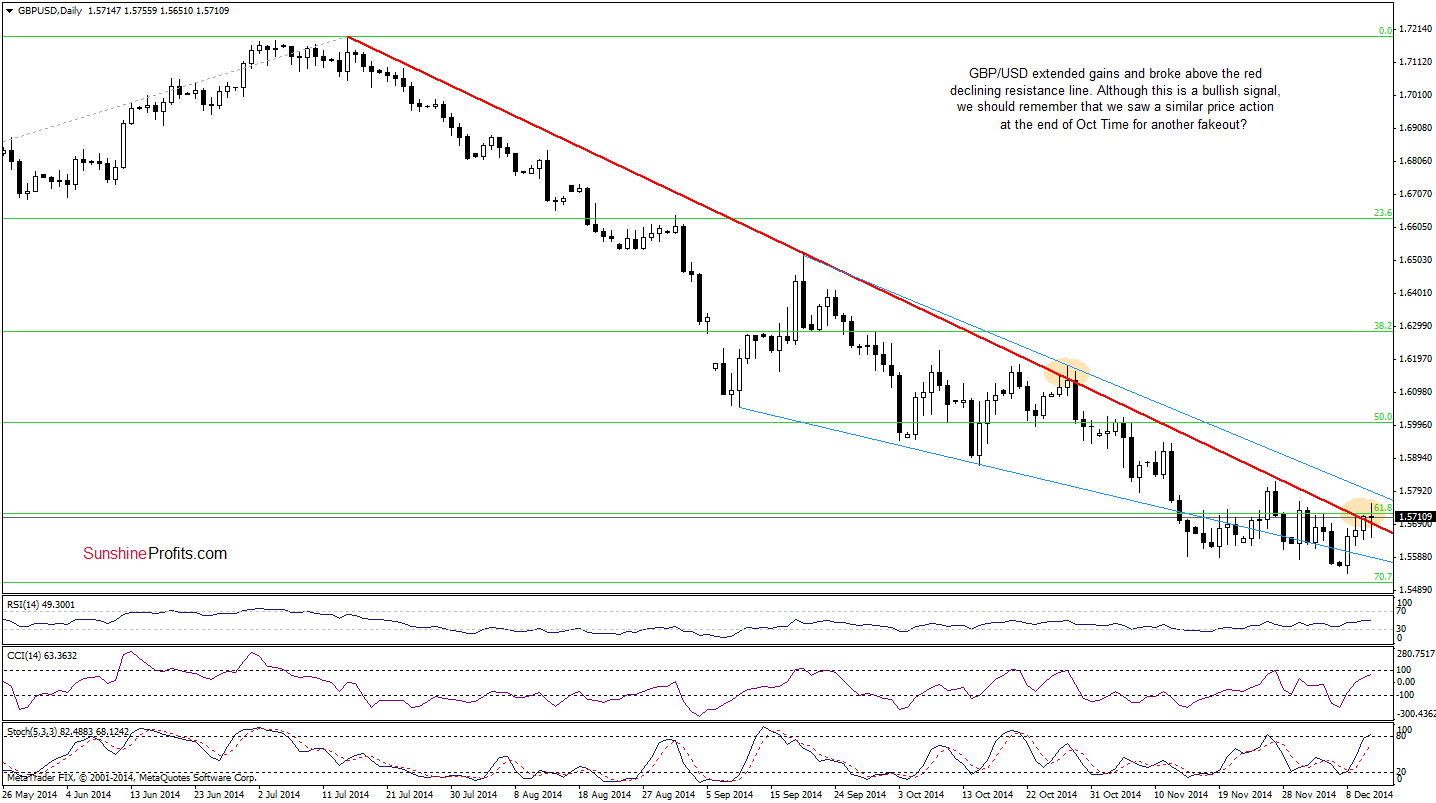
As you see on the daily chart, GBP/USD extended gains and broke above the red declining resistance line earlier today. Although this is a bullish signal at the first glance, we should keep in mind that we saw similar price action at the end of Oct. Back then, the breakout was invalidated on the following trading day, which triggered a sharp decline. Therefore, we think that as long as we don’t see a confirmation of today’s breakout (by three consecutive daily closures above this line), a sizable rally is not likely to be seen. Please keep in mind that despite today’s increase, the exchange rate is still trading in a declining wedge (marked with blue), which means that before we see further improvement, currency bulls will have to push the pair also above this resistance. Until this time, waiting on the sidelines for the confirmation/invalidation of the above is the best choice.
Very short-term outlook: mixed
Short-term outlook: mixed
MT outlook: mixed
LT outlook: mixed
Trading position (short-term): In our opinion, no positions are justified from the risk/reward perspective at the moment. We will keep you informed should anything change, or should we see a confirmation/invalidation of the above.
USD/JPY
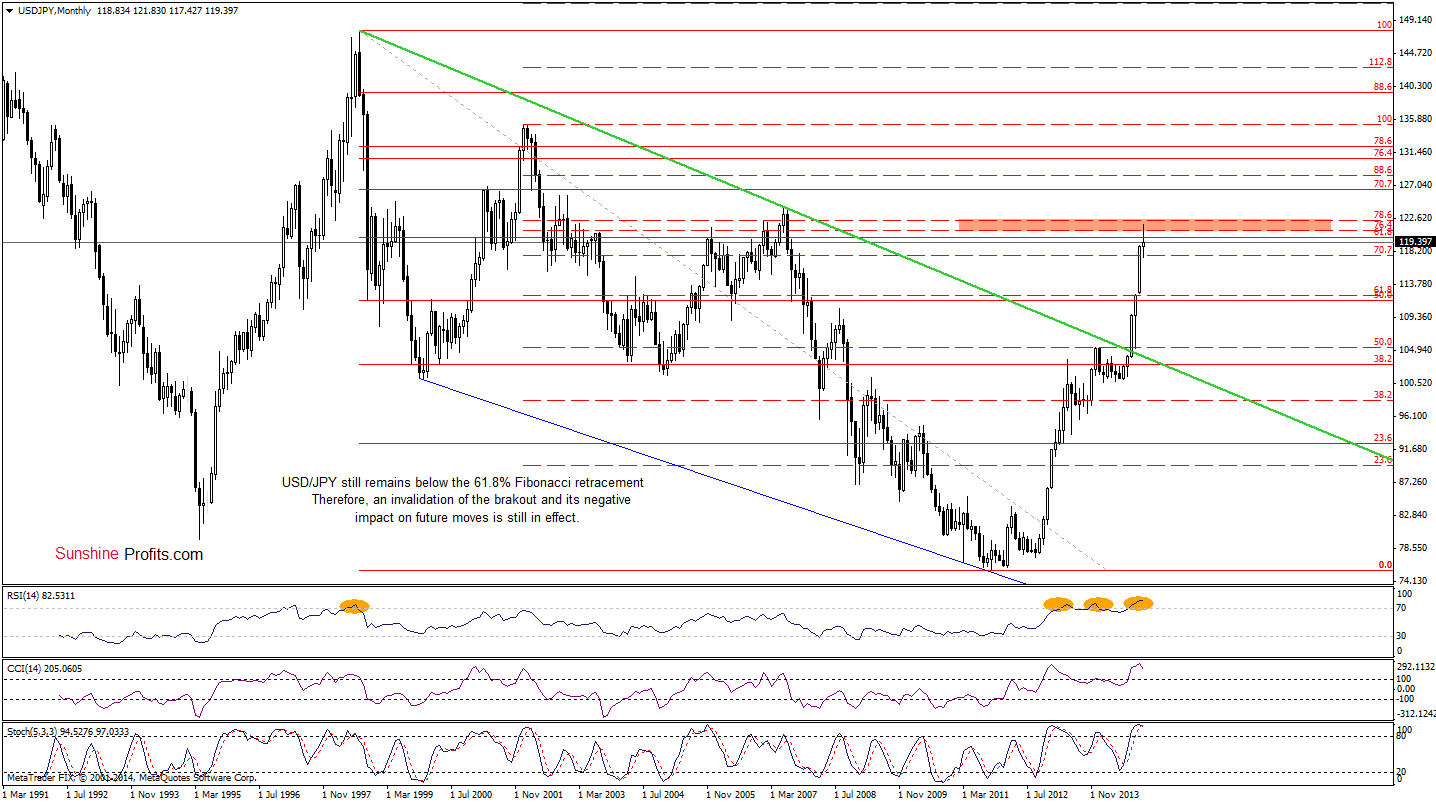
The situation in the long-term hasn’t changed much as an invalidation of the breakout above the 61.8% Fibonacci retracement and its potential negative impact on future moves is still in effect.
Can we infer something ore from the daily chart. Let’s check.
In our last commentary on this currency pair, we wrote the following:
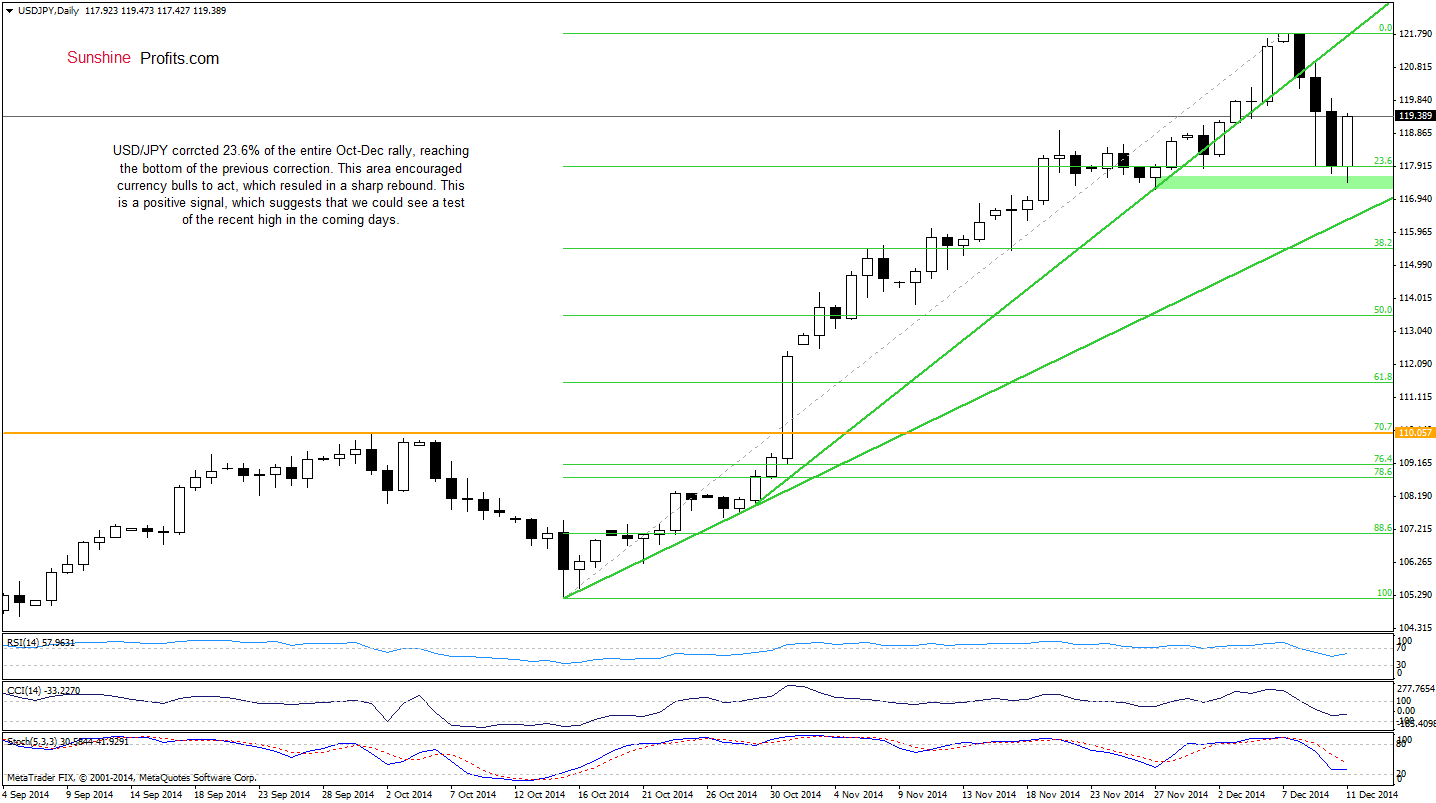
(…) a pullback (…) took the exchange rate not only below the 61.8% Fibonacci retracement, but also under the short-term green support line. With this downswing, the pair invalidated the breakout above the 314.2% and 300% Fibonacci extensions, which is an additional negative sign. On top of that, all indicators generated sell signals, which suggests that the next move will be to the downside. If this is the case, the initial target for currency bears will be around 117.90, where the 23.6% Fibonacci retracement based on the entire Oct-Dec rally is.
Looking at the daily chart, we see that the situation developed in line with the above-mentioned scenario and USD/JPY reached our downside target. With this downswing the pair also dropped to the bottom of the previous correction. As you see, this area encouraged currency bulls to act, which resulted in a sharp rebound. This is a positive signal, which suggests that we could see a test of the recent high (in this area is also the previously-broken short-term green line, which serves as a resistance at the moment) in the coming days. In our opinion, this scenario will be even more likely if the Stochastic Oscillator generates a buy signal.
Very short-term outlook: bullish
Short-term outlook: mixed
MT outlook: mixed
LT outlook: bullish
Trading position (short-term; our opinion): No positions are justified from the risk/reward perspective at the moment. We will keep you informed should anything change, or should we see a confirmation/invalidation of the above.
Thank you.
Nadia Simmons
Forex & Oil Trading Strategist
Przemyslaw Radomski, CFA
Founder, Editor-in-chief
Gold & Silver Trading Alerts
Forex Trading Alerts
Oil Investment Updates
Oil Trading Alerts

