
Earlier today, the Labor Department showed that the U.S. economy added 321,000 jobs in the previous month, beating analysts’ expectations for jobs growth of 225,000. Additionally, the U.S. unemployment rate remained unchanged at 5.8% last month. These stronger-than-expected numbers pushed the USD Index to a fresh multi-year high of 89.49. How did this rally affect the technical picture of major currency pairs?
In our opinion the following forex trading positions are justified - summary:
EUR/USD
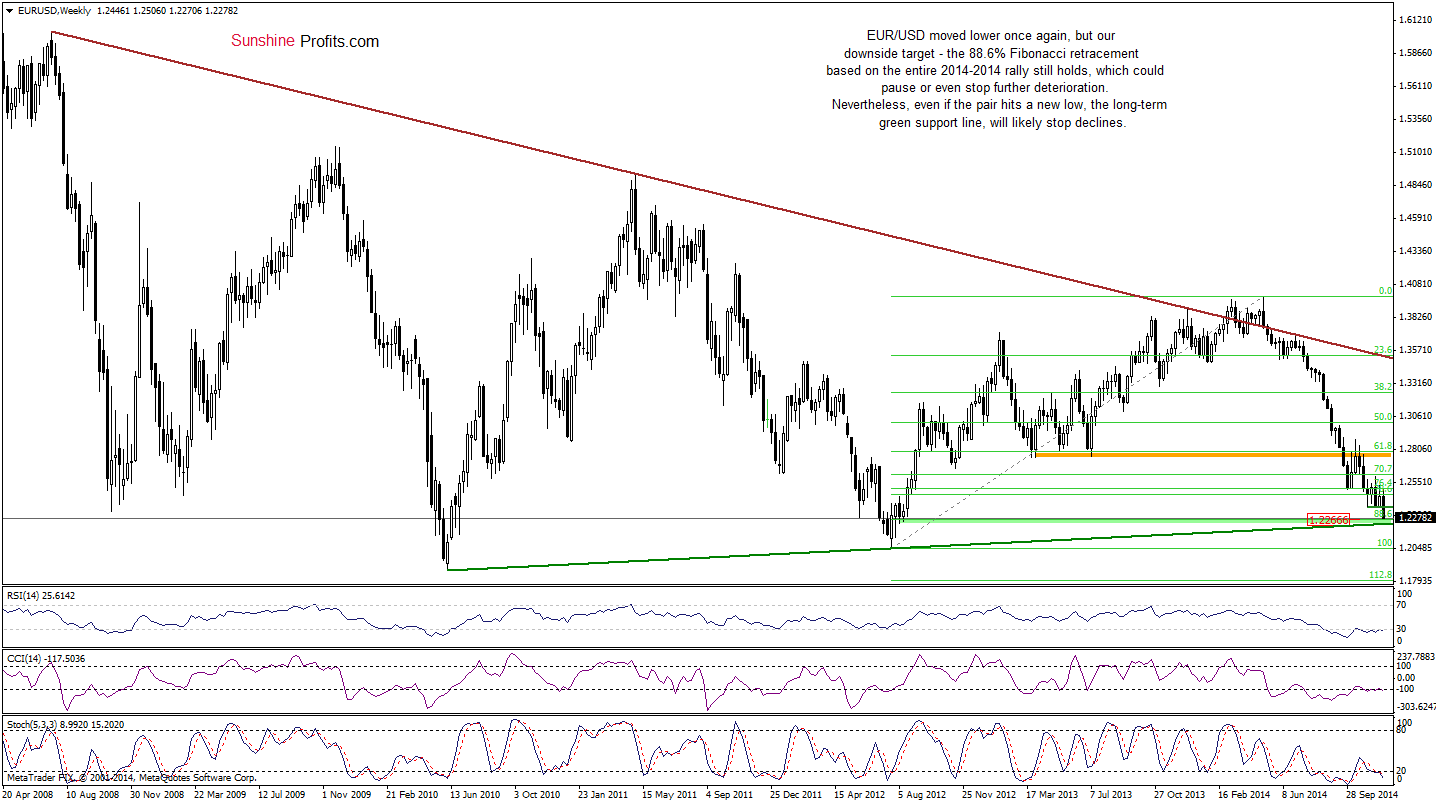
As you see on the weekly chart, although EUR/USD moved lower once again, our downside target – the 88.6% Fibonacci retracement (based on the entire 2012-2014 rally) still holds. In our opinion, even if the exchange rate extends losses, the long-term support line based on the Jun 2010 and Jul 2012 lows will be strong enough to stop further deteioration. Taking this fact into account, we think that the space for declines is limited and the exchange rate will move higher in the coming week.
Will the very short-term chart confirm this pro growth scenario?
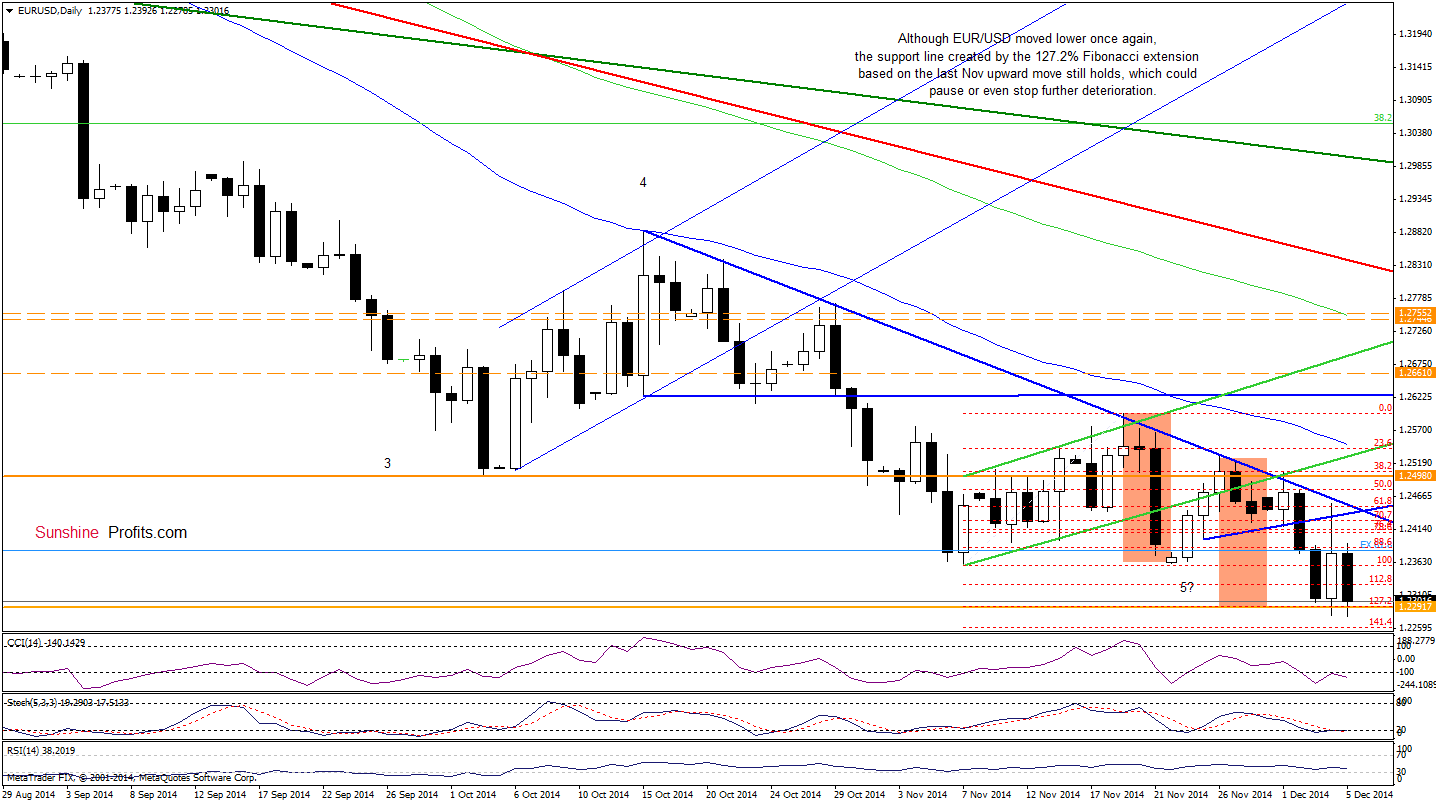
Earlier today, EUR/USD extended losses and hit a fresh multi-year low. Despite this deterioration, the breakdown below the previous low and the 127.2% Fibonacci extension was invalidated almost immediately, which is a positive signal. Additionally, as we mentioned earlier, the medoium-term support area still holds, which will likely stop further deterioration in the coming week. If this is the case, we’ll see a trend reversal and an increase to (at least) the previously-broken blue declining resistance line, which stopped upswing several times in the recent weeks.
Very short-term outlook: mixed with bullish bias
Short-term outlook: mixed with bullish bias
MT outlook: mixed
LT outlook: bearish
Trading position (short-term): In our opinion, no positions are justified from the risk/reward perspective at the moment. We will keep you informed should anything change, or should we see a confirmation/invalidation of the above.
GBP/USD
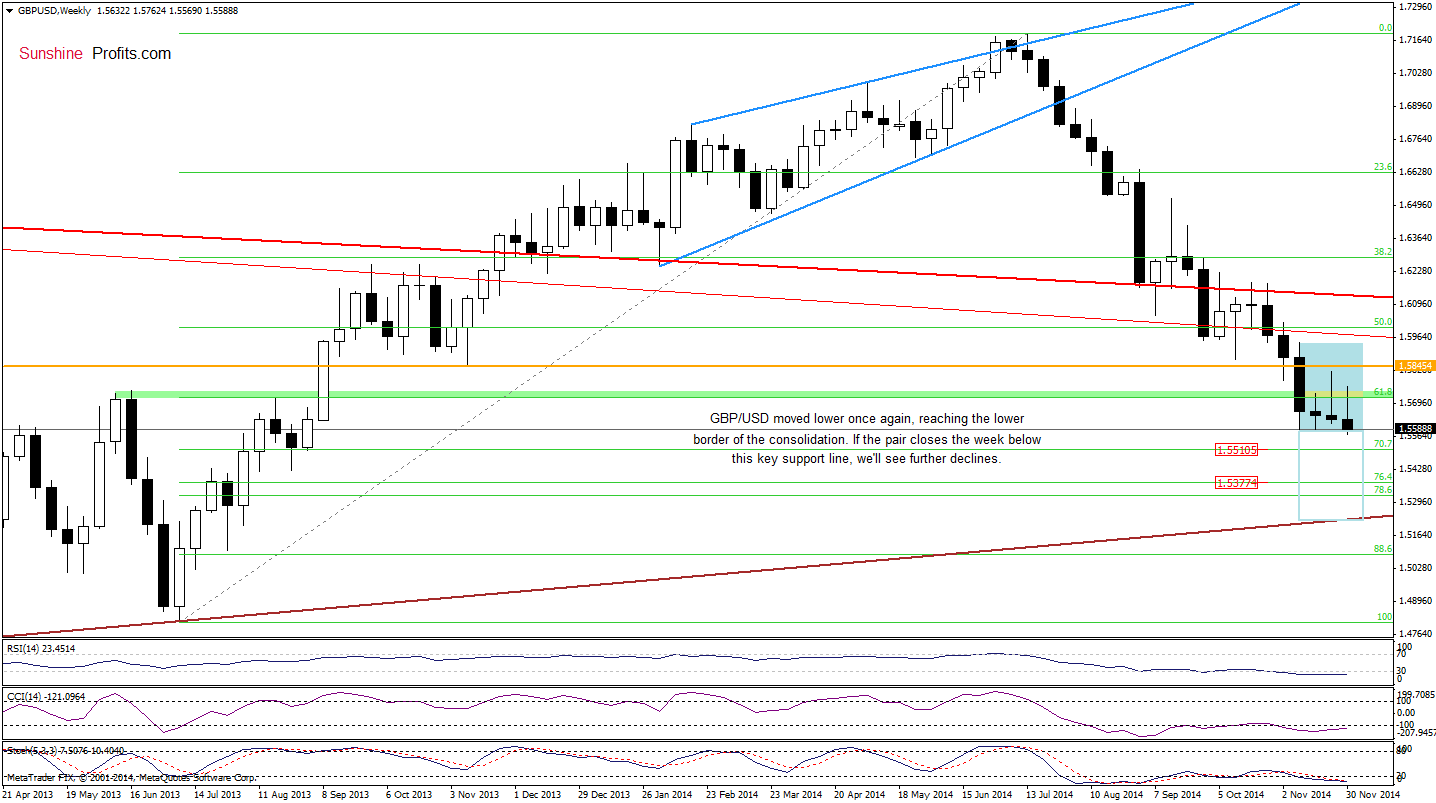
From the medium-term perspective, we see that the situation hasn’t changed much as GBP/USD is still trading in a consolidation (marked with blue) between the recent lows and the long-term red, declining resistance line. Therefore, we think that as long as there is no weekly close above/below these levels, a sizable upward/downward move is not likely to be seen.
Will the daily chart give us more clues about future moves? Let’s check.
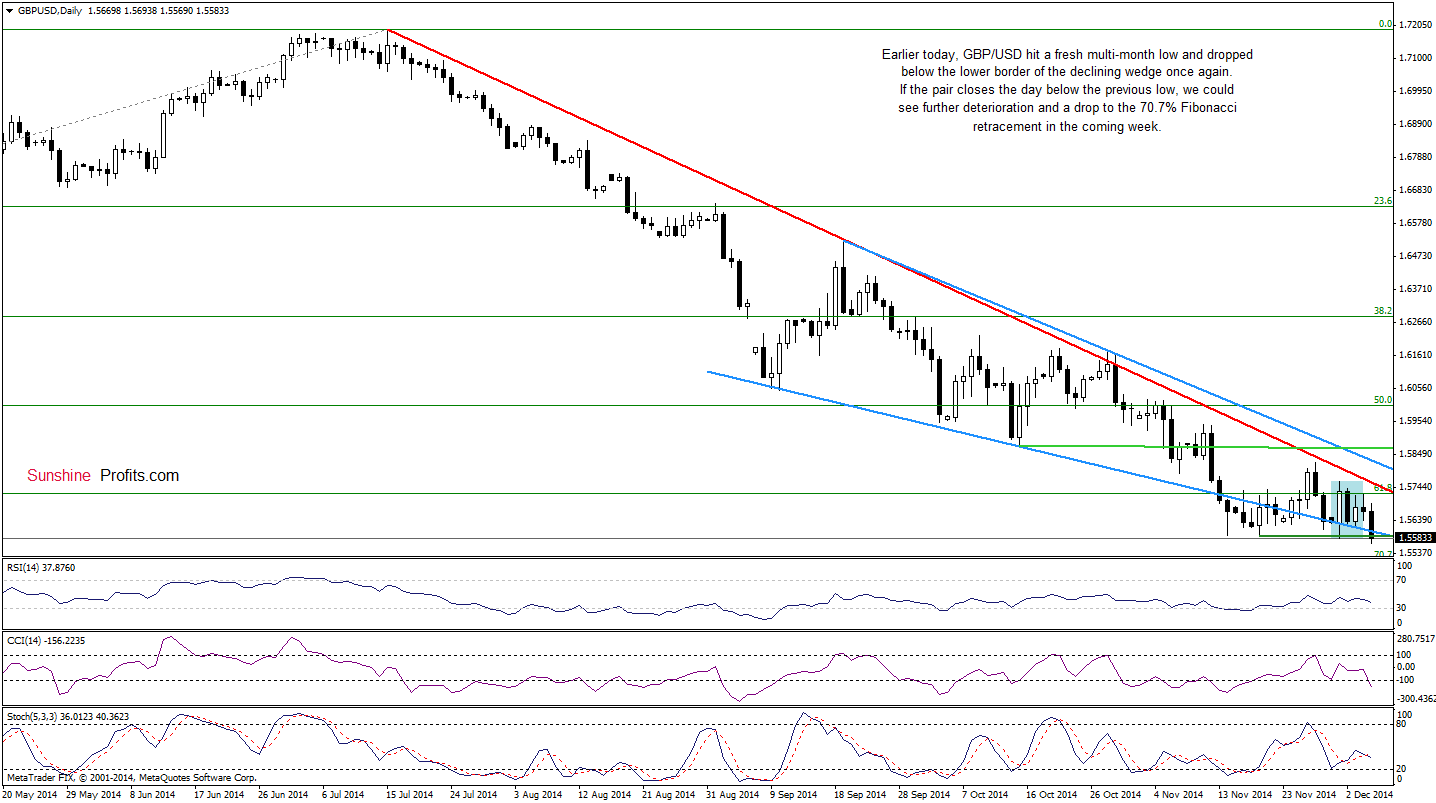
As you see on the daily chart, GBP/USD hit a fresh multi-month low earlier today and dropped below the lower border of the declining wedge once again. Although this is a bearish signal, we should keep in mind that we saw similar price action several times in Nov. Back then, all downswings were not effective, because they didn’t lead to further deterioration. Therefore, we think that another decline will be more likely if the exchange rate closes the week under the lower border of the consolidation. In this case, we’ll see a drop to the 70.7% Fibonacci retracement in the coming week. However, if the pair invalidates the breakdown later in the day, GBP/USD will likely increase to the red declining resistance once again.
Very short-term outlook: mixed
Short-term outlook: mixed
MT outlook: mixed
LT outlook: mixed
Trading position (short-term): In our opinion, no positions are justified from the risk/reward perspective at the moment. We will keep you informed should anything change, or should we see a confirmation/invalidation of the above.
USD/JPY
In our last commentary on this currency pair, we wrote the following:
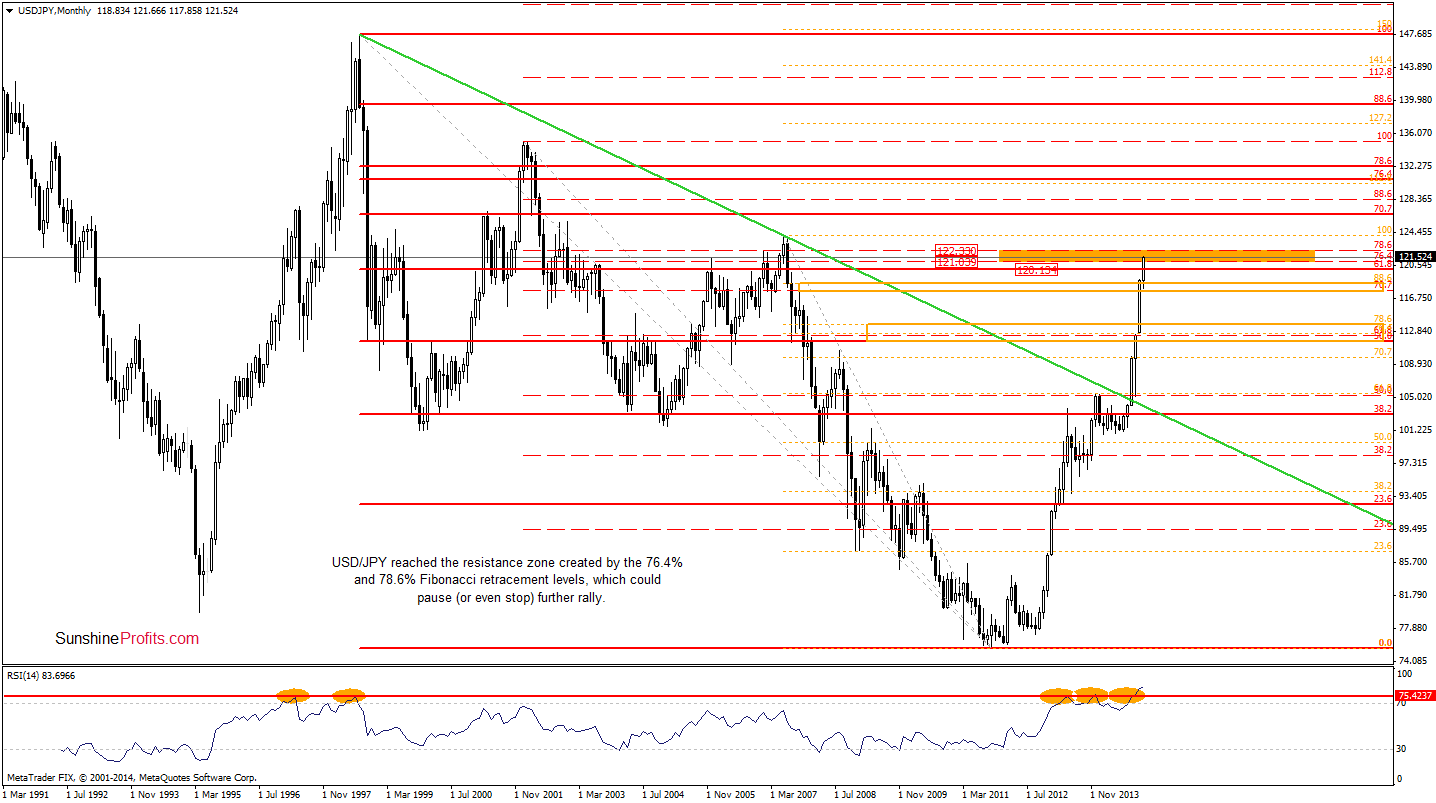
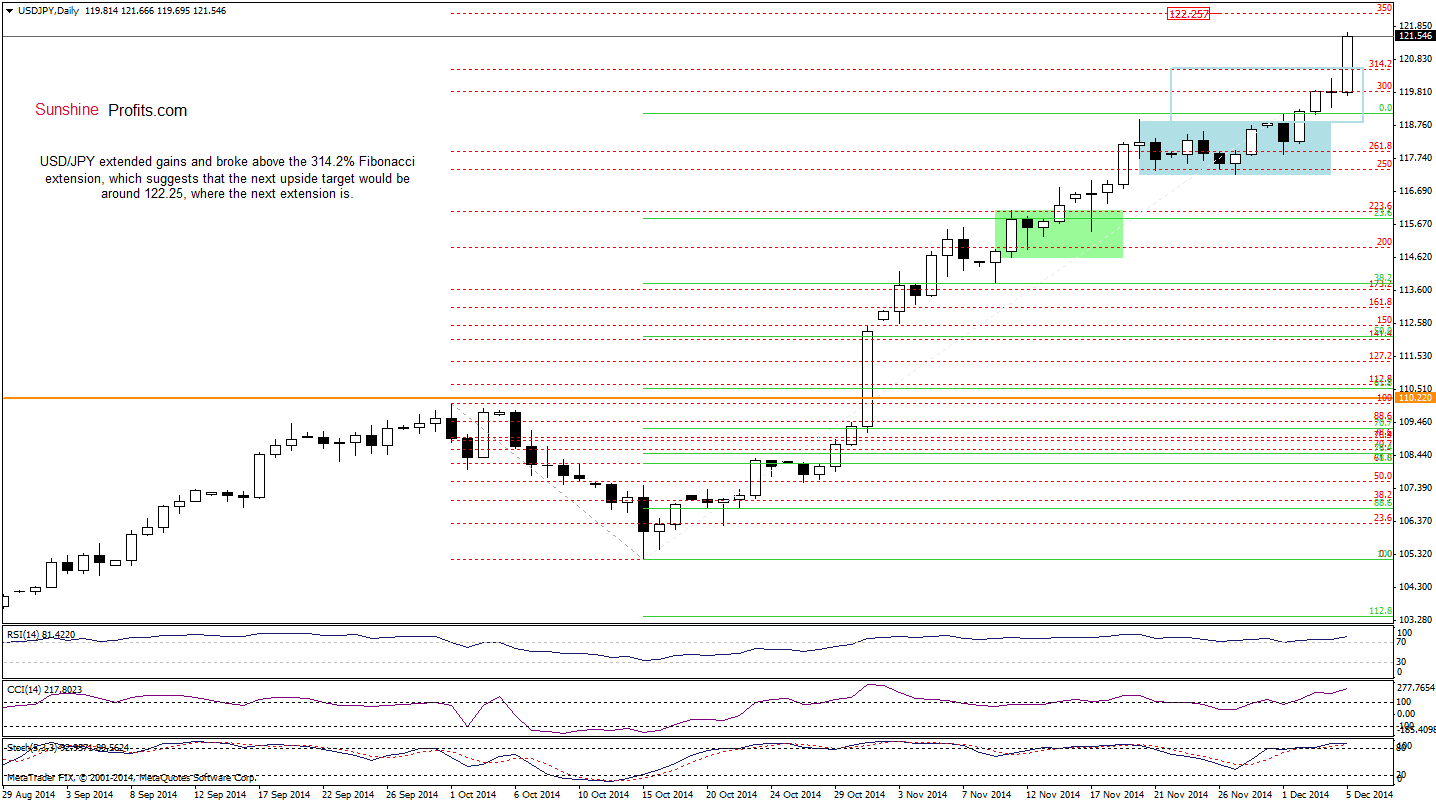
(…) a breakout above the upper line of the consolidation (marked with blue) (…) which suggests that we could see further improvement and an increase to around 120.50, where the size of the upward move will correspond to the height of the formation. At this point, it’s worth noting that in this area is the 314.2% Fibonacci extension and the 61.8% Fibonacci extension (marked on the weekly chart), which together could pause or even stop the rally. Nevertheless, as long as there are no sell signals, another attempt to move higher can’t be ruled out. If the above-mentioned resistance zone doesn’t stop currency bulls, the next target would be around 121-122.30, where the next resistance area is (marked on the weekly chart with orange).
Looking at the above charts, we see that the situation developed in tune with this pro growth scenario and USD/JPY reached our upside target earlier today. As you see the resistance zone is created by the 76.4% and 78.6% Fibonacci retracement levels, which could pause or even stop the rally. However, just like we wrote in our quote, as long as there are no sell signals, another attempt to move higher can’t be ruled out. Please note that if the pair breaks higher, we’ll see an increase to around 124.13, where the Jun 2007 high is.
Very short-term outlook: mixed with bullish bias
Short-term outlook: mixed
MT outlook: bullish
LT outlook: bullish
Trading position (short-term; our opinion): No positions are justified from the risk/reward perspective at the moment. We will keep you informed should anything change, or should we see a confirmation/invalidation of the above.
USD/CAD
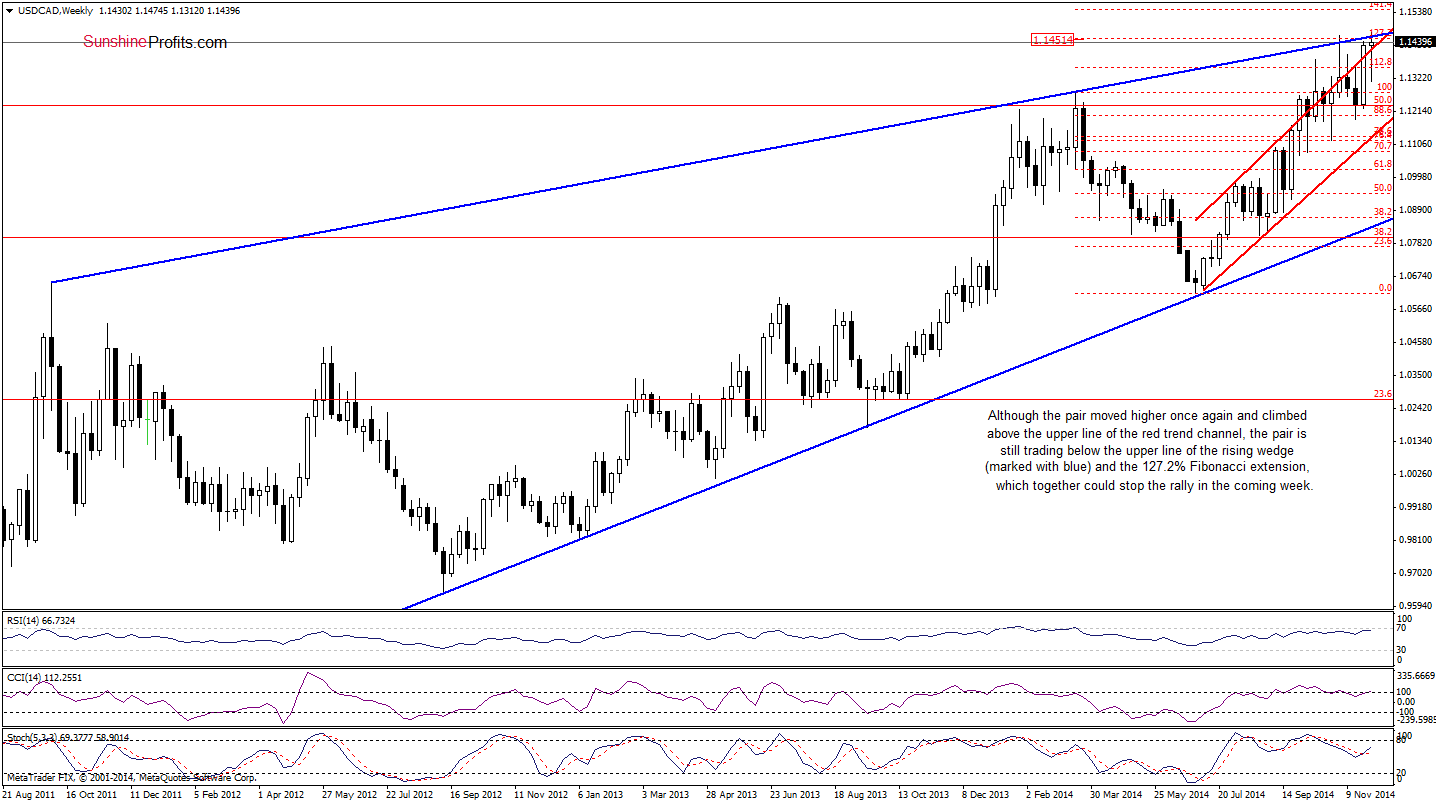
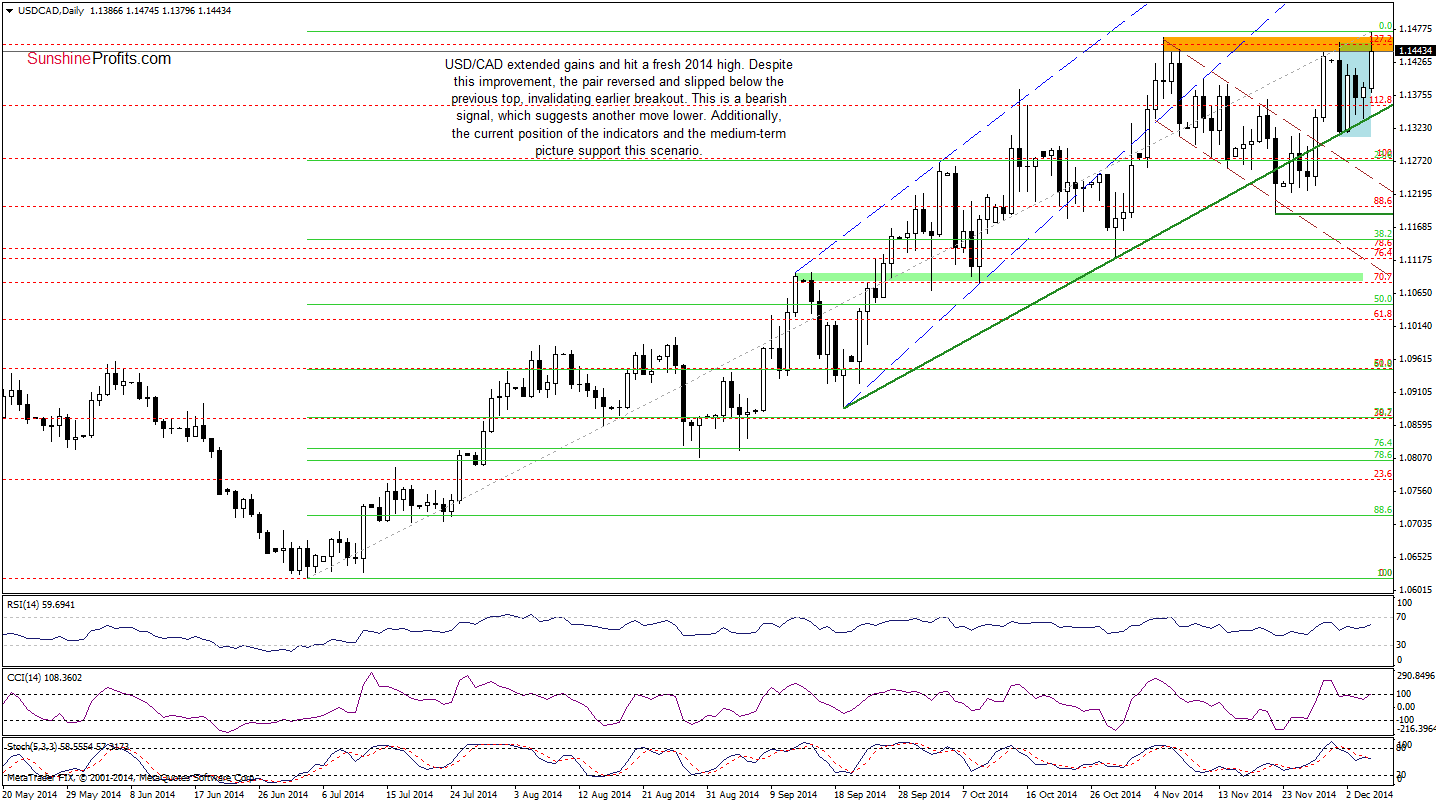
Looking at the above charts, we see that although USD/CAD extended gains and hit a fresh 2014 high, the solid resistance area seen on the weekly chart (created by the upper line of the rising wedge and the 127.2% Fibonacci extension) was strong enough to stop further improvement - similarly to what we saw at the beginning of Nov. As a result, the pair reversed and slipped below the previous high, invalidating earlier breakout, which is an additional bearish signal that suggests another move lower. In our opinion, this scenario will be even more likely if the pair drops below the short-term green support line marked on the daily chart. In this case, the initial downside target would be around 1.1271, where the 23.6% Fibonacci retracement is. If it’s broken, we’ll see a drop to the upper line of the declining trend channel (marked with brown on the daily chart) or even to the Nov low of 1.1190, where the bottom of the previous correction is.
Very short-term outlook: mixed with bearish bias
Short-term outlook: mixed with bearish bias
MT outlook: bearish
LT outlook: bearish
Trading position (short-term; our opinion): No positions are justified from the risk/reward perspective at the moment. However, we’ll consider opening short positions if we see a confirmation of the above. We will keep you informed should anything change, or should we see a confirmation/invalidation of the above.
USD/CHF
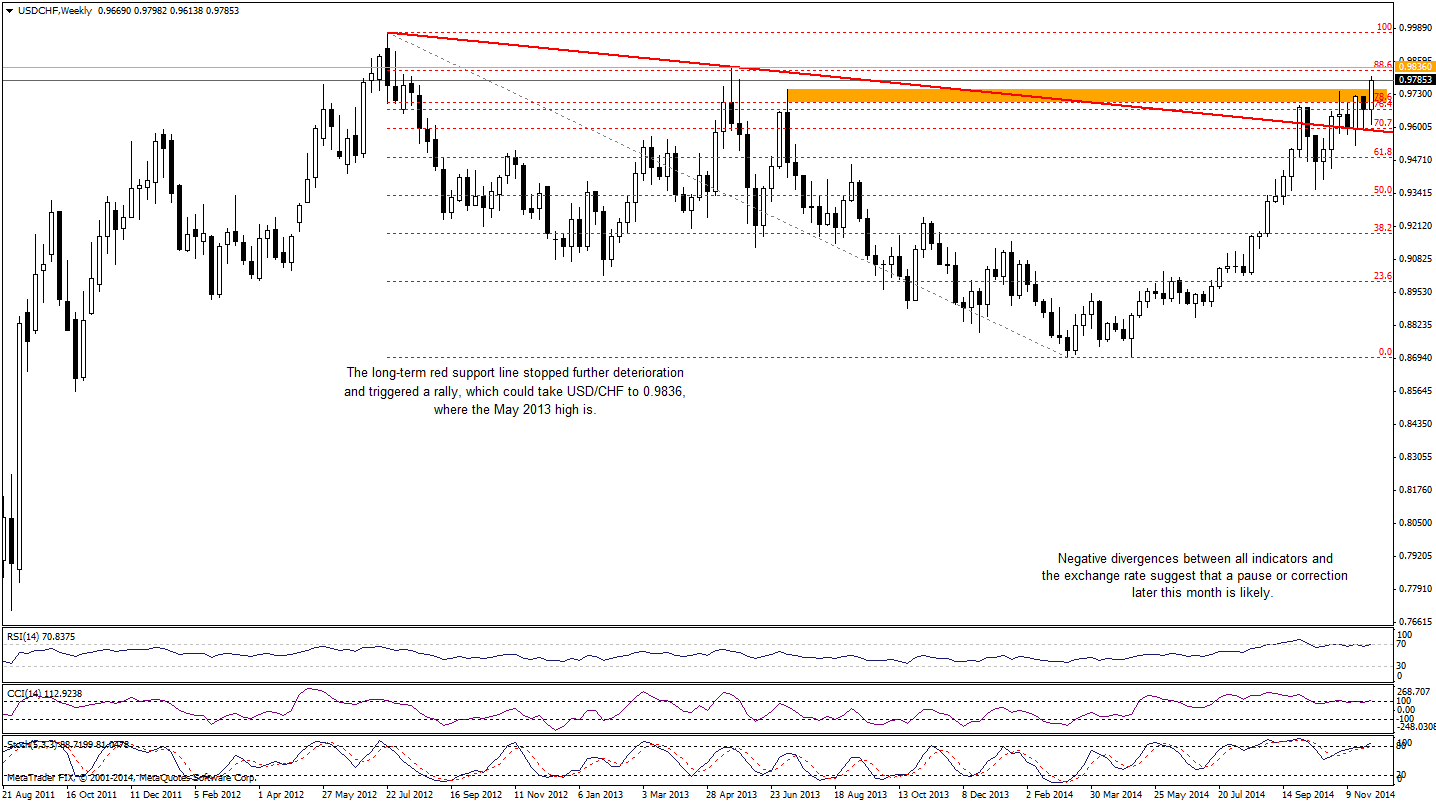
From this perspective, we see that the medium-term picture has improved as USD/CHF broke above the orange resistance zone, which suggests further improvement and an increase to around 0.9789-0.9836, where the next resistance area (created by the May 2013 high and the 88.6% Fibonacci retracement based on the entire 2012-2014 decline) is. Despite this positive picture, we should keep in mind that there are clearly visible negative divergences between all indicators and the exchange rate, which suggests that a pause or correction in the coming weeks is likely.
Will the daily chart confirm this scenario?
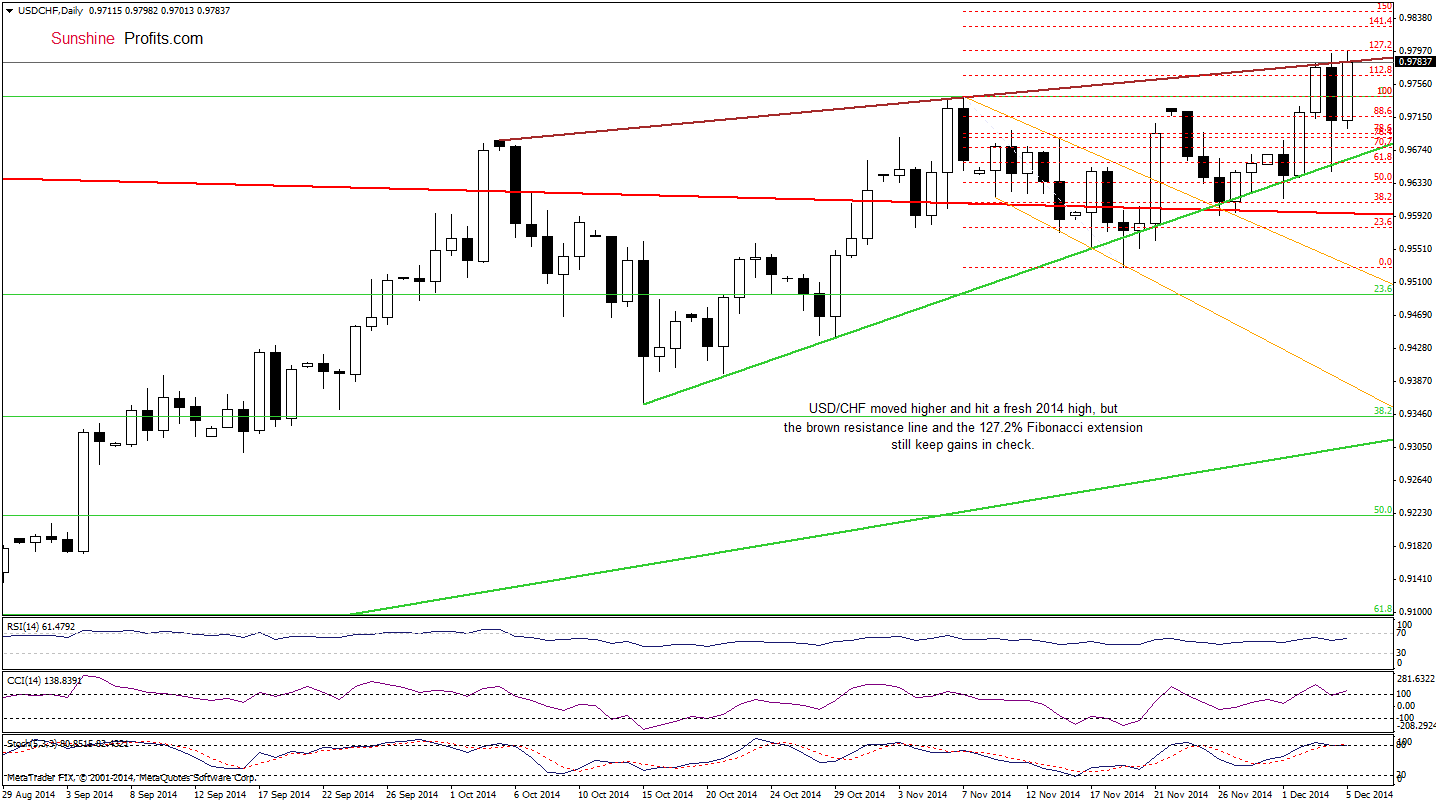
Quoting our last commentary on this currency pair:
(…) the exchange rate climbed to the 112.8% Fibonacci extension, however, taking into account the position of the indicators (although they are overbought, there are no sell signals), we think that the pair will reach the brown resistance line or even the 127.2% Fibonacci extension in the near future.
On the daily chart, we see that currency bulls pushed the pair to our upside target. Despite this improvement, the above-mentioned resistance area still keeps gains in check, which suggests that we’ll see another downswing to the green support line in the coming days- similarly to what we saw yesterday.
Very short-term outlook: mixed with bearish bias
Short-term outlook: mixed
MT outlook: mixed
LT outlook: bearish
Trading position (short-term; our opinion): No positions are justified from the risk/reward perspective at the moment. We will keep you informed should anything change, or should we see a confirmation/invalidation of the above.
AUD/USD
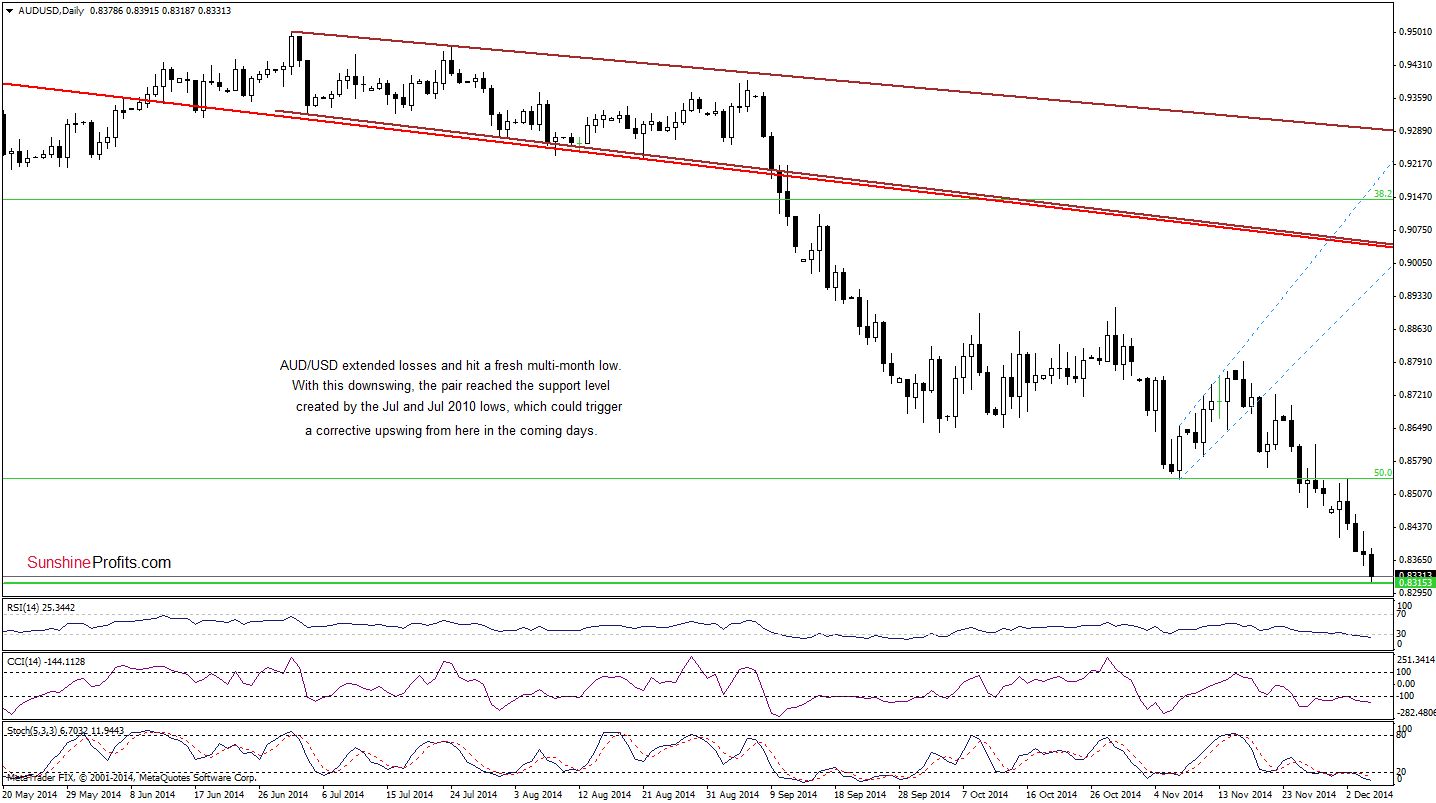
From this perspective, we see that AUD/USD extended losses and hit a fresh 2014 low earlier today. With this downswing, the pair reached the support level created by the Jun and Jul 2010 lows (marked with green on both charts), which could trigger a corrective upswing from here in the coming days.
Will we see such price action? Let’s take a closer look at the weekly chart.
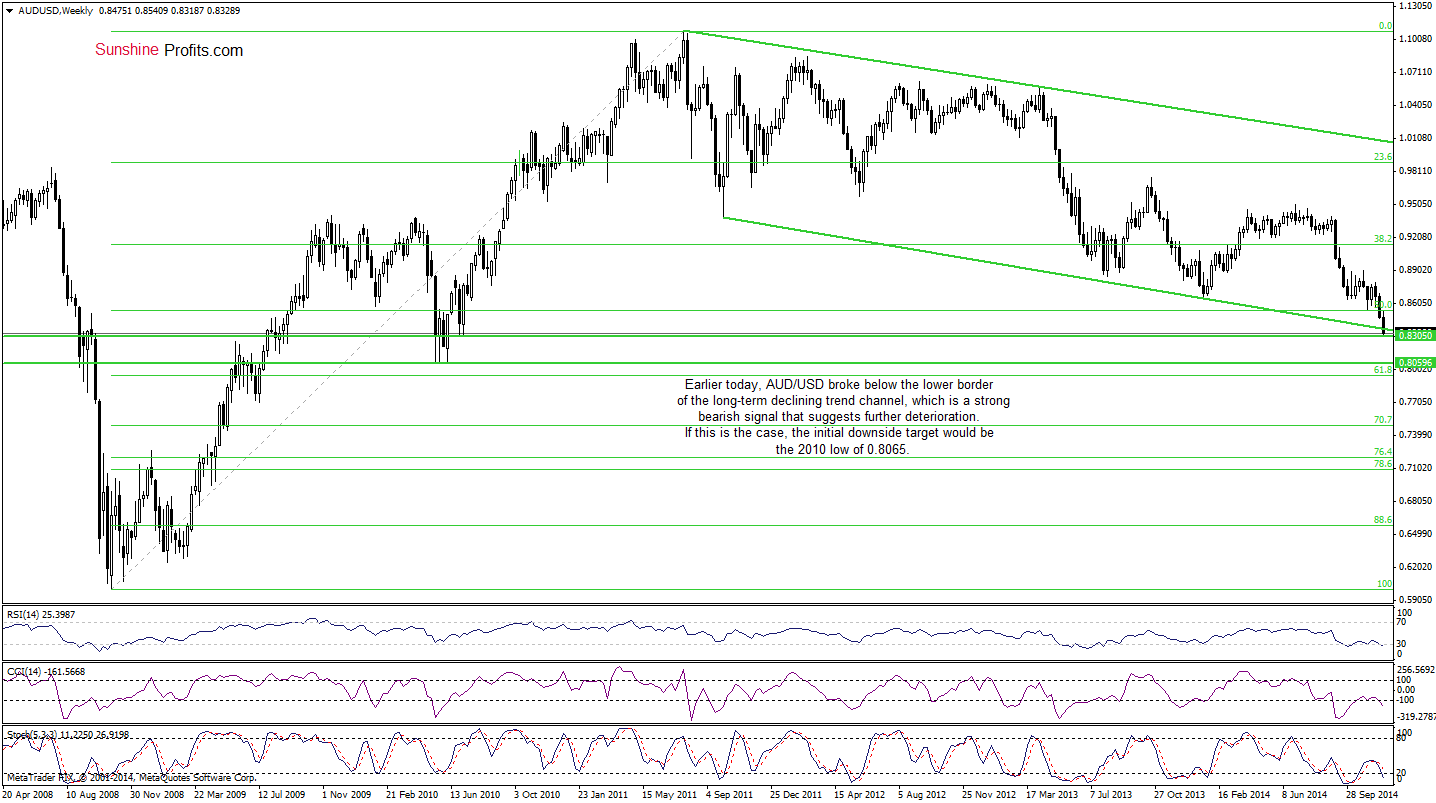
As you see on the weekly chart, although AUD/USD reached the above-mentioned support level, the most important event of today’s session is a breakdown below the lower border of the long-term declining trend channel. This is a strong bearish signal, that suggests further deterioration. Therefore, even if the pair rebounds slightly from here, it seems to us that as long as there is no invalidation of the breakdown, an upward move is not likely to be seen. Please note that if the pair closes the day under the Jun and Jul 2010 lows, the next downside target would be the 2010 low of 0.8065.
Very short-term outlook: mixed with bearish bias
Short-term outlook: mixed
MT outlook: mixed
LT outlook: mixed
Trading position (short-term): In our opinion, no positions are justified from the risk/reward perspective at the moment. We will keep you informed should anything change, or should we see a confirmation/invalidation of the above.
Thank you.
Nadia Simmons
Forex & Oil Trading Strategist
Przemyslaw Radomski, CFA
Founder, Editor-in-chief
Gold & Silver Trading Alerts
Forex Trading Alerts
Oil Investment Updates
Oil Trading Alerts

