
Earlier today, the European Central Bank kept interest rates at their current record lows of 0.05%. The Bank also left its marginal lending at 0.30% and its deposit facility rate at minus 0.20%. In these circumstances, the euro hit a fresh multi-year low, but then the exchange rate rebounded sharply after the ECB President Mario Draghi comments. Will we see further rally?
In our opinion the following forex trading positions are justified - summary:
EUR/USD
Quoting our last Forex Trading Alert:
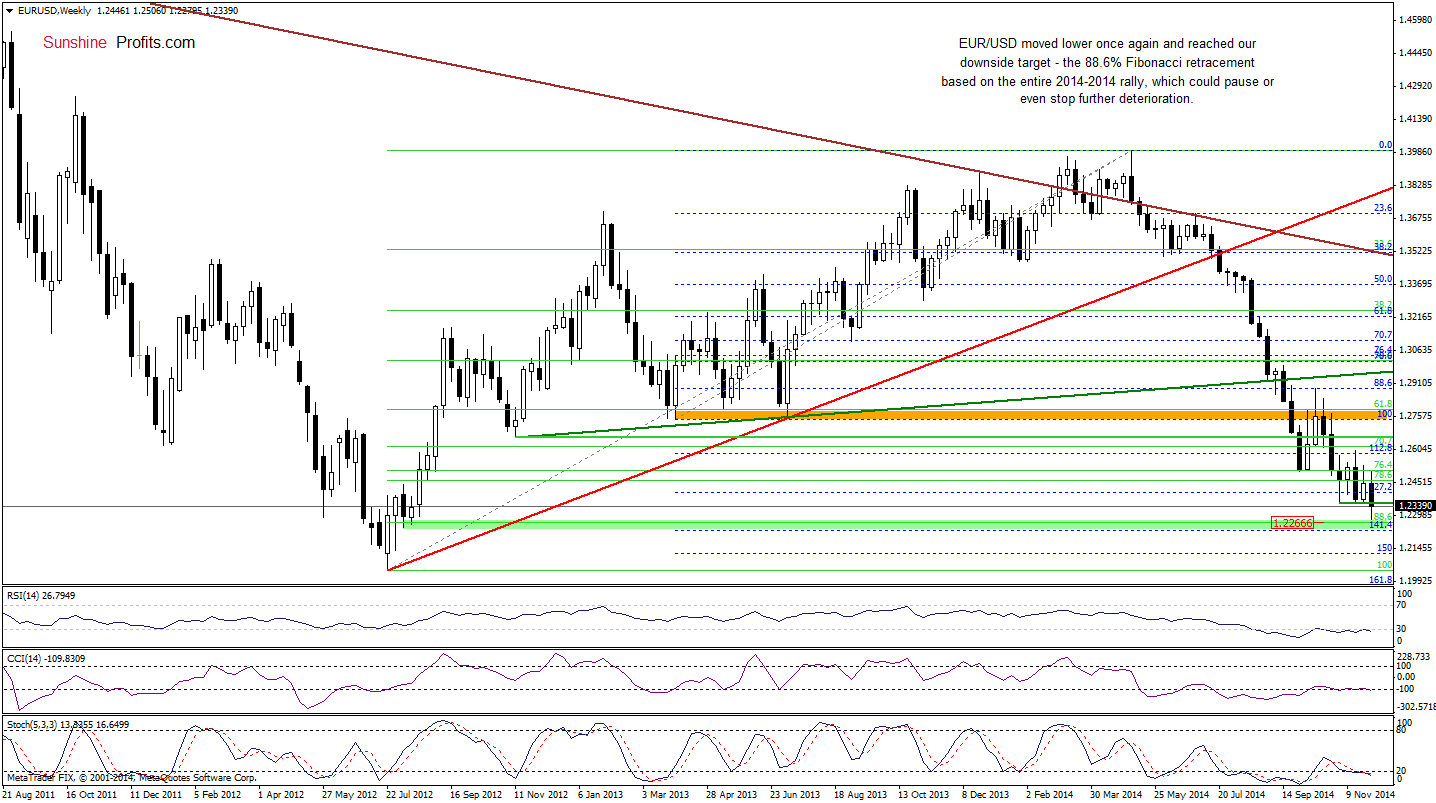
(…) EUR/USD declined below the 127.2% Fibonacci extension and the recent lows. This breakdown suggests that we could see a drop even to around 1.2266, there the 88.6% Fibonacci retracement based on the entire 2012-2014 rally is.
As you see on the weekly chart, the situation developed in line with the above-mentioned scenario and EUR/USD reached our downside target. Taking this support into account, we think that the exchange rate will move higher in the coming days.
Will the very short-term scenario confirm this assumption?
Yesterday, wrote the following:
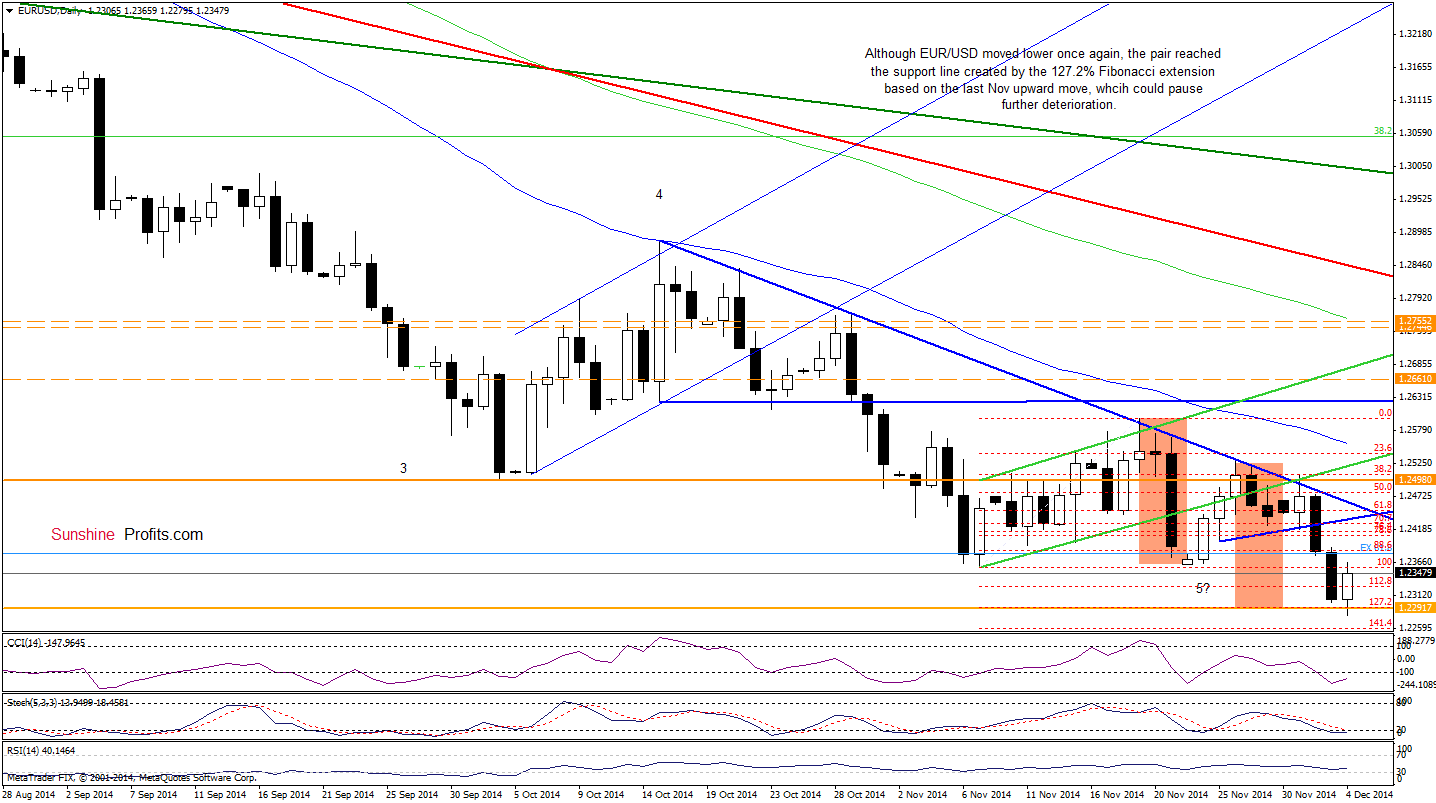
(…) Will we see further deterioration? When we take into account the current position of the indicators, we think that the answer is: yes. In our opinion, the initial downside target will be around 1.2292, where the size of the recent downward move will correspond to the downswing that we saw between Nov 19 and Nov 23 (both moves marked with orange). At this point, it’s worth noting that this area is also supported by the 127.2% Fibonacci extension based on the Nov 7- Nov 19 rally, which could pause further deterioration. However, taking into account the current position of the indicators, it seems that a drop to the above-mentioned 88.6% Fibonacci retracement (marked on the weekly chart) can’t be ruled out.
As we have pointed out before, currency bears realized the above-mentioned scenario and pushed the exchange rate to our downside target. With this move, the pair slipped to the area, where the recent downward move corresponded to the downswing that we saw between Nov 19 and Nov 23, which could reduce the selling pressure and encourage currency bulls to push the buy button. If this is the case, we’ll see a trend reversal and an increase to (at least) the previously-broken lower border of the blue triangle. If it is broken, the next target would be the declining resistance line (currently around 1.2460), which stopped upswing several times in the recent weeks.
Very short-term outlook: mixed with bullish bias
Short-term outlook: mixed with bullish bias
MT outlook: mixed
LT outlook: bearish
Trading position (short-term): In our opinion, no positions are justified from the risk/reward perspective at the moment. We will keep you informed should anything change, or should we see a confirmation/invalidation of the above.
USD/JPY
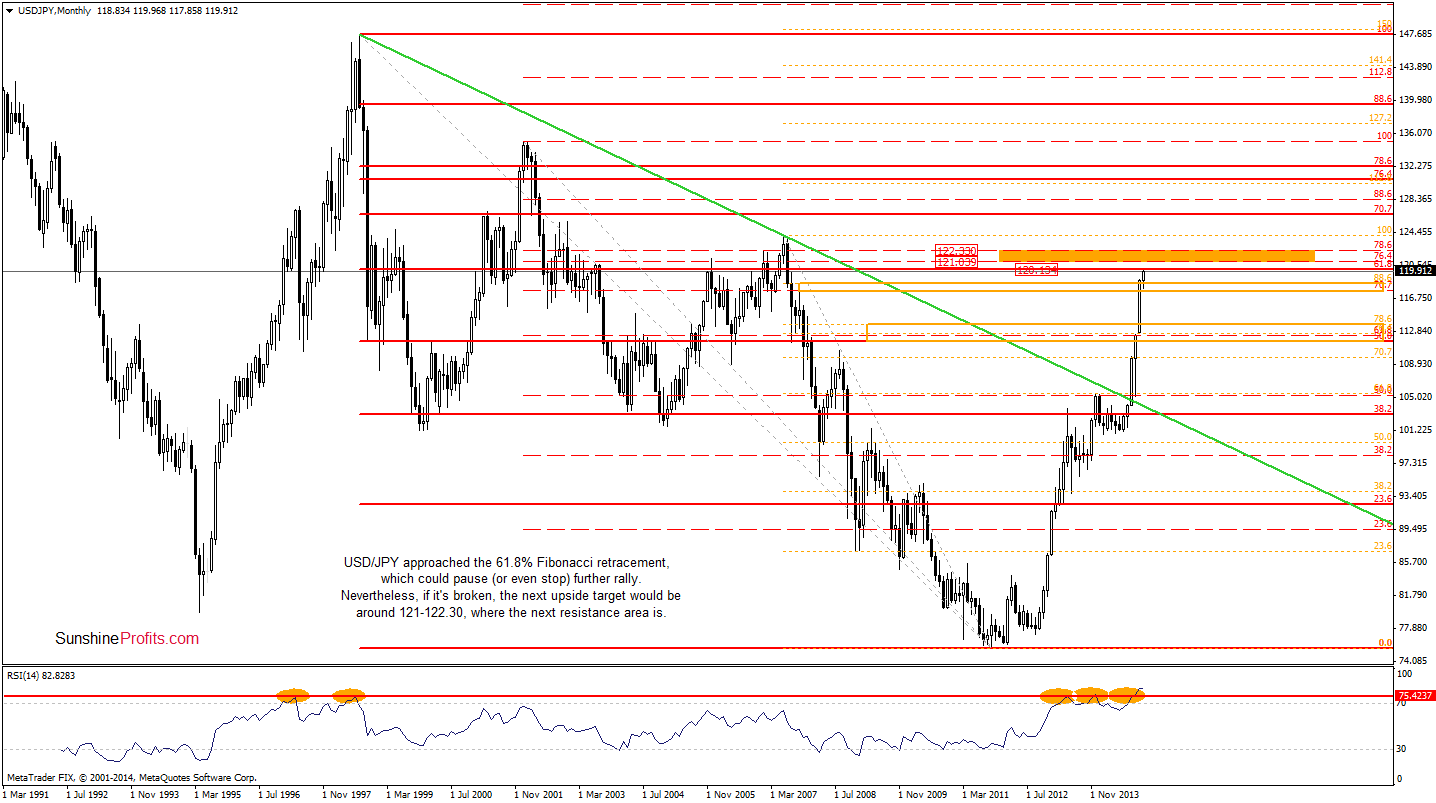
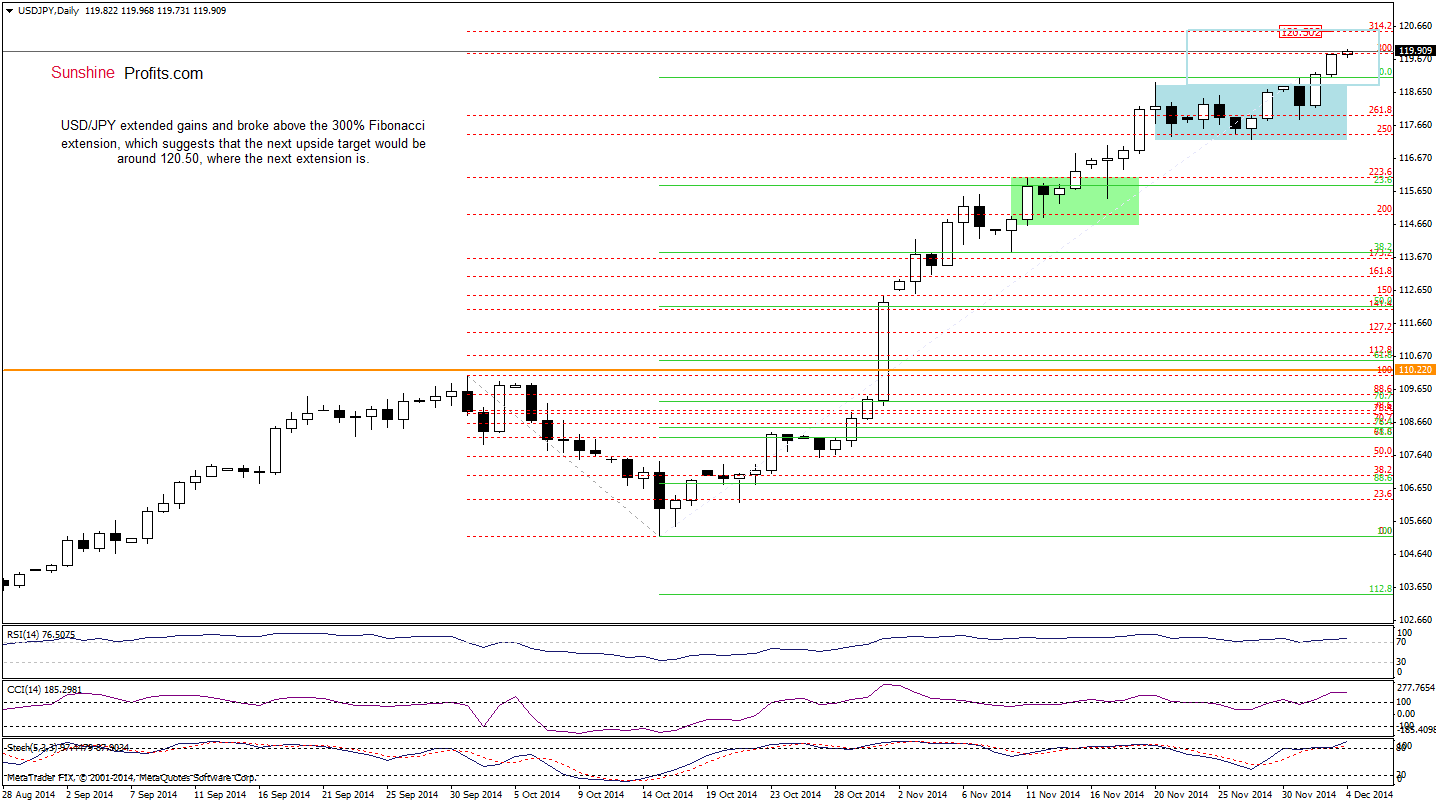
The first thing that catches the eye on the above chart is a breakout above the upper line of the consolidation (marked with blue). This is a bullish signal, which suggests that we could see further improvement and an increase to around 120.50, where the size of the upward move will correspond to the height of the formation. At this point, it’s worth noting that in this area is the 314.2% Fibonacci extension and the 61.8% Fibonacci extension (marked on the weekly chart), which together could pause or even stop the rally. Nevertheless, as long as there are no sell signals, another attempt to move higher can’t be ruled out. If the above-mentioned resistance zone doesn’t stop currency bulls, the next target would be around 121-122.30, where the next resistance area is (marked on the weekly chart with orange).
Very short-term outlook: mixed with bullish bias
Short-term outlook: mixed
MT outlook: bullish
LT outlook: bullish
Trading position (short-term; our opinion): No positions are justified from the risk/reward perspective at the moment. We will keep you informed should anything change, or should we see a confirmation/invalidation of the above.
USD/CAD
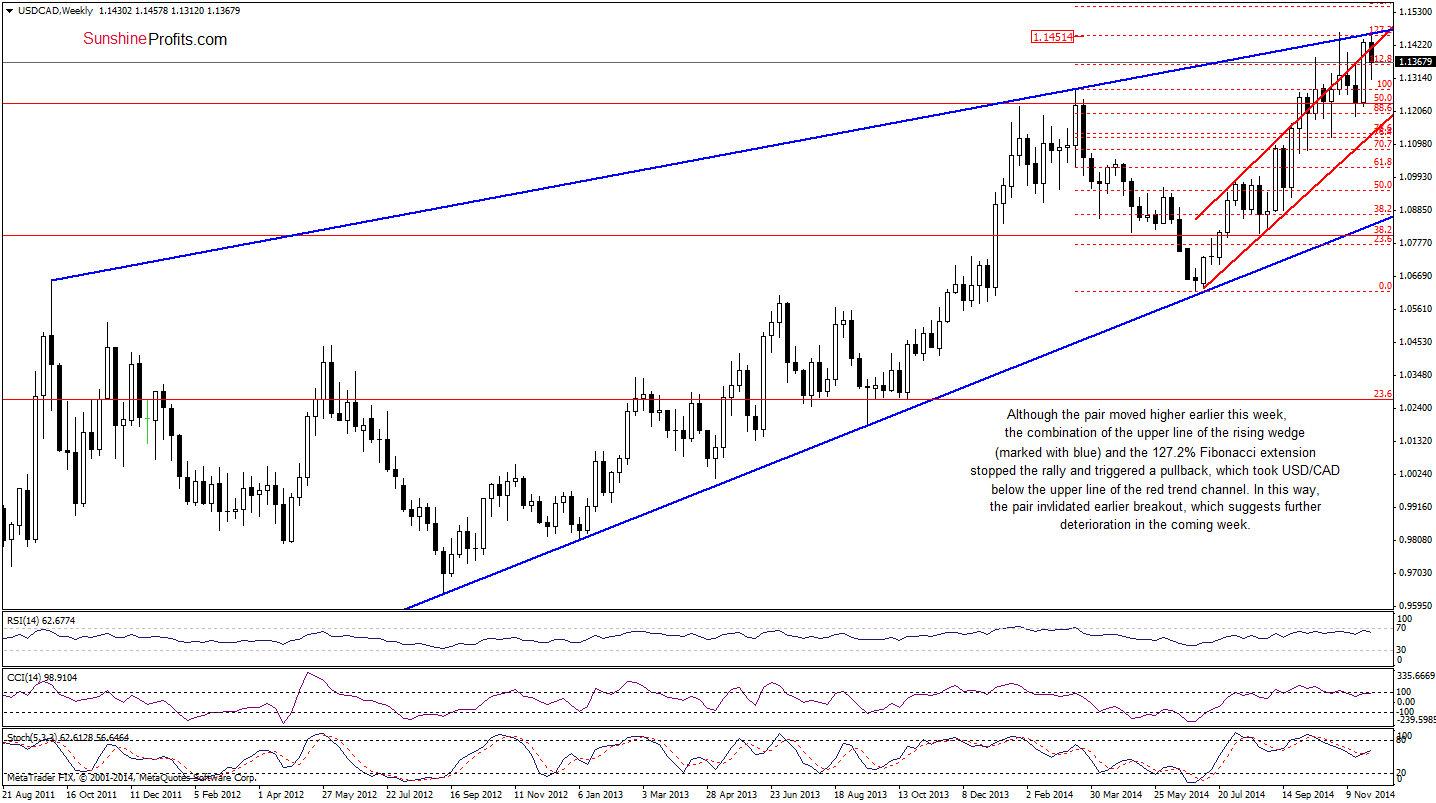
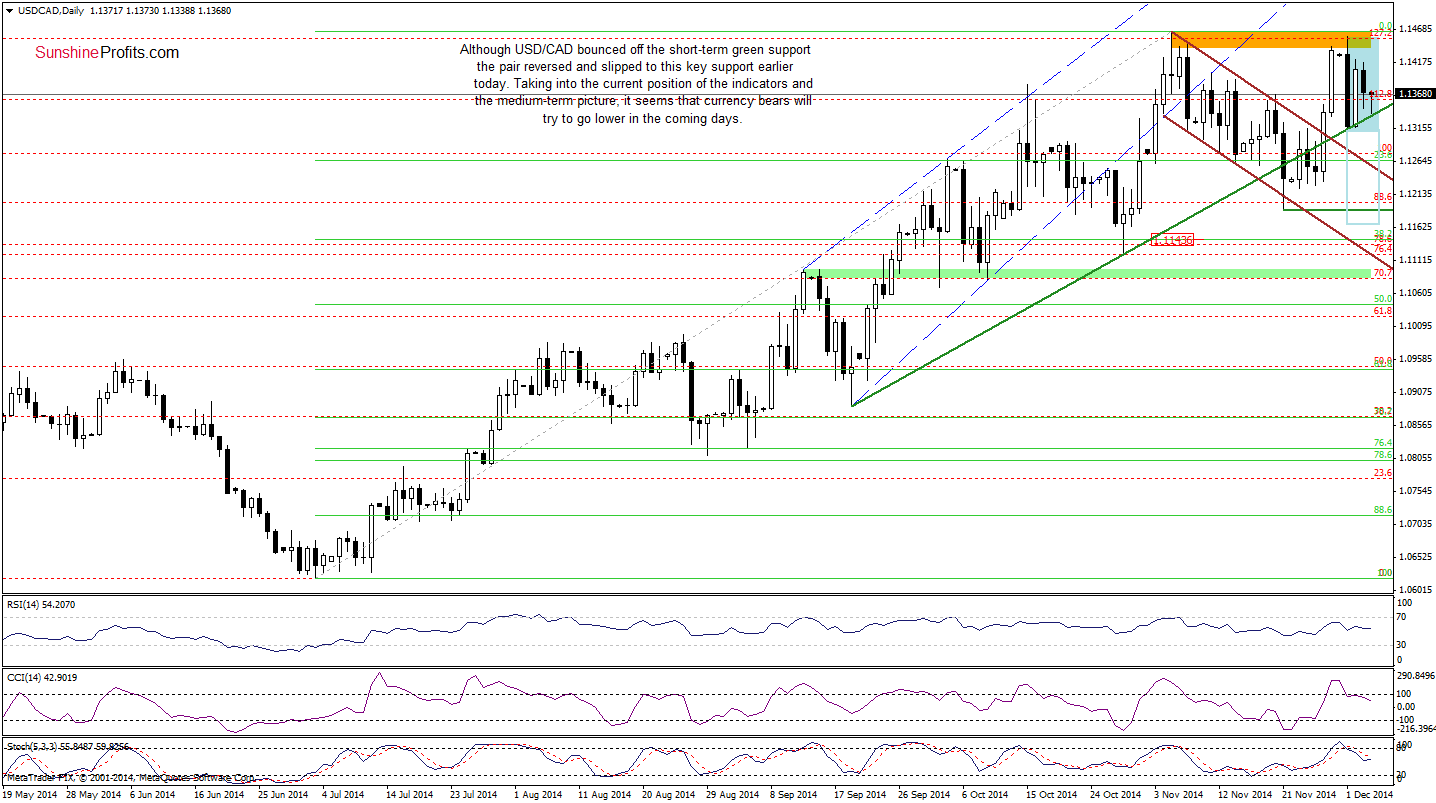
Looking at the above charts, we see that although USD/CAD bounced off the green support line earlier this week, the pair reversed and slipped to this key support line once again. Even if it holds and we see another upswing in the coming days, we think that the solid resistance area seen on the weekly chart (created by the upper line of the rising wedge and the 127.2% Fibonacci extension) will be strong enough to stop further improvement – similarly to what we saw on Monday. Therefore, what we wrote in our last commentary on this currency pair is still up-to-date:
(…) As you see on the weekly chart, (…) the exchange rate invalidated earlier breakout above the upper line of the red rising trend channel – similarly to what we saw at the beginning of Nov. Back then, such price action triggered a correction, which suggests that we could see further deterioration in the coming week. In our opinion, this scenario will be even more likely if the pair drops below the above-mentioned short-term green support line. In this case, the initial downside target would be around 1.1265, where the 23.6% Fibonacci retracement and the previously-broken upper line of the declining trend channel (marked with brown on the daily chart) are. Nevertheless, taking into account the current position of the indicators (the CCI and Stochastic Oscillator generated sell signals), it seems that currency bears will try to go lower in the coming days. If this is the case, the next target would be the bottom of the previous correction (the Nov 21 low of 1.1190).
(…) we would like to draw your attention to the link between the Canadian dollar and crude oil. In the previous week, the Canadian currency moved sharply lower against the greenback weakened mainly by falling oil prices. Meanwhile, yesterday’s rebound in the commodity had a positive impact on the Canadian dollar and strengthened it against its U.S. counterpart. What does it mean for USD/CAD? Taking into account the current picture of crude oil (you can read more about it in our Oil Trading Alerts), we think that the loonie will increase, which will translate to the lower values of USD/CAD in the coming days.
Very short-term outlook: mixed with bearish bias
Short-term outlook: mixed with bearish bias
MT outlook: bearish
LT outlook: bearish
Trading position (short-term; our opinion): No positions are justified from the risk/reward perspective at the moment. However, we’ll consider opening short positions if we see a confirmation of the above. We will keep you informed should anything change, or should we see a confirmation/invalidation of the above.
Thank you.
Nadia Simmons
Forex & Oil Trading Strategist
Przemyslaw Radomski, CFA
Founder, Editor-in-chief
Gold & Silver Trading Alerts
Forex Trading Alerts
Oil Investment Updates
Oil Trading Alerts

