
On Friday, the Nationwide Building Society reported that U.K. house price inflation rose 0.3% in November, missing analysts’ expectations for a 0.4% increase. As a result, the British pound moved lower against the greenback and GBP/USD slipped to its key support line. Where the exchange rate head next?
In our opinion, the following forex trading positions are justified - summary:
EUR/USD
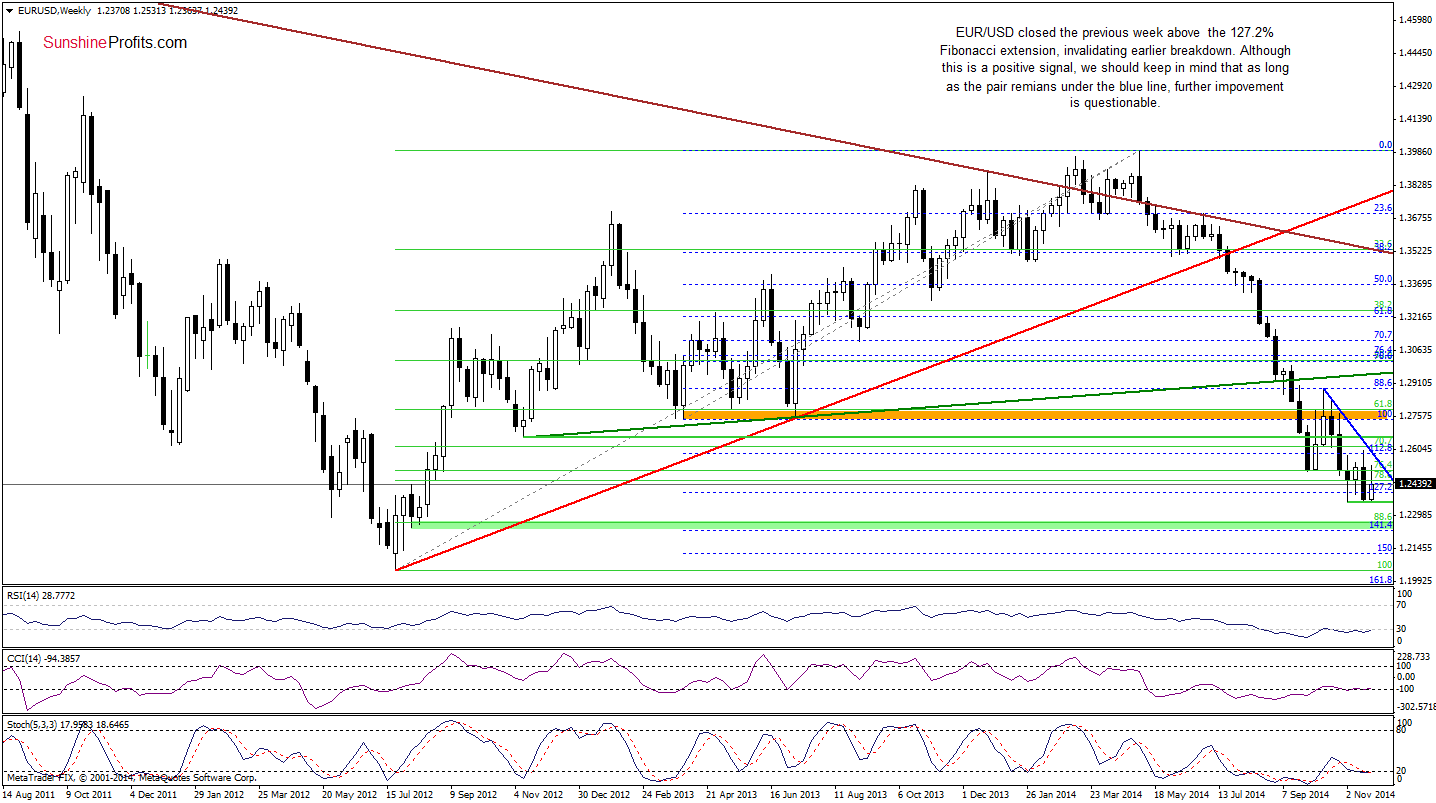
The medium-term picture has improved slightly as EUR/USD bounced off the Nov and last week’s lows. Although the pair gave up some gains, the exchange rate closed the previous week above the 127.2% Fibonacci extension, invalidating earlier breakdown below this support. This is a bullish signal, however, we think that as long as the pair is trading below the resistance line based on the recent highs, further improvement is questionable.
Can we infer something more from the very short-term picture? Let’s check.
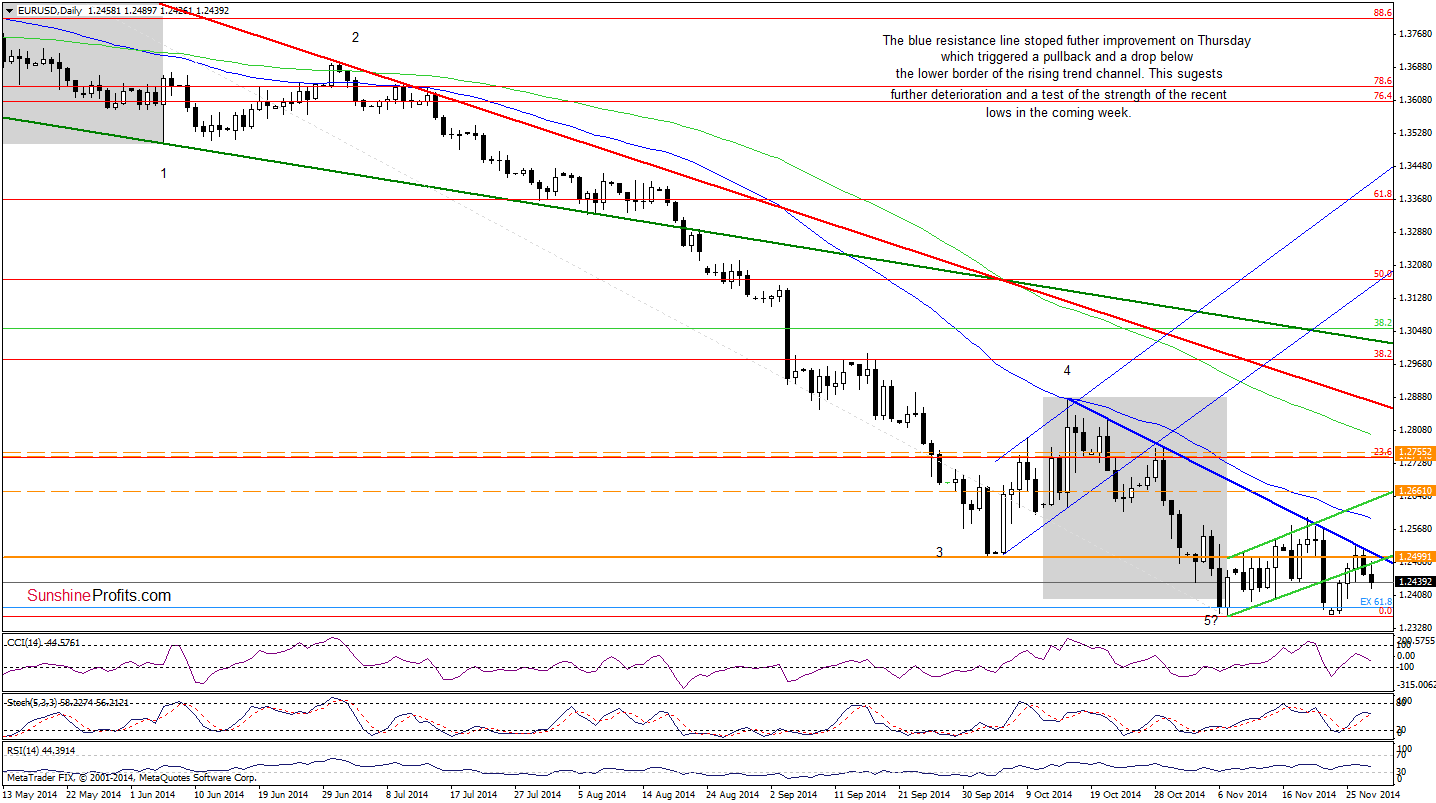
From this perspective, we see that the blue declining resistance line was strong enough to trigger another pullback in the recent days - similarly to what we saw earlier this month and also in Oct. With this move, EUR/USD slipped below the lower border of the rising trend channel once again, which suggests further deterioration and a test of the strength of Tuesday’s low of 1.2399 or even the recent lows in the coming week. When we could see a sizable rally? In our opinion, such price action will be likely only if the exchange rate breaks above this key resistance line. Until this time, short-lived moves in both directions should not surprise us.
Very short-term outlook: mixed with bearish bias
Short-term outlook: mixed
MT outlook: mixed
LT outlook: bearish
Trading position (short-term): In our opinion, no positions are justified from the risk/reward perspective at the moment. We will keep you informed should anything change, or should we see a confirmation/invalidation of the above.
GBP/USD
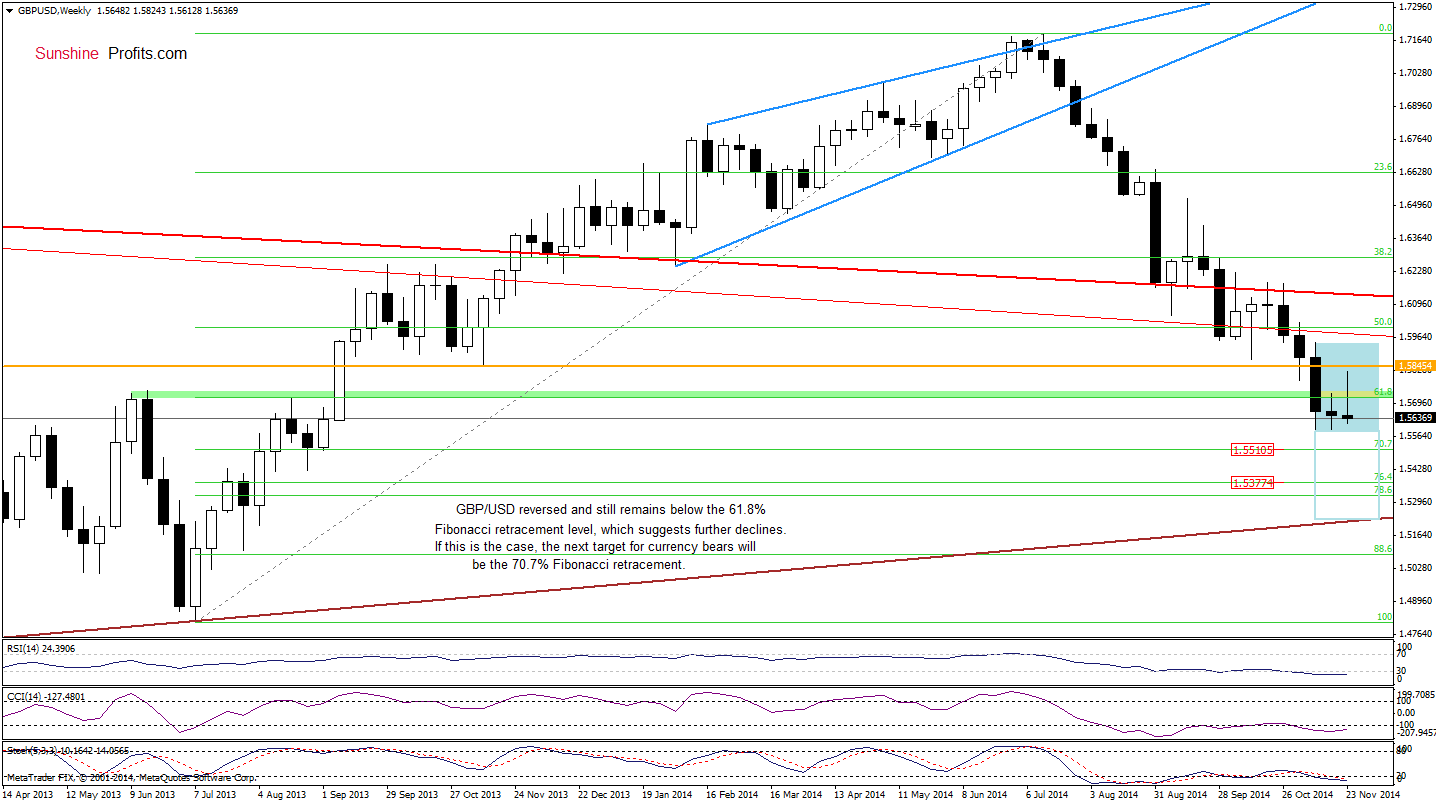
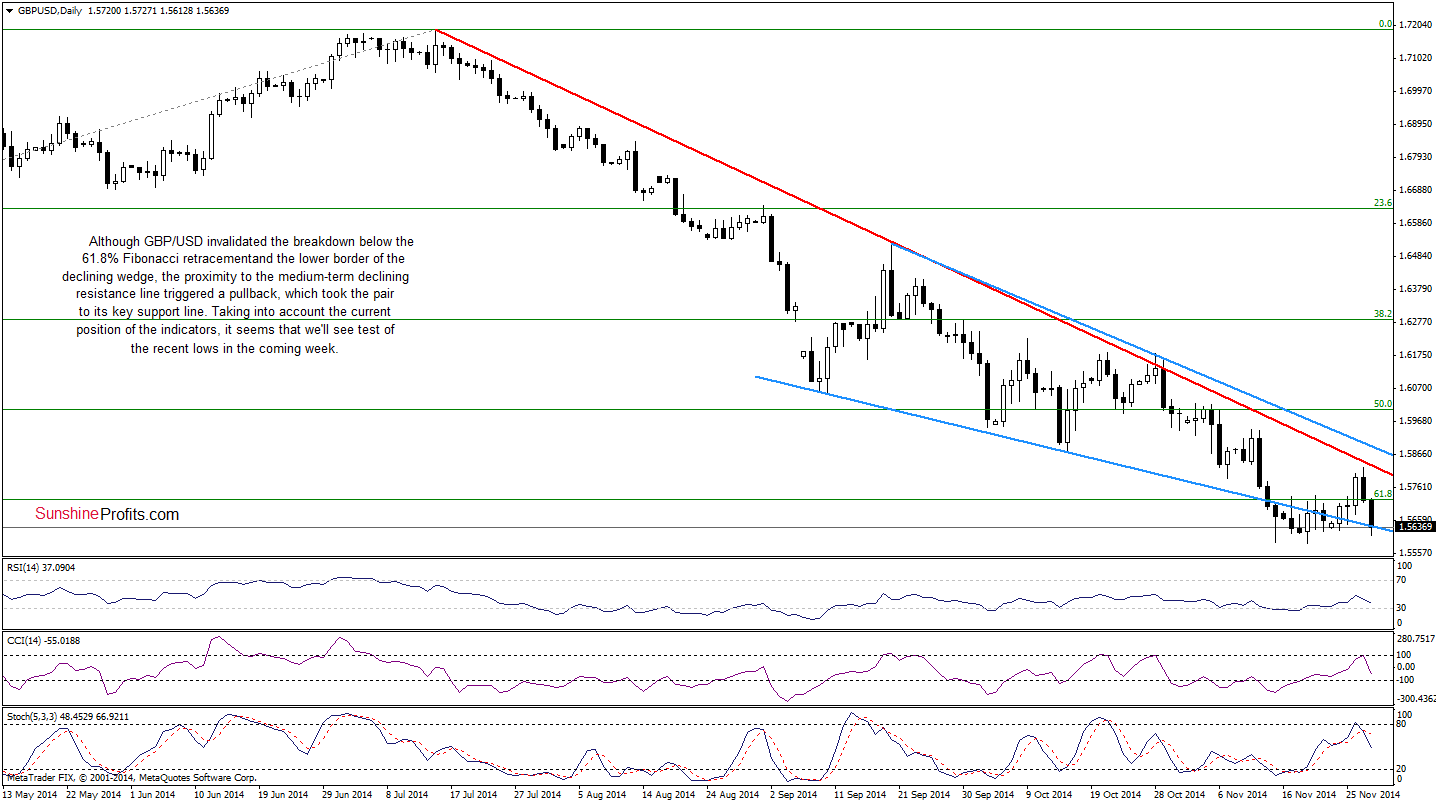
GBP/USD rebounded in the first half of the previous week, invalidating the breakdown below the 61.8% Fibonacci retracement and the lower border of the declining wedge. Despite this strong bullish signal, the proximity to the medium-term declining red line and the resistance level created by the Nov 2013 (marked on the weekly chart) was enough to trigger a pullback, which took the pair back to its key support line. What’s next? Taking into the current position of the indicators (the CCI and Stochastic Oscillator generated sell signals), we think that currency bears will attack once again and we’ll see (at least) a test of the recent lows in the coming week. What could happen if this support area is broken? When we take a closer look at the weekly chart, we see that the exchange rate is trading in a consolidation marked with blue. Therefore, a breakdown below the lower line of the formation could trigger a drop even to 1.5232, where the size of the downward move will correspond to the height of the consolidation (this area is also supported by the long-term brown rising line based on the Jan 2009 and Jul 2013 lows). Nevertheless, we should keep in mind that before currency bulls will realize this scenario they will have to break below 1.5510, where the nearest medium-term support (the 70.7% Fibonacci retracement) is.
Very short-term outlook: bearish
Short-term outlook: bearish
MT outlook: mixed
LT outlook: mixed
Trading position (short-term): In our opinion, no positions are justified from the risk/reward perspective at the moment. We will keep you informed should anything change, or should we see a confirmation/invalidation of the above.
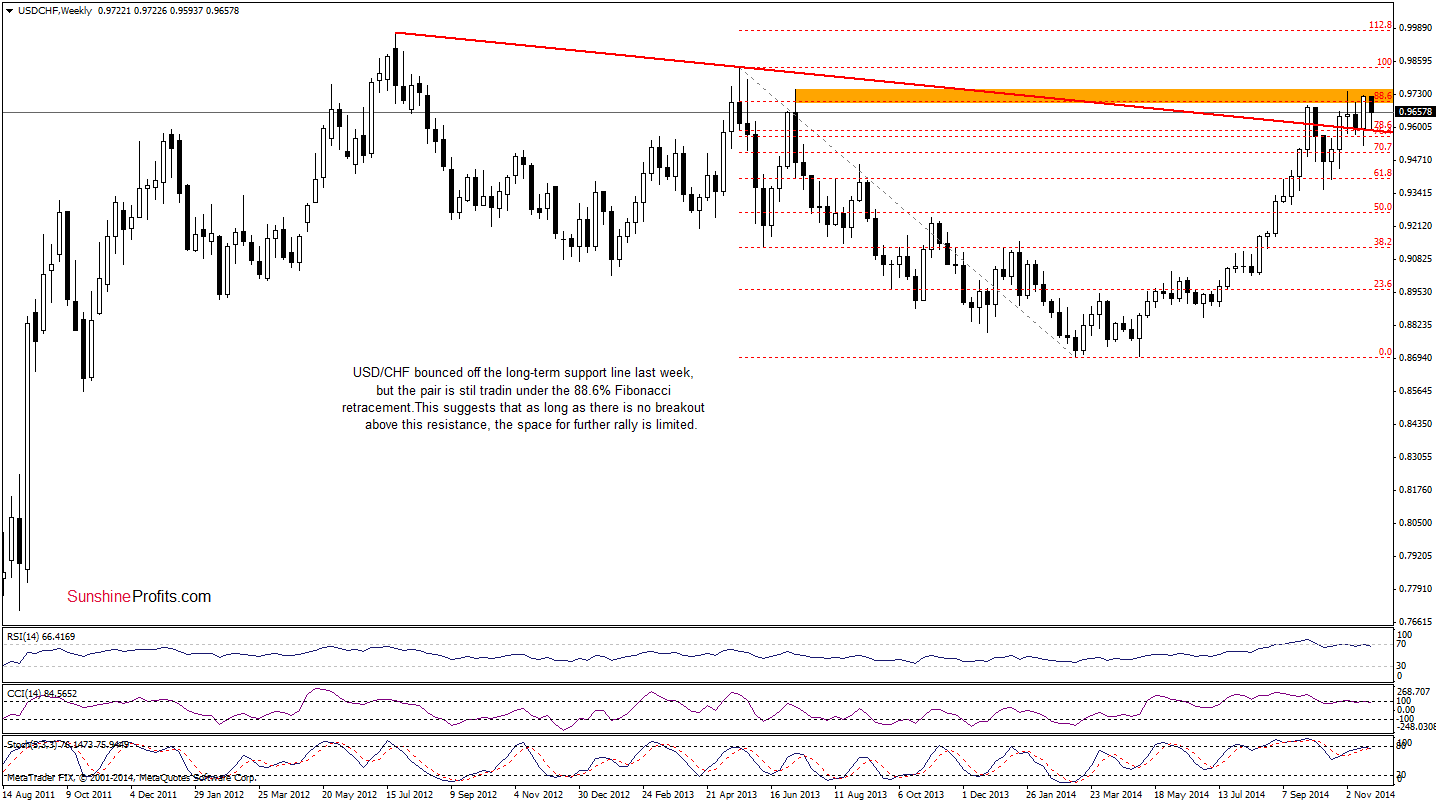
USD/CHF
Quoting our Forex Trading Alert posted on Tuesday:
(…) USD/CHF still remains above the strong support zone created by the previously-broken upper line of the declining trend channel, the long-term red line and the green support line, which successfully stopped further deterioration last week. In our opinion, as long as this area is in play, another attempt to move higher is likely. Nevertheless, taking into account the current position of the indicators (the CCI and Stochastic Oscillator generated sell signals), it seems that currency bears will test the strength of this major support in the coming days.
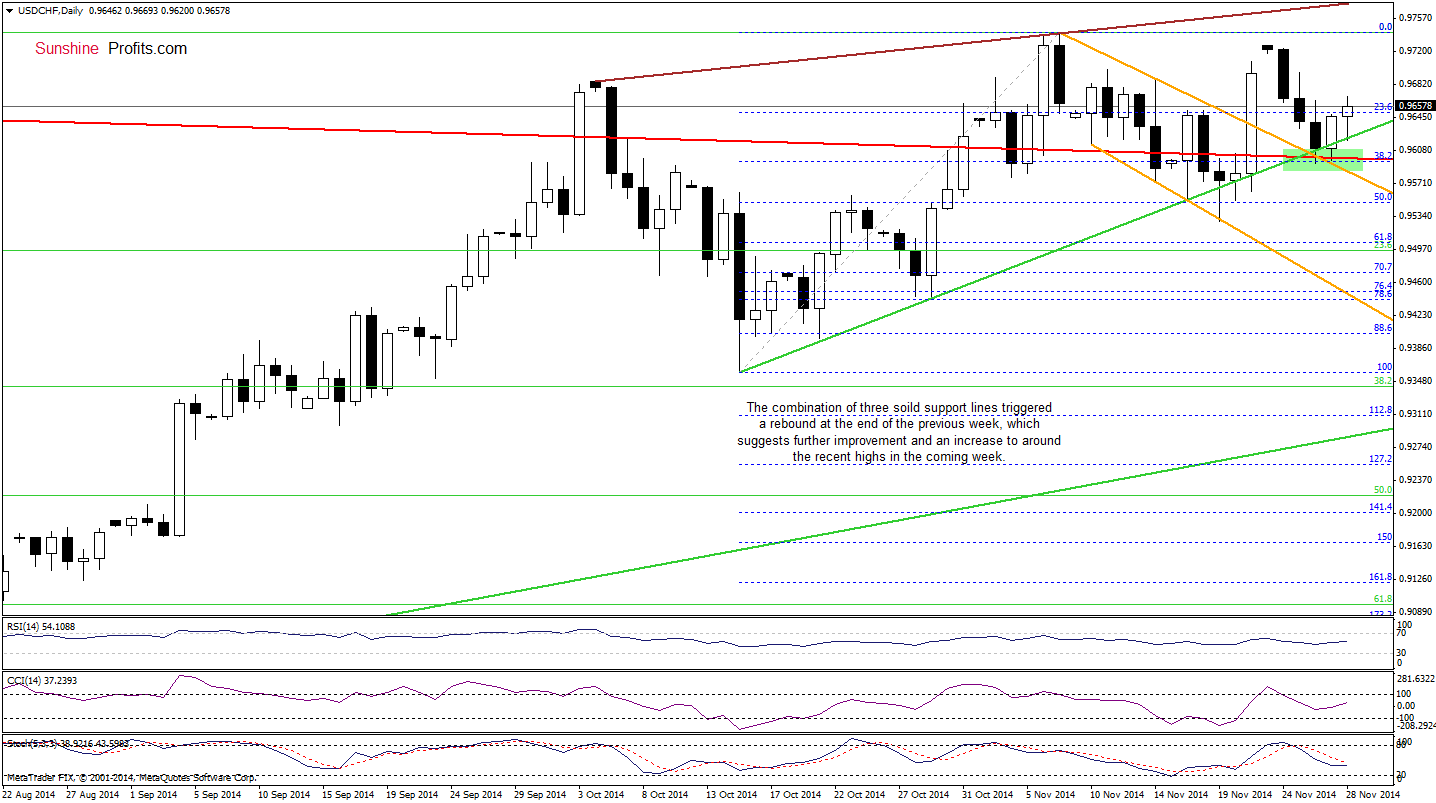
As you see on the daily chart, the situation developed in line with the above-mentioned scenario. Although currency bears tried to push the pair lower three times in a row, they failed, which resulted in a rebound. Taking this positive fact into account, we think that USD/CHF will extend gains and we’ll see an increase to around 0.9722 (the Nov 24 high) in the coming week.
Very short-term outlook: mixed with bullish bias
Short-term outlook: mixed
MT outlook: mixed
LT outlook: bearish
Trading position (short-term; our opinion): No positions are justified from the risk/reward perspective at the moment. We will keep you informed should anything change, or should we see a confirmation/invalidation of the above.
Thank you.
Nadia Simmons
Forex & Oil Trading Strategist
Forex Trading Alerts
Oil Investment Updates
Oil Trading Alerts

