
Earlier today, the U.K. Office for National Statistic reported that public sector net borrowing rose by £7.05 billion in October ( missing analysts’ expectations for a rise by £6.90 billion), which pushed the British pound lower against the U.S. dollar. The euro came under pressure after ECB President Mario Draghi commentary, while the greenback declined against loonie after Statistics Canada reported that consumer price inflation rose 0.1% last month, beating expectations for a 0.3% fall. How did these fundamental factors affected the technical picture of GBP/USD, EUR/USD and USD/CAD? What happened with other currency pairs at the same time?
In our opinion the following forex trading positions are justified - summary:
- EUR/USD: none
- GBP/USD: short (stop-loss: 1.5763; initial price target: 1.5307)
- USD/JPY: none
- USD/CAD: none
- USD/CHF: none
- AUD/USD: none
EUR/USD
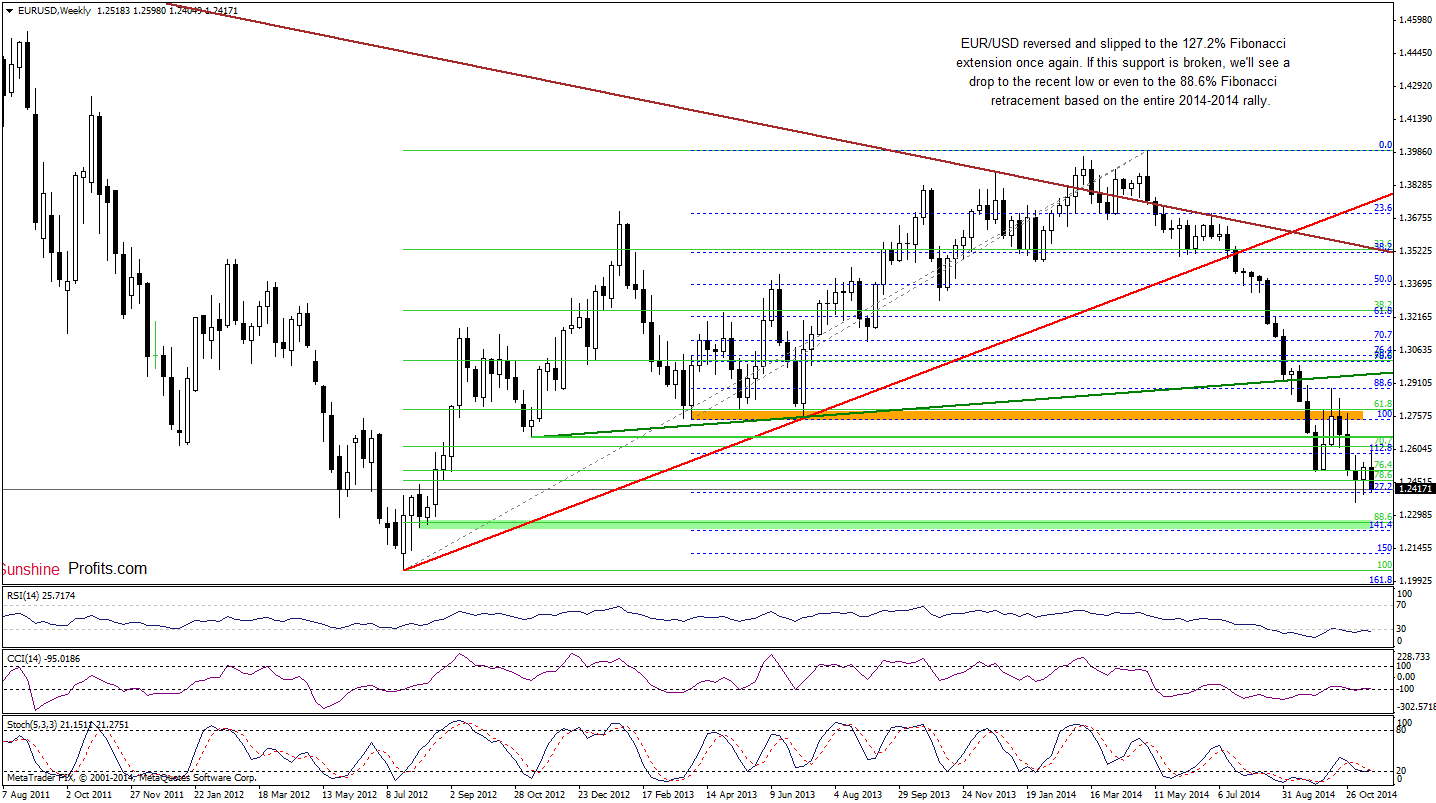
The medium-term picture of EUR/USD has deteriorated as the exchange rate reversed and declined to the 127.2% Fibonacciextension. If this support is broken, we’ll see a drop to the recent low or even to the 88.6% Fibonacci retracement based on the entire 2012-2014 rally.
Having say that, let’s focus on the very short-term changes.
Yesterday, we wrote the following:
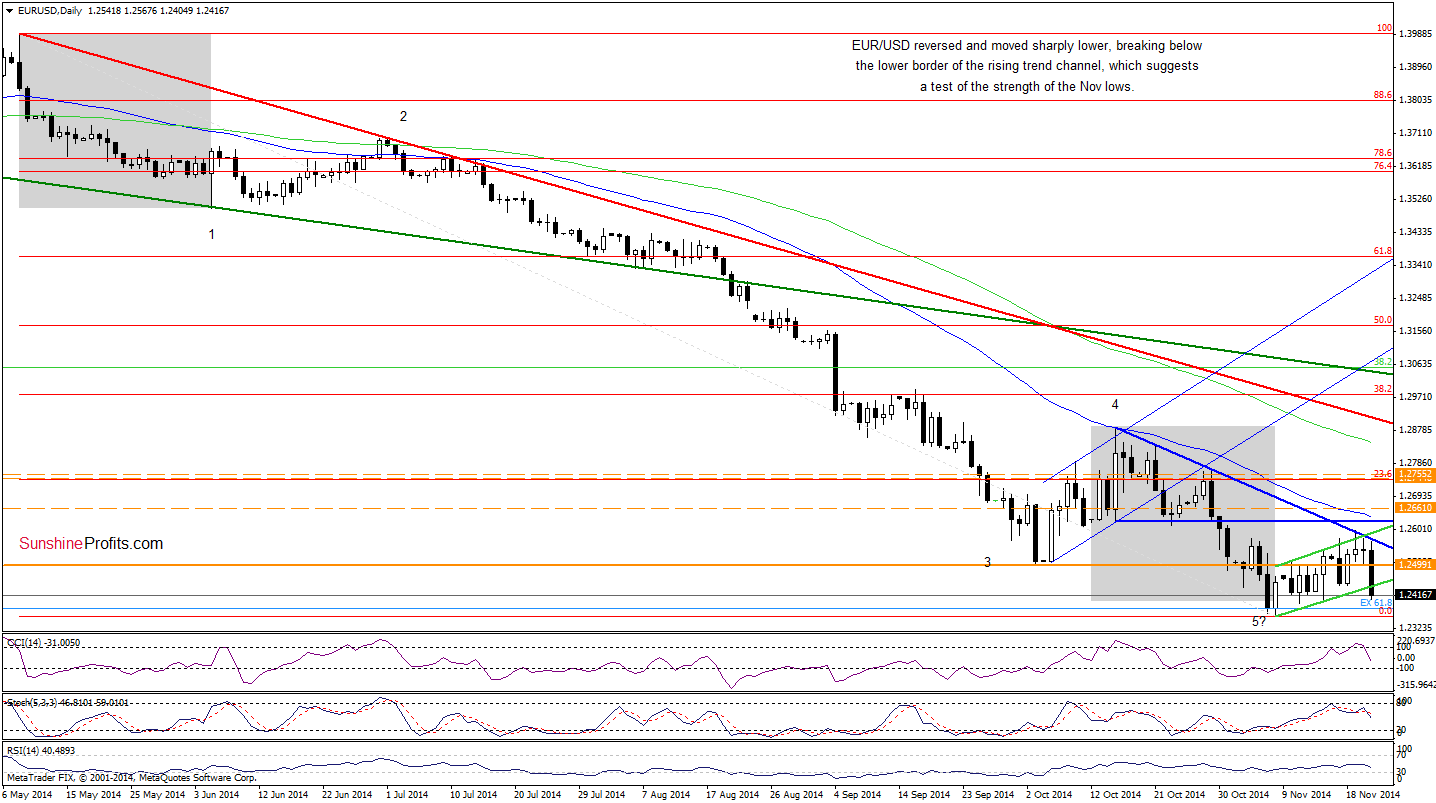
(…) if the pair breaks below 1.2500, we could see further deterioration and a test of the strength of the lower border of the rising trend channel (currently around 1.2435).
As you see on the daily chart, currency bears not only realized the above-mentioned scenario, but also managed to push the pair below this support line. This is a bearish signal that suggests further deterioration and a test of the strength of the Nov low of 1.2357 in the coming day (or days).
Very short-term outlook: bearish
Short-term outlook: mixed
MT outlook: mixed
LT outlook: bearish
Trading position (short-term): In our opinion, no positions are justified from the risk/reward perspective at the moment. We will keep you informed should anything change, or should we see a confirmation/invalidation of the above.
GBP/USD
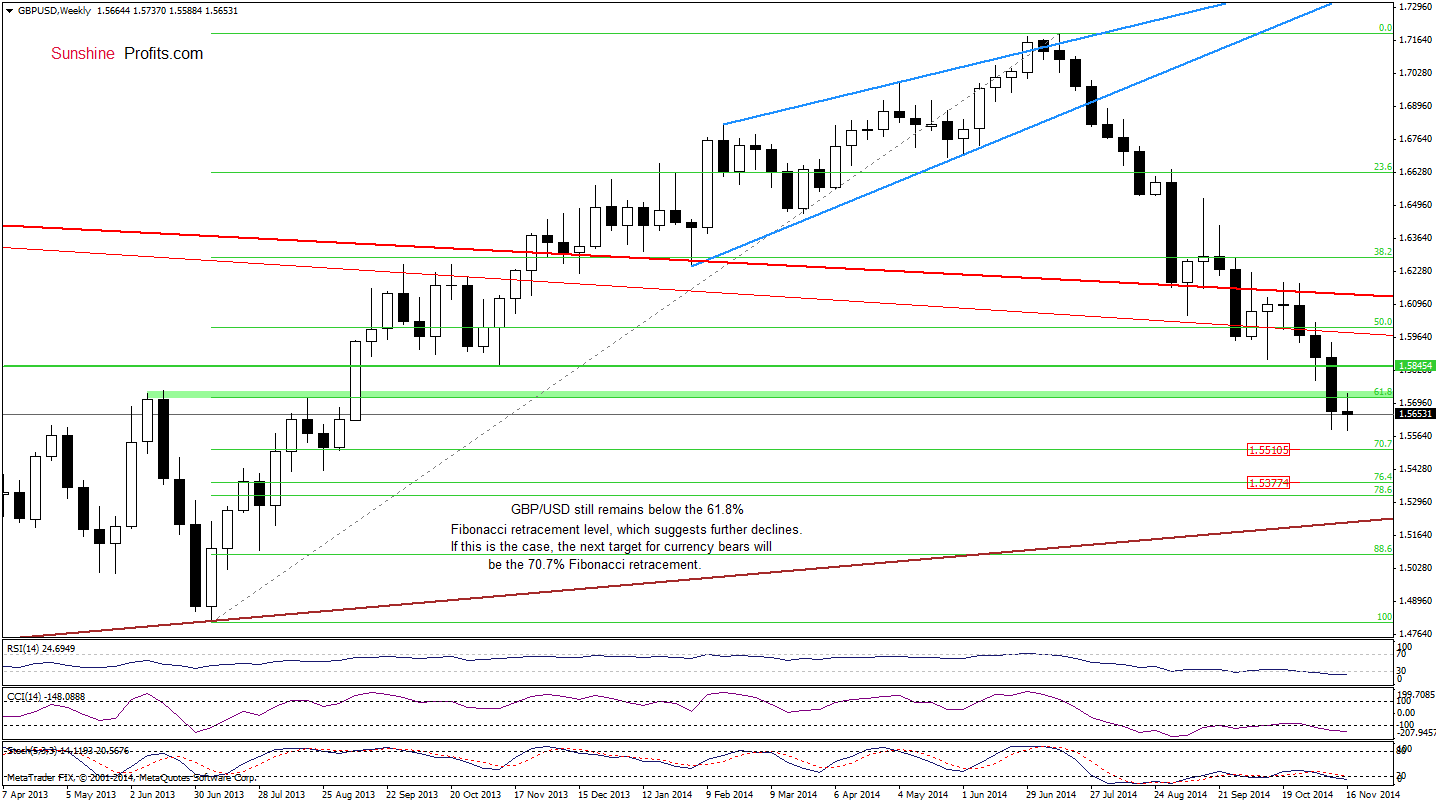
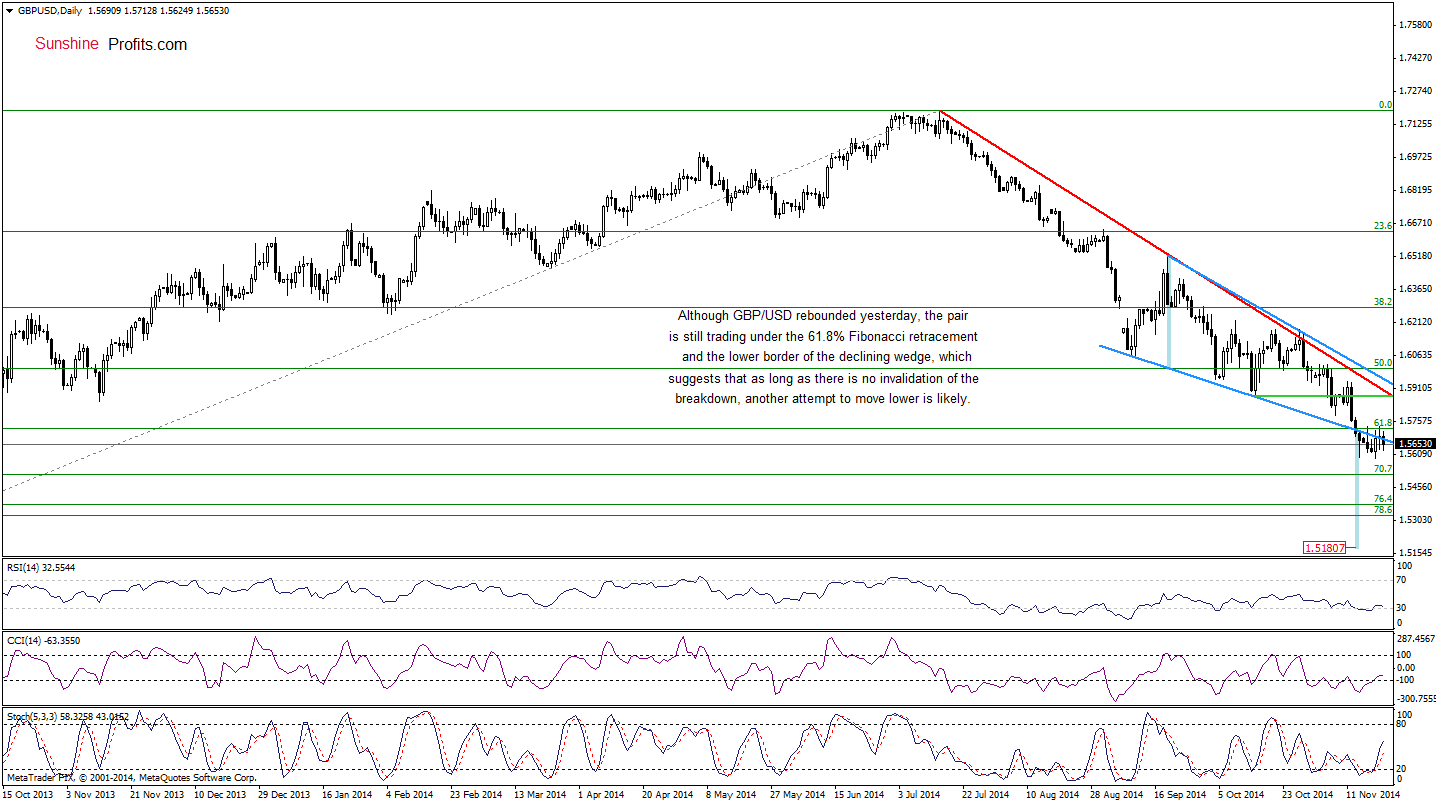
Looking at the above charts, we see that although GBP/USD rebounded slightly, the pair reversed earlier today and is still trading under the 61.8% Fibonacci retracement and the previously-broken lower border of the declining wedge. Therefore, our last commentary on this currency pair is up-to-date:
(…) as long as there is no comeback above these lines, all upswings will be nothing more than verifications of the breakdown and (…) it seems that the next downside target would be around 1.5510, there the 70.7% Fibonacci retracement (…) is. However, when we consider the breakdown under the lower border of the declining wedge, we could see a drop even to 1.5181, where the size of the downward move would correspond to the height of the formation.
Very short-term outlook: bearish
Short-term outlook: bearish
MT outlook: mixed
LT outlook: mixed
Trading position (short-term; our opinion): Short positions with a stop-loss at 1.5763 (initial price target: 1.5307) are justified from the risk/reward perspective at the moment. We will keep you informed should anything change, or should we see a confirmation/invalidation of the above.
USD/JPY
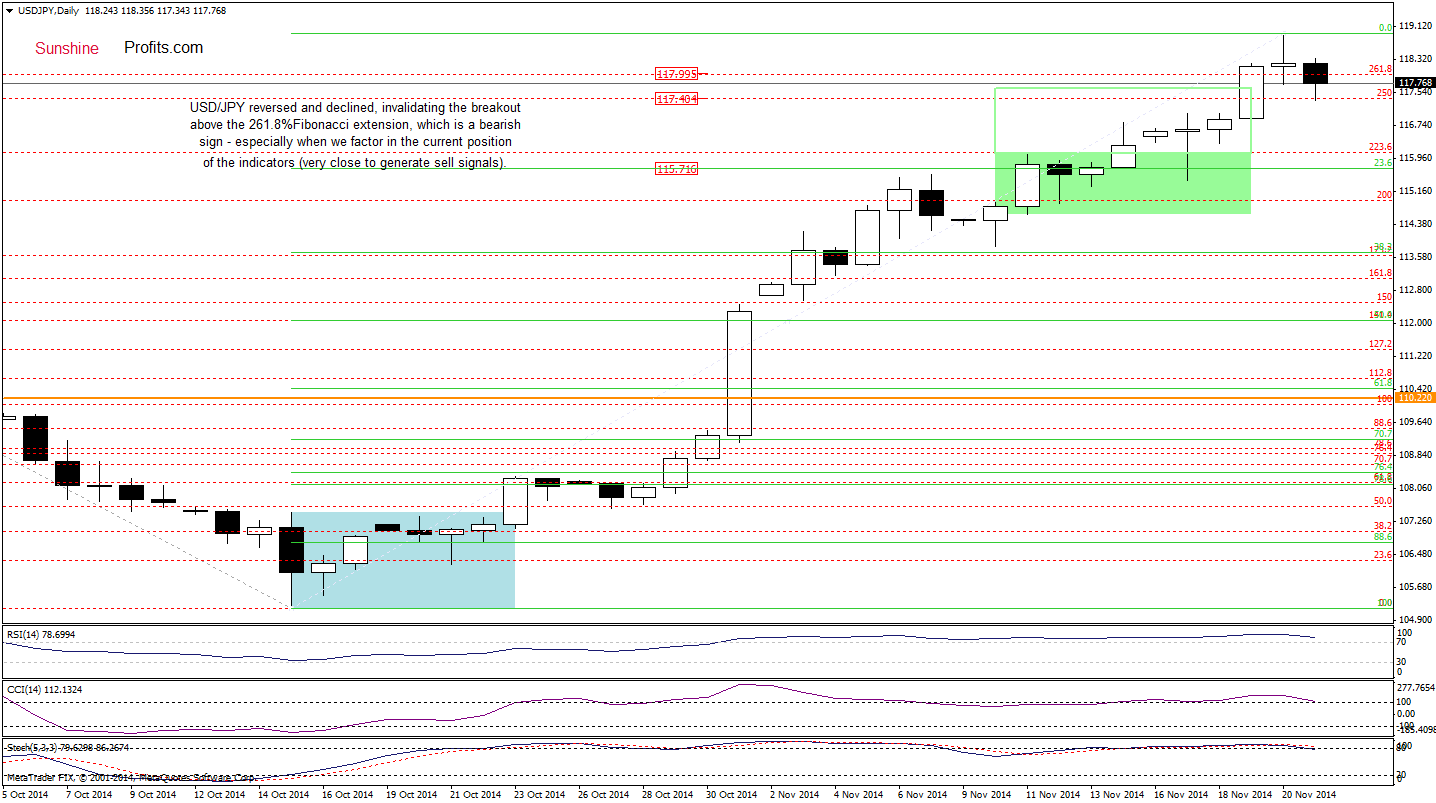
From the very short-term perspective, we see that USD/JPY gave up some gains earlier today and slipped below the 261.8% Fibonacci extension, invalidating Wednesday’s breakout. This is a bearish signal, which suggests further deterioration – especially when we take into account our yesterday’s commentary:
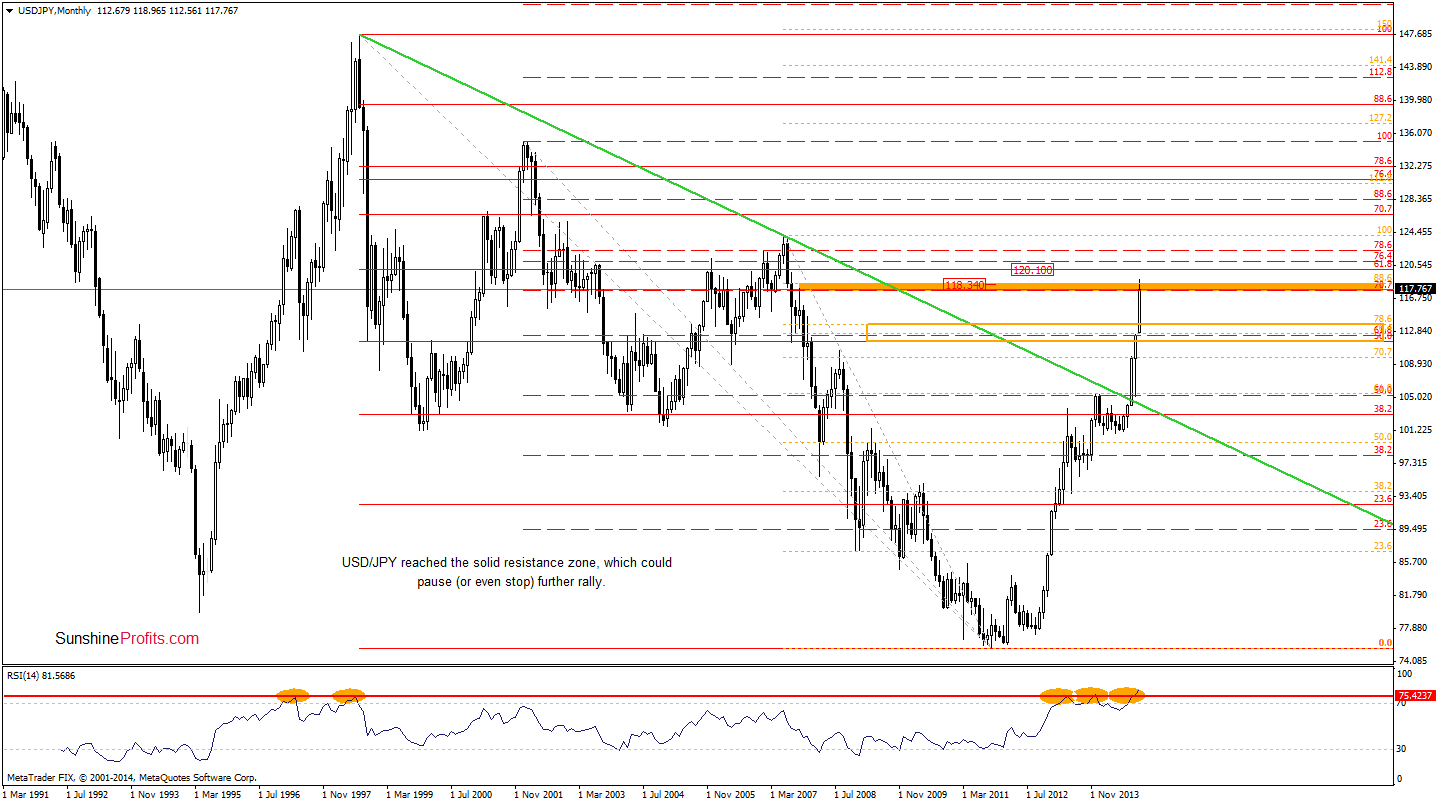
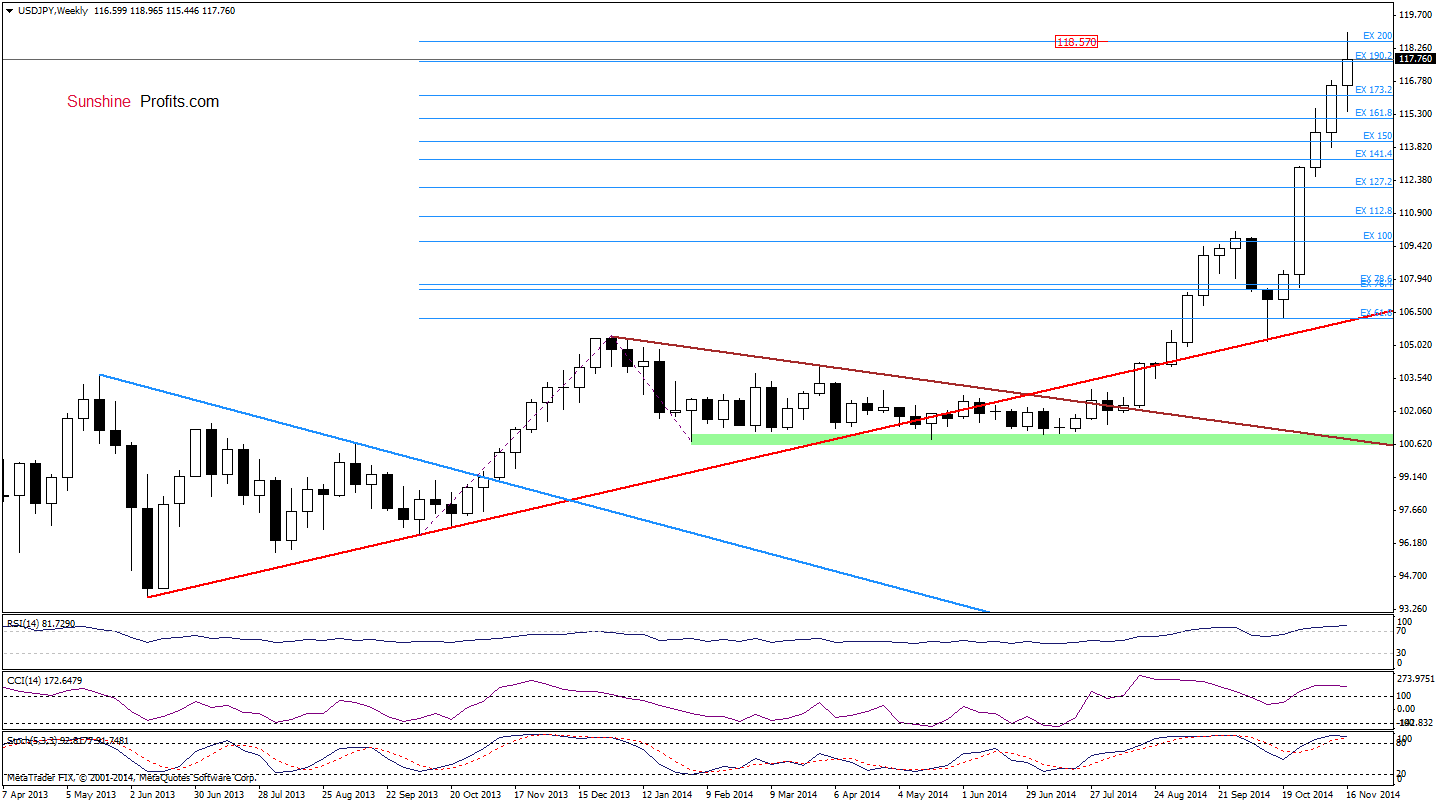
(…) the exchange rate climbed to the strong resistance zone created by the 261.8% Fibonacci extension (marked on the daily chart), the 200% Fibonacci price projection (seen on the weekly chart), the 70.7% Fibonacci retracement (based on the 2002-2011 decline) and 88.6% retracement (based on the 2007-2011 move). In our opinion, the combination of these four resistance levels is strong enough to (at least) pause further improvement and trigger a correction in the near future. Please note that this scenario is currently reinforced by the position of the indicators: the daily RSI climbed to its highest level since Sep (while the monthly indicator hasn’t been so high since 1992) and there are negative divergences between the daily (and also weekly) CCI, the Stochastic Oscillator and the exchange rate. If this is the case, initial downside target would be around 115.72, where the 23.6% Fibonacci retracement based on the entire Oct-Nov rally is.
Very short-term outlook: mixed with bearish bias
Short-term outlook: mixed with bearish bias
MT outlook: bullish
LT outlook: bullish
Trading position (short-term; our opinion): No positions are justified from the risk/reward perspective at the moment. However, we’ll consider opening short positions if we see a confirmation of the above (or after an increase to 120, where the 61.8% Fibonacci retracement based on the entire 1998-2011 decline is). We will keep you informed should anything change, or should we see a confirmation/invalidation of the above.
USD/CAD
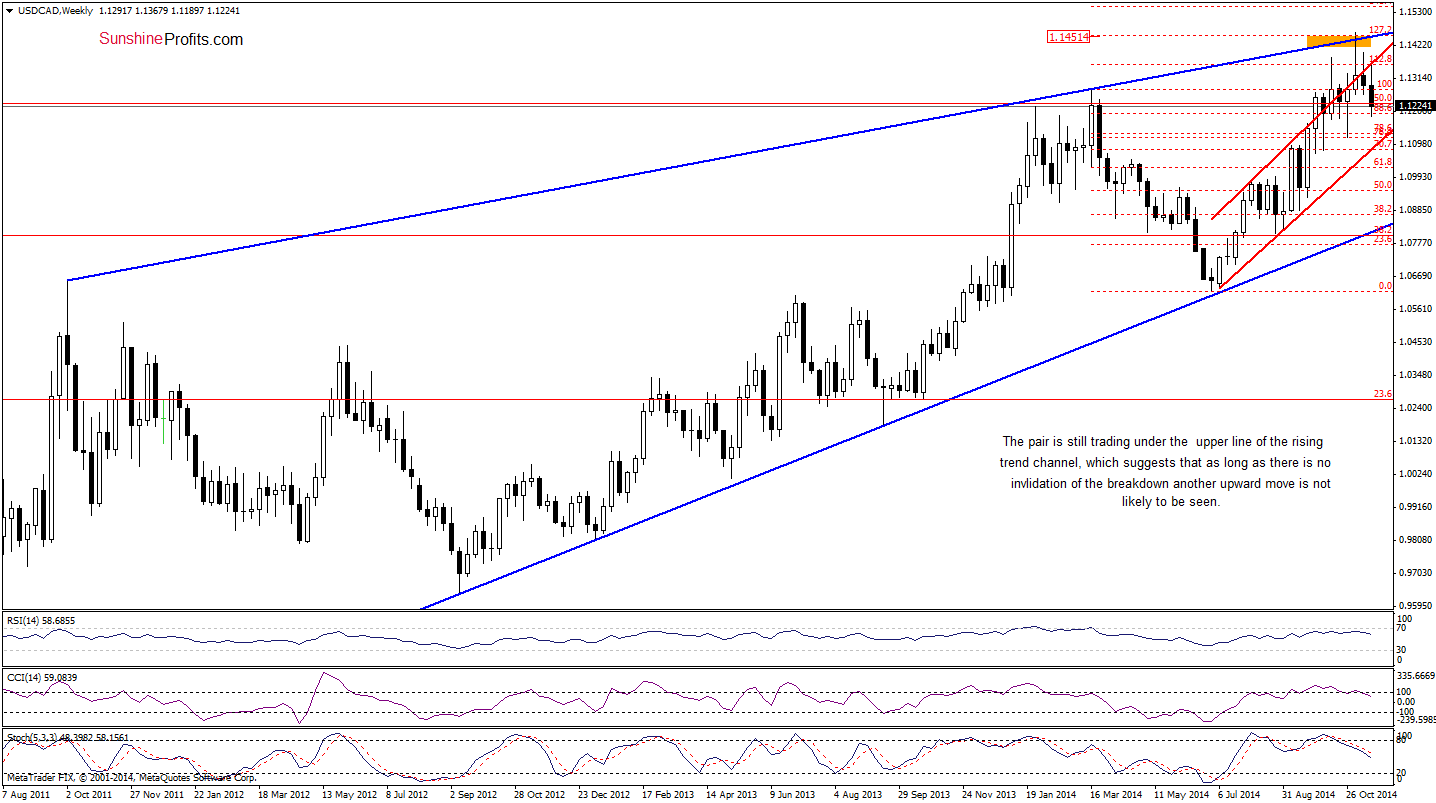
From the weekly perspective, we see that the strong resistance zone created by the upper line of the rising trend channel (marked on the weekly chart) and the 127.2% Fibonacci extension triggered a downswing earlier this week, which deteriorated slightly the medium-term picture. How did this move affect the very short-term outlook? Let’s examine the daily chart and find out.
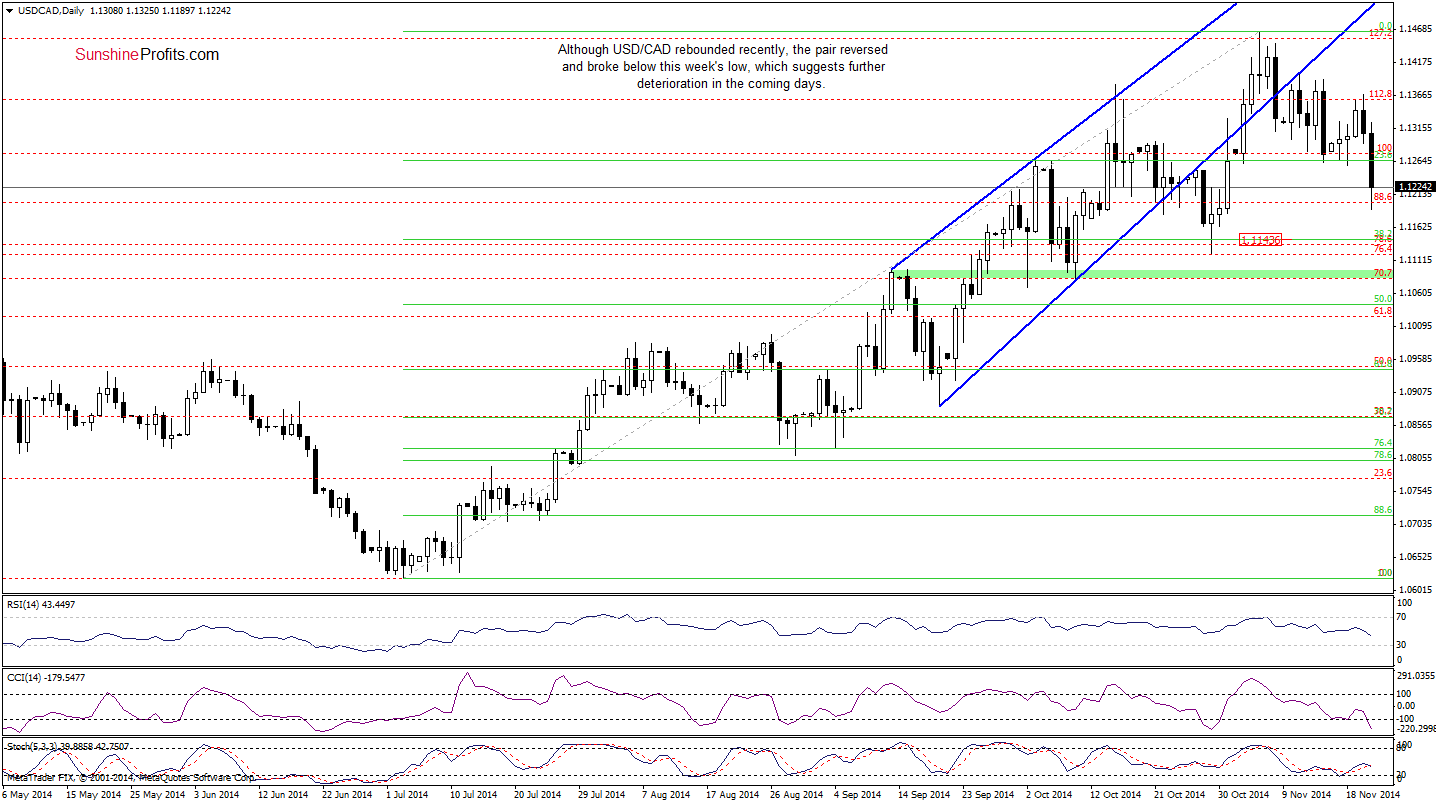
On the daily chart, we see that although USD/CAD moved little higher in the recent days, the pair reversed and decline sharply earlier today, breaking below the 23.6% Fibonacci retracement (based on the entire Jul-Nov rally) and the last week’s low. Taking this fact into account, we are convinced that our last commentary on this currency pair is up-to-date:
(…) we think that if the exchange rate drops below these levels, we’ll see further deterioration and the next downside target would be around 1.1142, where the 38.2% Fibonacci retracement is.
Very short-term outlook: bearish
Short-term outlook: mixed with bearish bias
MT outlook: mixed with bearish bias
LT outlook: bearish
Trading position (short-term; our opinion): No positions are justified from the risk/reward perspective at the moment. We will keep you informed should anything change, or should we see a confirmation/invalidation of the above.
USD/CHF
Quoting our previous Forex Trading Alert:
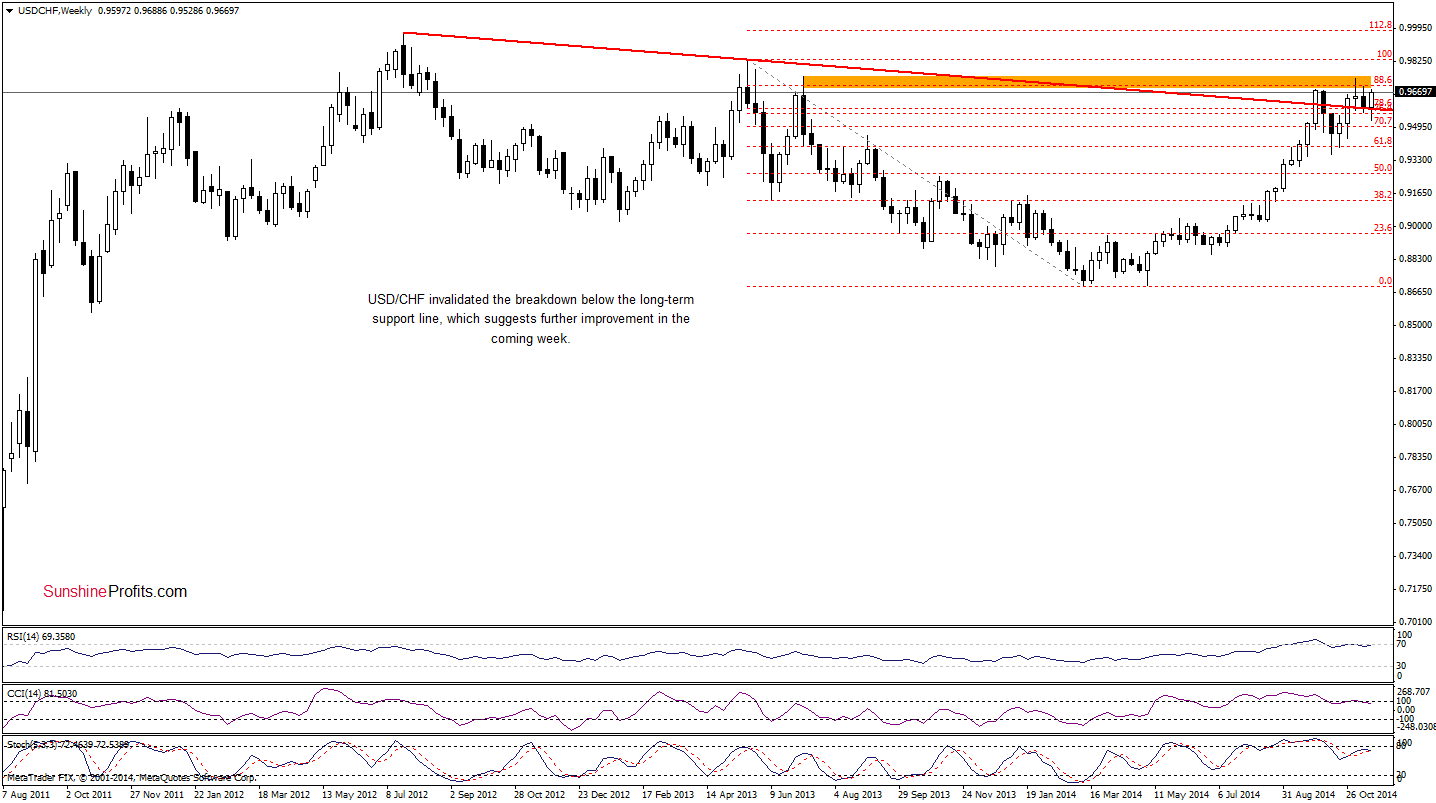
(…) another drop below the long-term red line. Although this is a bearish sign, USD/CHF is still trading above the green rising line. In our opinion, even if we see a breakdown below this support, the lower border of the formation will likely pause further improvement – similarly to what we saw yesterday. Therefore, as long as there is no daily close below this line, a sizable downward move is not likely to be seen
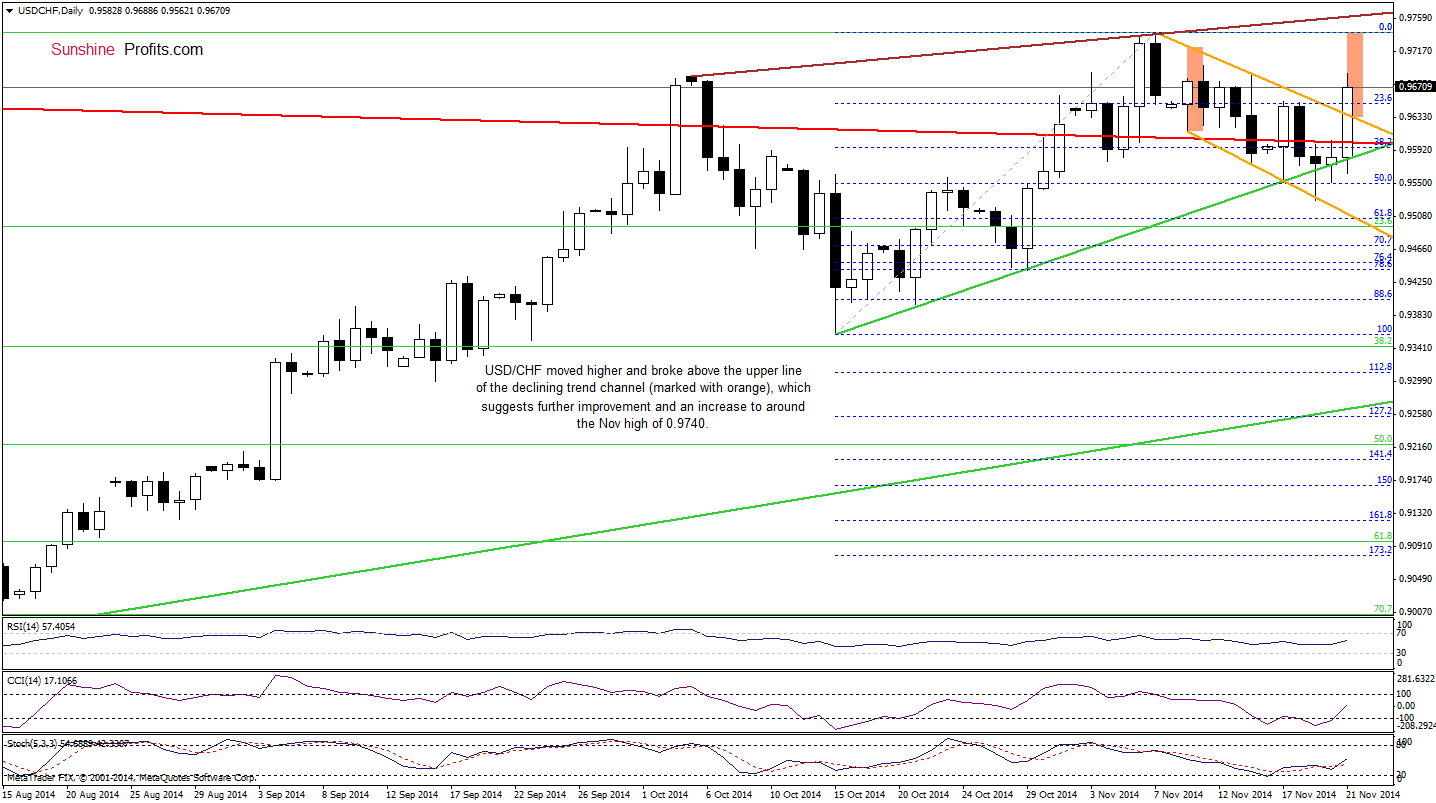
As you see on the daily chart, although USD/CHF slipped below the green rising line earlier today, this deterioration was very temporary and the breakdown was invalidated immediately. This bullish signal triggered further improvement, which resulted in an invalidation of the breakdown below the long-term red line and a sharp rally. With this upward move, USD/CHF climbed above the upper line of the declining trend channel (marked with orange), which is another strong bullish signal that suggests further improvement and an increase to around the Nov high of 0.9740 (in this area the size of the upswing will correspond to the height of the trend channel). Please note that the current position of the indicators also supports the bullish case (buy signal remain in place).
Very short-term outlook: bullish
Short-term outlook: mixed
MT outlook: bearish
LT outlook: bearish
Trading position (short-term; our opinion): No positions are justified from the risk/reward perspective at the moment. We will keep you informed should anything change, or should we see a confirmation/invalidation of the above.
AUD/USD
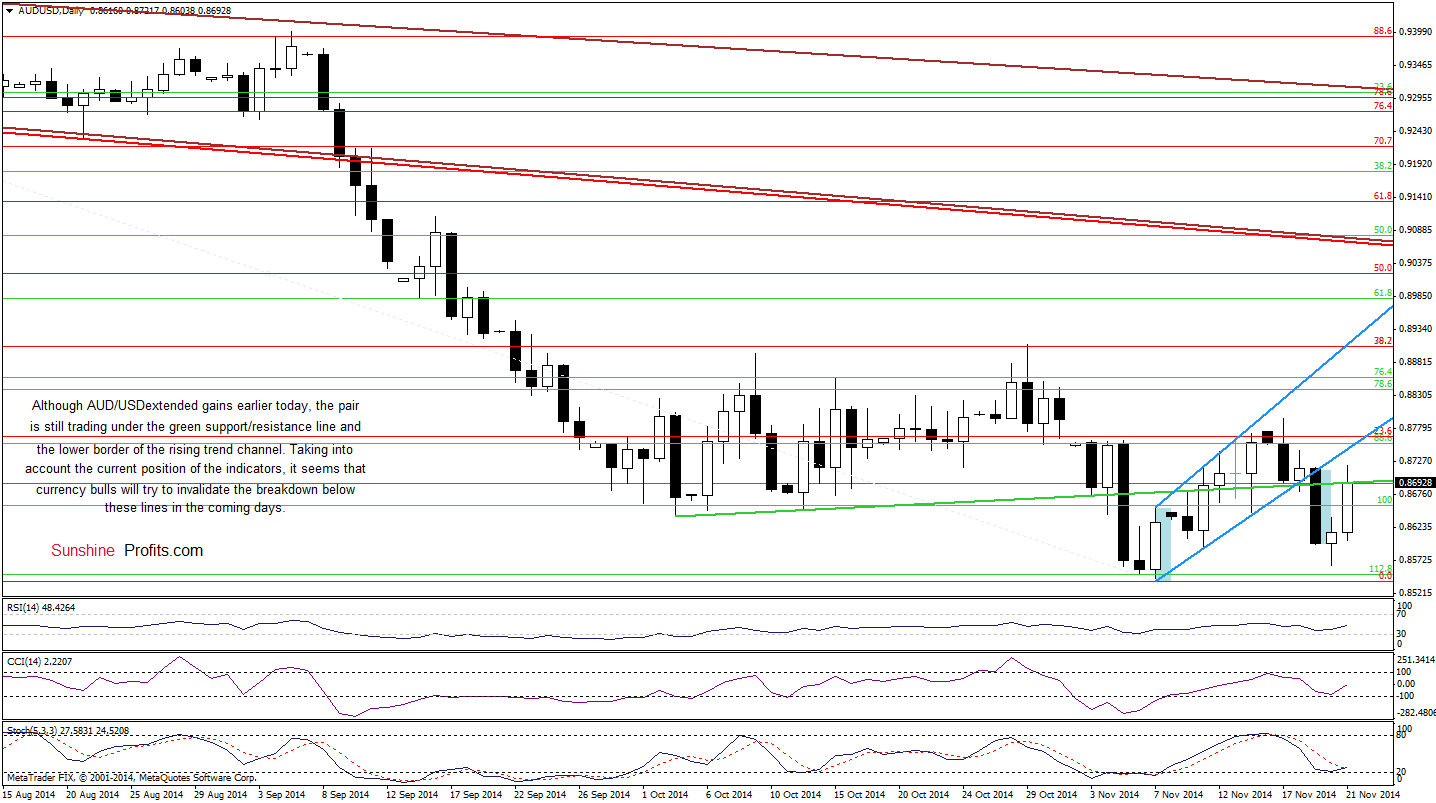
In our last commentary on this currency pair, we wrote the following:
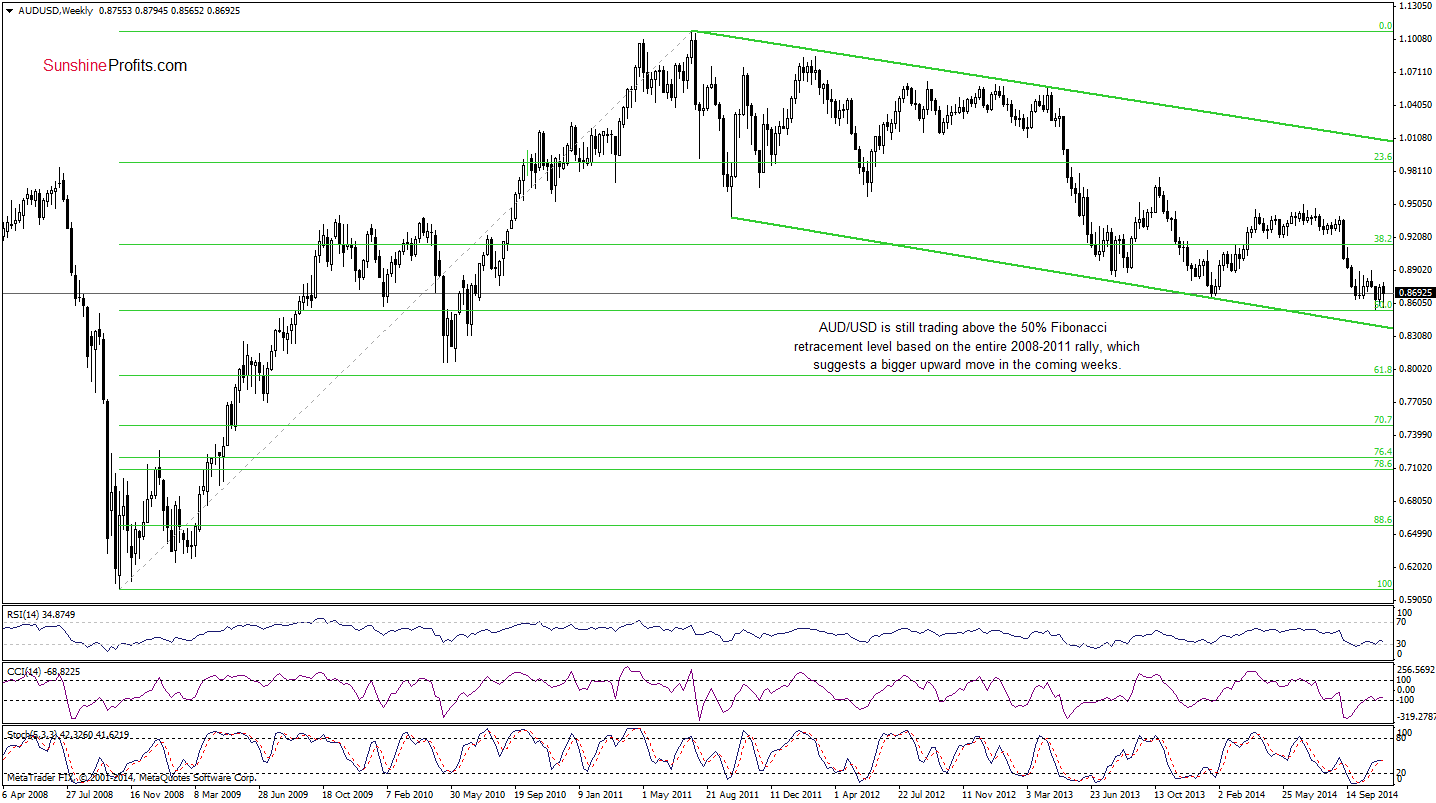
(…) AUD/USD dropped below the lower border of the trend channel, which suggests a decline to at least 0.8600, where the size of the downward move will correspond to the height of the formation (…) sell signals generated by the indicators remain in place, supporting the bearish case.
Looking at the daily chart, we see that the situation developed in line with our scenario as AUD/USD extended losses and hit a weekly low of 0.8565. Despite this deterioration, the proximity to the recent low and the 50% Fibonacci retracement encouraged currency bulls to act, which resulted in a sharp rebound to the previously-broken levels. In our opinion, as long as there is no invalidation of the breakdown, another sizable move is questionable. However, taking into account the current position of the indicators, it seems that we’ll see another attempt to move higher in the coming days. If this is the case, and the exchange rate invalidates the breakdown, we could see an increase even to 0.8909, where the 38.2% Fibonacci retracement based on the entire Jul-Nov decline is.
Very short-term outlook: mixed with bullish bias
Short-term outlook: mixed with bullish bias
MT outlook: mixed
LT outlook: bearish
Trading position (short-term): In our opinion, no positions are justified from the risk/reward perspective at the moment. We will keep you informed should anything change, or should we see a confirmation/invalidation of the above.
Thank you.
Nadia Simmons
Forex & Oil Trading Strategist
Przemyslaw Radomski, CFA
Founder, Editor-in-chief
Gold & Silver Trading Alerts
Forex Trading Alerts
Oil Investment Updates
Oil Trading Alerts

