
Earlier today, the U.S. Commerce Department reported that the number of building permits increased by 4.8% to 1.080 million units in the previous month, beating analysts‘ expectations for a 0.9% rise to 1.040 million units. As a result, the greenback moved higher and EUR/USD dropped below the resistance line. Will it stop further improvement?
In our opinion the following forex trading positions are justified - summary:
- EUR/USD: none
- GBP/USD: short (stop-loss: 1.5763; initial price target: 1.5307
- USD/JPY: none
- USD/CAD: none
- USD/CHF: none
- AUD/USD: none
EUR/USD
The medium-term picture of EUR/USD hasn’t changed much as the exchange rate is trading around the last week’s high. Are there any very short-term changes that could give us more clues about future moves? Let’s examine the daily chart and find out.
Yesterday, we wrote the following:
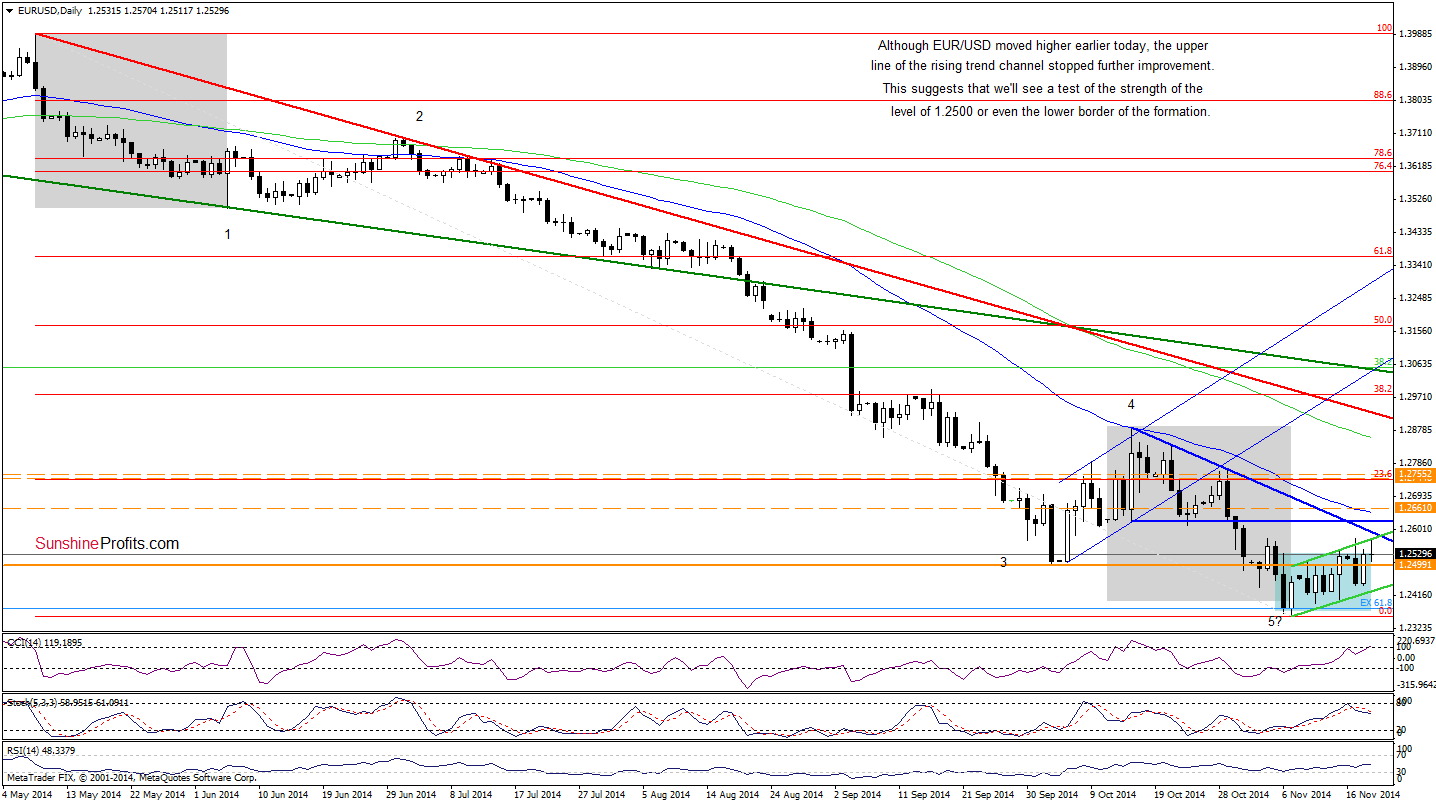
(…) the exchange rate came back above the level of 1.2500 once again and reached the upper line of the consolidation (marked with blue) (…) if currency bulls push the pair higher, we’ll see an increase to the upper line of the very short-term rising trend channel (around 1.2564) or even to the blue resistance line based on the Oct 15, Oct 21 and Oct 29 highs (currently around 1.2600).
Although the situation developed in line with the above-mentioned scenario as EUR/USD reached our initial upside target earlier today, the pair is still trading under the upper border of the rising trend channel and the blue resistance line. Therefore, we think that as long as there is no breakout above these lines, a sizable upward move is not likely to be seen. Additionally, taking into account the position of the indicators, it seems that another test of the strength of the level of 1.2500 should not surprise us.
Very short-term outlook: mixed
Short-term outlook: mixed
MT outlook: mixed
LT outlook: bearish
Trading position (short-term): In our opinion, no positions are justified from the risk/reward perspective at the moment. We will keep you informed should anything change, or should we see a confirmation/invalidation of the above.
GBP/USD
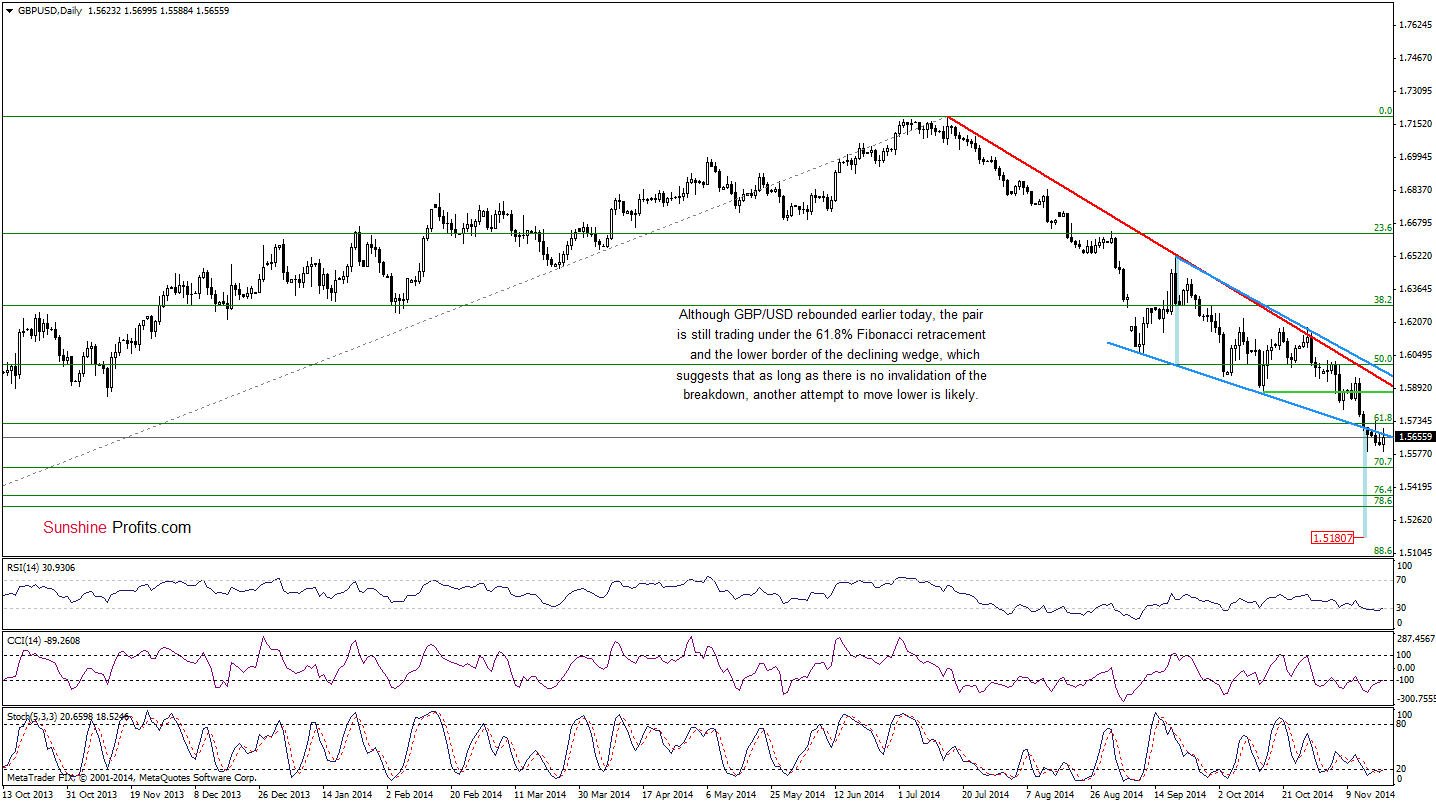
Looking at the daily chart, we see that although GBP/USD rebounded earlier today, the pair is still trading under the 61.8% Fibonacci retracement and the previously-broken lower border of the declining wedge (the breakdown was confirmed by four consecutive daily closes). In our opinion, as long as there is no comeback above these lines, all upswings will be nothing more than verifications of the breakdown and our last commentary will be up-to-date:
(…) it seems that the next downside target would be around 1.5510, there the 70.7% Fibonacci retracement (…) is. However, when we consider the breakdown under the lower border of the declining wedge, we could see a drop even to 1.5181, where the size of the downward move would correspond to the height of the formation.
Very short-term outlook: bearish
Short-term outlook: bearish
MT outlook: mixed
LT outlook: mixed
Trading position (short-term; our opinion): Short positions with a stop-loss at 1.5763 (initial price target: 1.5307) are justified from the risk/reward perspective at the moment. We will keep you informed should anything change, or should we see a confirmation/invalidation of the above.
AUD/USD
In our last commentary on this currency pair, we wrote the following:
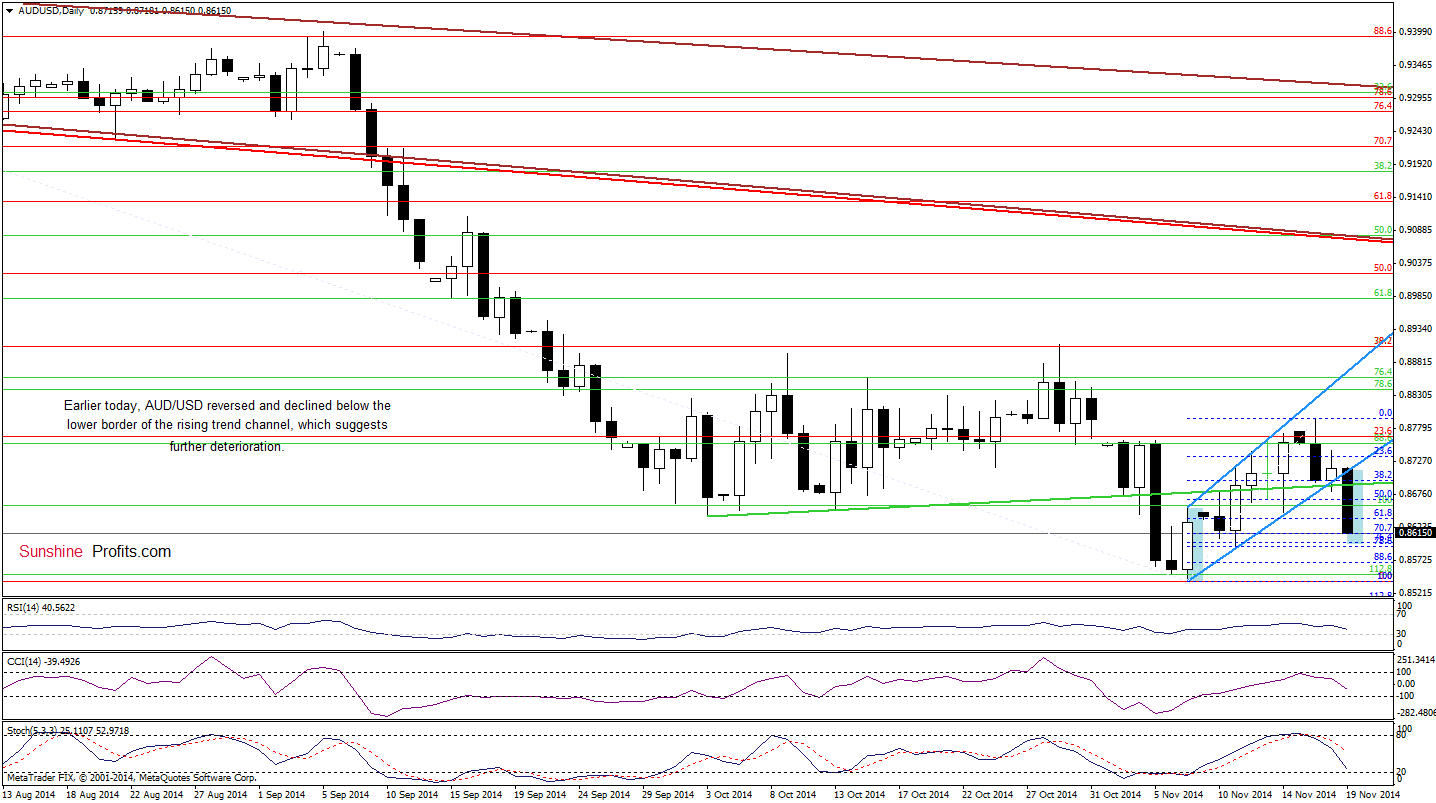
(…) the exchange rate erased 38.2% of the recent rally and approached the previously-broken green support line. (…) taking into account the current position of the indicators, it seems that the pair will move lower and test the strength of the lower line of the trend channel (currently around 0.8665) in the coming days.
On the above chart, we see that currency bears not only realized the above-mentioned scenario, but also managed to push the pair lower. As a result, AUD/USD dropped below the lower border of the trend channel, which suggests a decline to at least 0.8600, where the size of the downward move will correspond to the height of the formation. At this point it’s worth noting that this area is supported by the 76.4% and 78.6% Fibonacci retracement levels based on the entire Nov rally. Please note that sell signals generated by the indicators remain in place, supporting the bearish case.
Very short-term outlook: bearish
Short-term outlook: mixed
MT outlook: mixed
LT outlook: bearish
Trading position (short-term): In our opinion, no positions are justified from the risk/reward perspective at the moment. We will keep you informed should anything change, or should we see a confirmation/invalidation of the above.
Thank you.
Nadia Simmons
Forex & Oil Trading Strategist
Przemyslaw Radomski, CFA
Founder, Editor-in-chief
Gold & Silver Trading Alerts
Forex Trading Alerts
Oil Investment Updates
Oil Trading Alerts

