
Earlier today, official data showed that U.S. retail sales rose 0.3% last month, beating expectations for a 0.2% gain, while core retail sales (without automobiles) increased by 0.3% in October. Additionally, the University of Michigan reported that its consumer sentiment index climbed to a more than seven-year high of 89.4 this month beating analysts‘expectations for a rise to 87.5. Thanks to these bullish numbers, the USD Index, which tracks the performance of the greenback against a basket of six major currencies, climbed to a four-and-a-half year high. How did this rally affect the short-term outlook of major currency pairs?
In our opinion the following forex trading positions are justified - summary:
EUR/USD
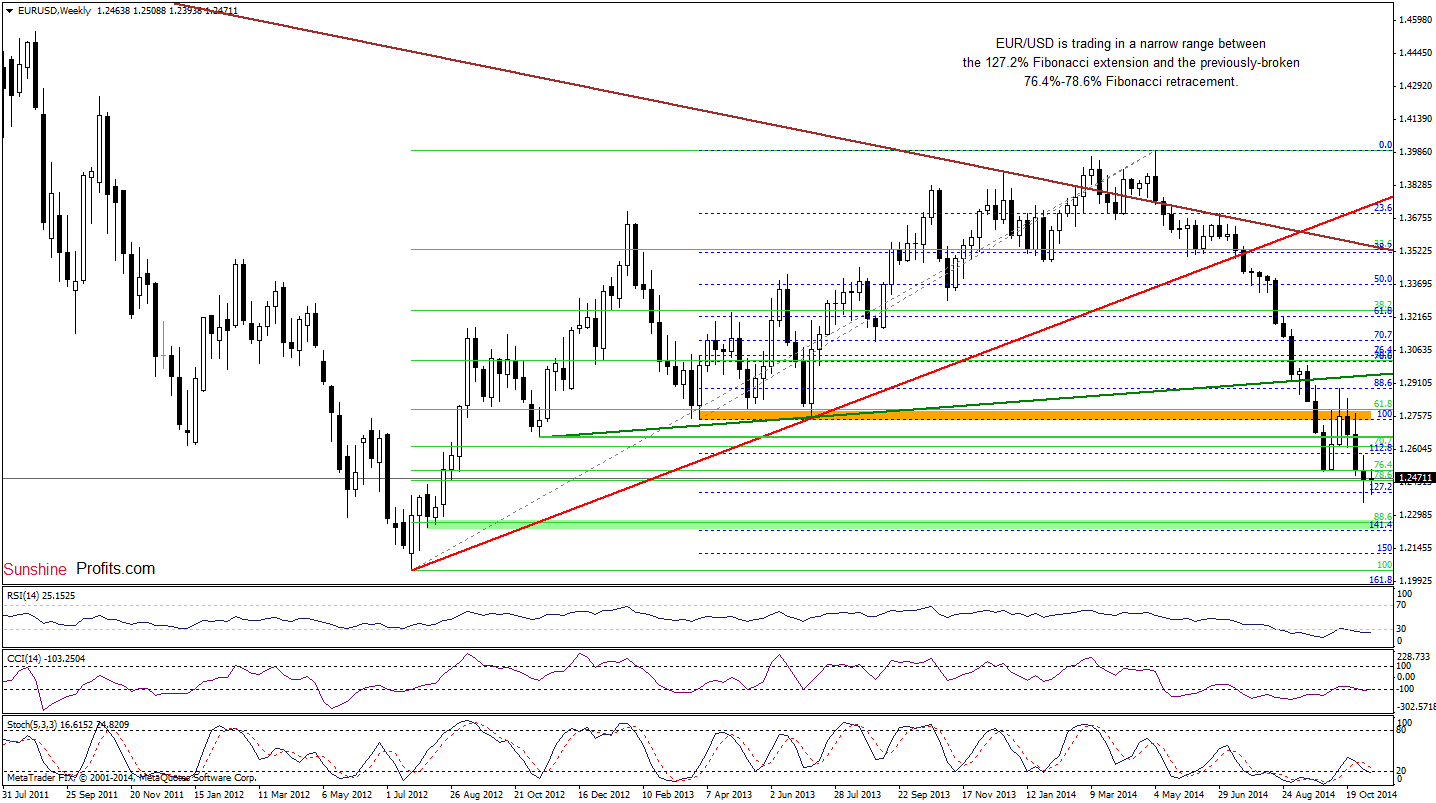
The medium-term picture of EUR/USD hasn’t changed much as the exchange rate is still trading around the 127.2% Fibonacci extension. Will the daily chart show us where will the pair head next?
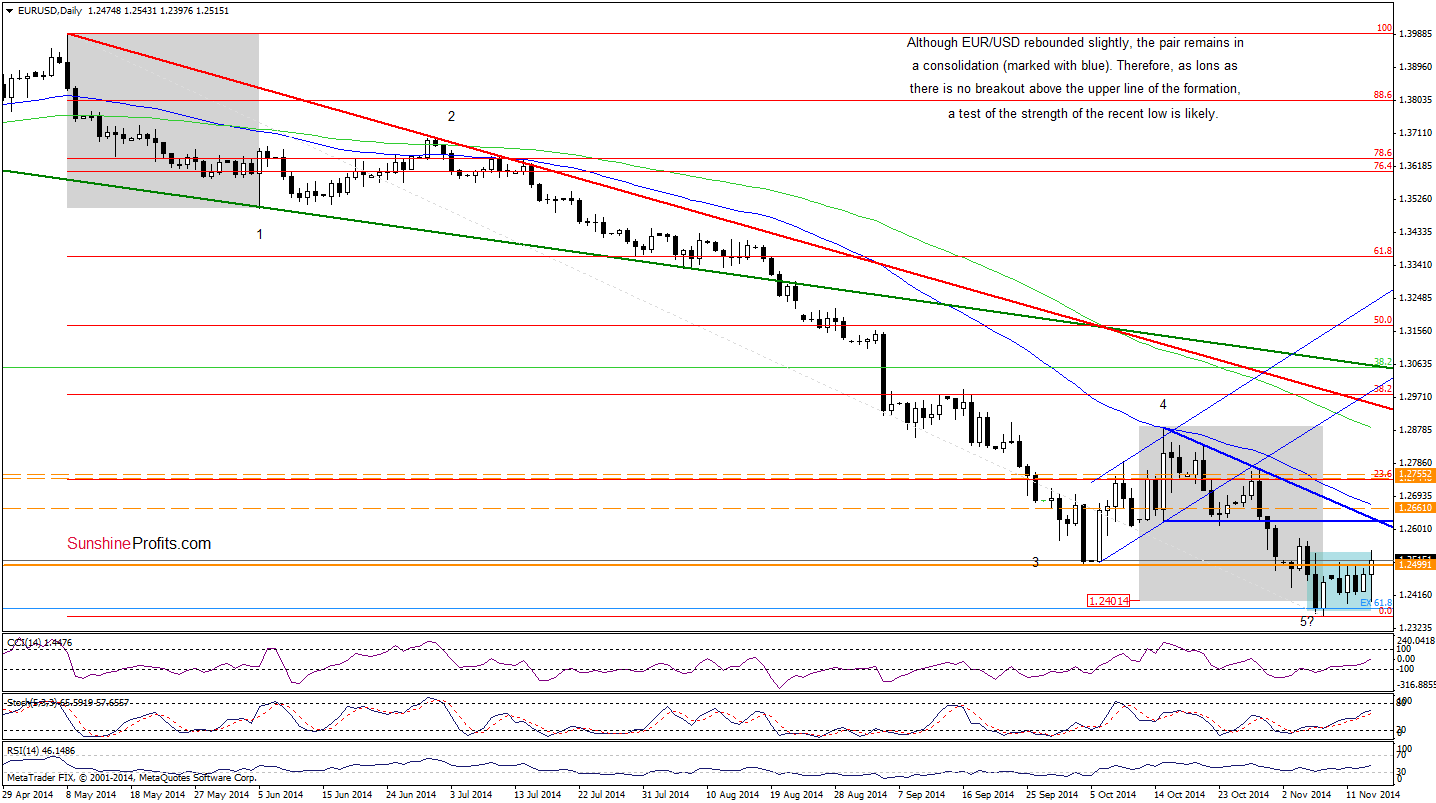
From this perspective, we see that EUR/USD moved higher earlier today and came back above the level of 1.2500. In this way, the pair invalidated the breakdown below this key resistance, which is a bullish signal. Despite this increase, the pair is still trading in the consolidation (marked with blue). However, if the exchange rate closes the day above 1.2500, it seems that we’ll see a breakout above the upper line of the formation and a rally to around 1.2624, where the Oct 15 low (the lower line of the previous consolidation) and the blue declining resistance line are.
Very short-term outlook: mixed with bullish bias
Short-term outlook: mixed
MT outlook: mixed
LT outlook: bearish
Trading position (short-term): In our opinion, no positions are justified from the risk/reward perspective at the moment. We will keep you informed should anything change, or should we see a confirmation/invalidation of the above.
GBP/USD
Quoting our last commentary on this currency pair:
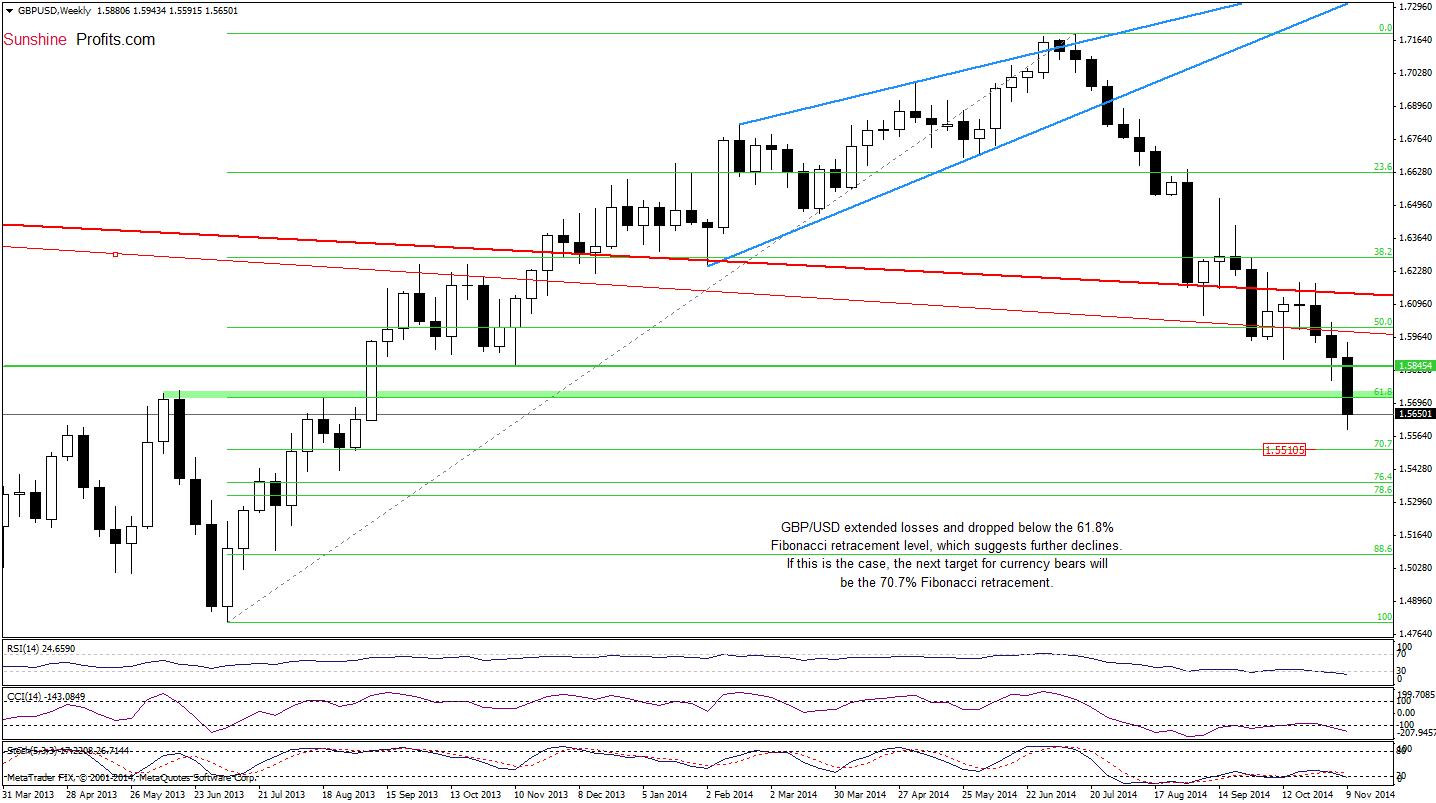
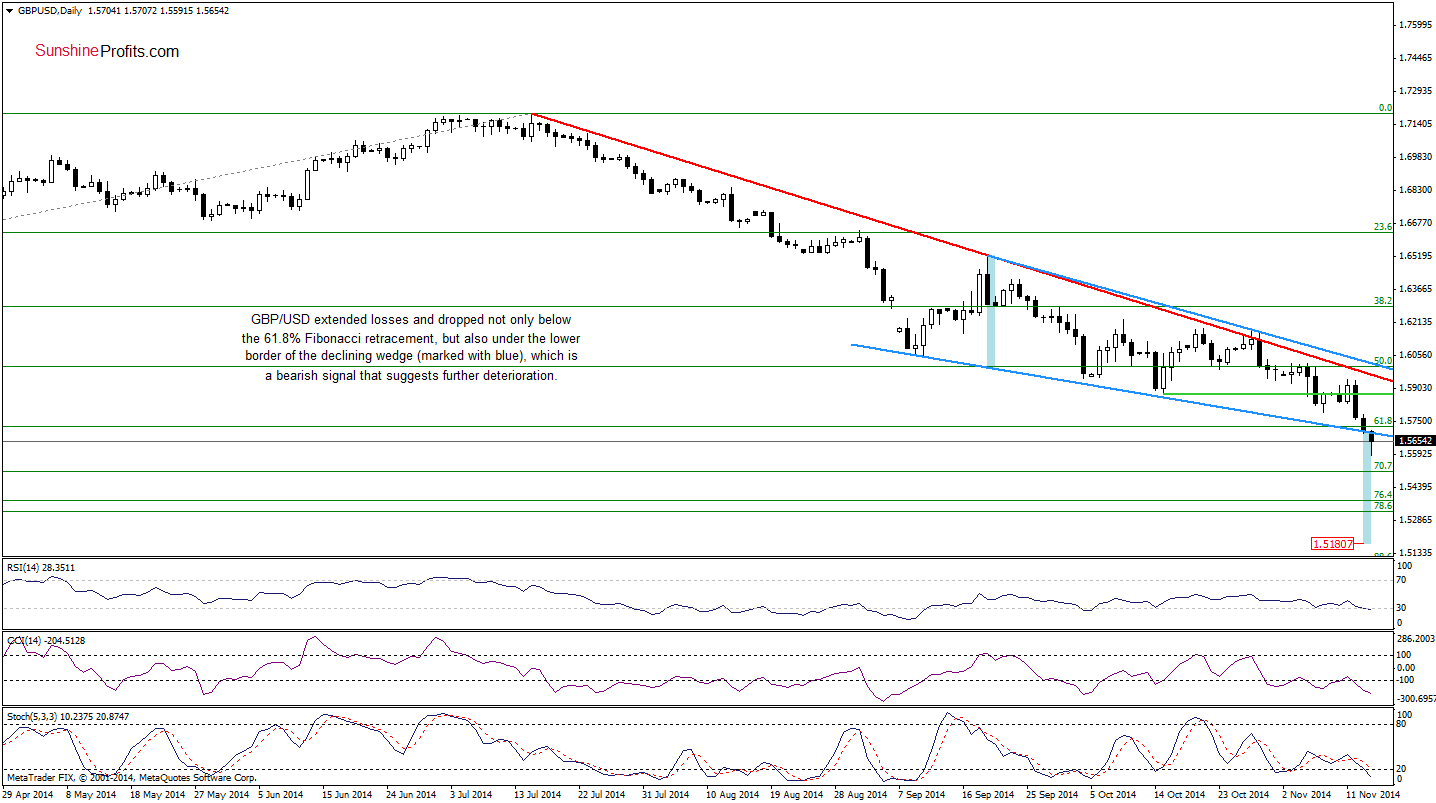
(…) the exchange rate reversed and declined under the green line, which suggests that we’ll see further deterioration and the next downside target would be around 1.5705-1.5730, where the support zone create by the 61.8% Fibonacci retracement and the lower border of the declining wedge (marked with blue on the daily chart) are.
Looking the above charts, we see that the situation developed in line with our scenario and the exchange rate reached the above-mentioned downside target yesterday. As you see currency bulls failed in this area, which resulted in a breakdown below the key support levels. Taking this fact into account, it seems that the next downside target would be around 1.5510, there the 70.7% Fibonacci retracement (marked on the weekly chart) is. However, when we consider the breakdown under the lower border of the declining wedge, we could see a drop even to 1.5181, where the size of the downward move would correspond to the height of the formation. Additionally, sell signals generated by the daily indicators remain in place, supporting the bearish case.
Very short-term outlook: bearish
Short-term outlook: mixed with bearish bias
MT outlook: mixed
LT outlook: mixed
Trading position (short-term): In our opinion, no positions are justified from the risk/reward perspective at the moment. We will keep you informed should anything change, or should we see a confirmation/invalidation of the above.
USD/JPY
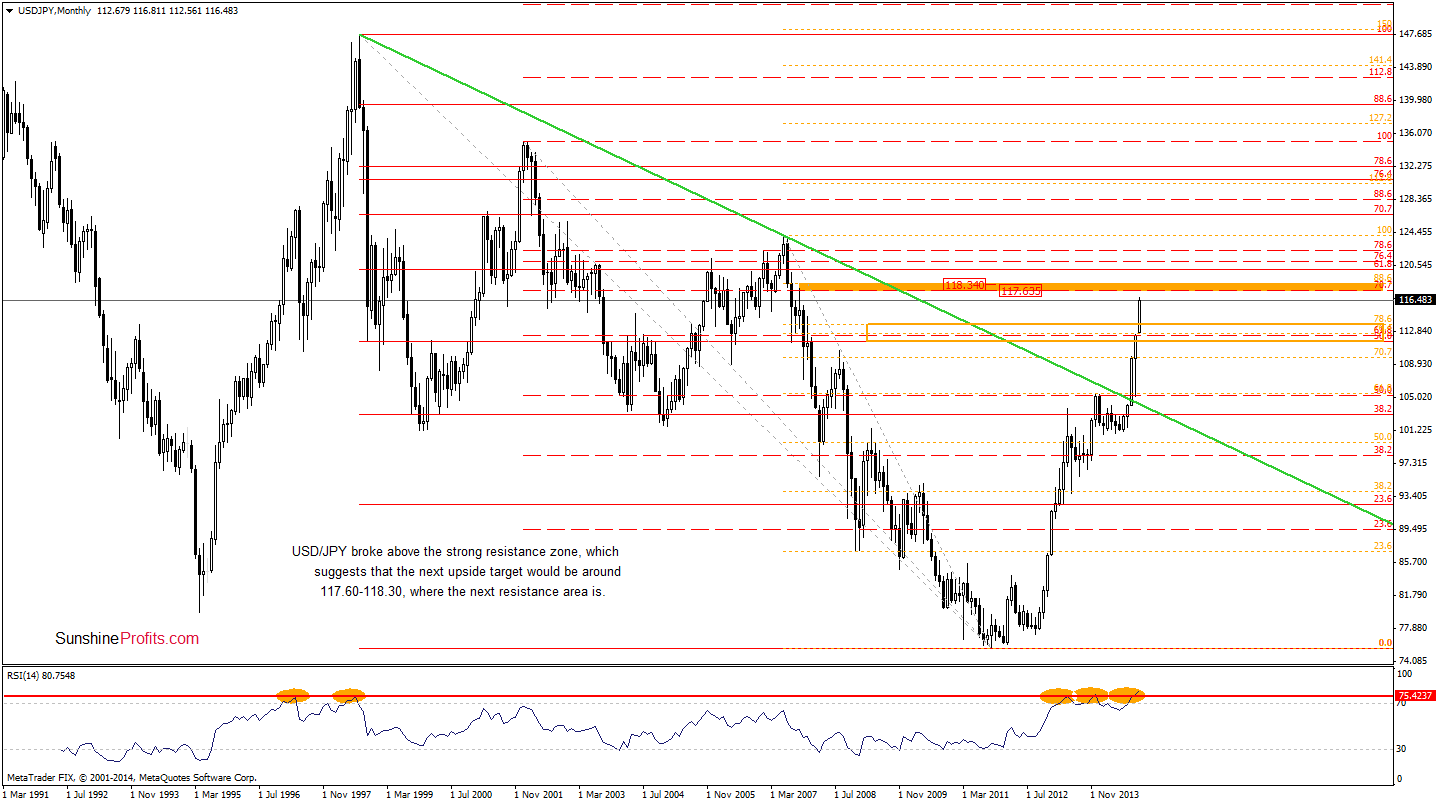
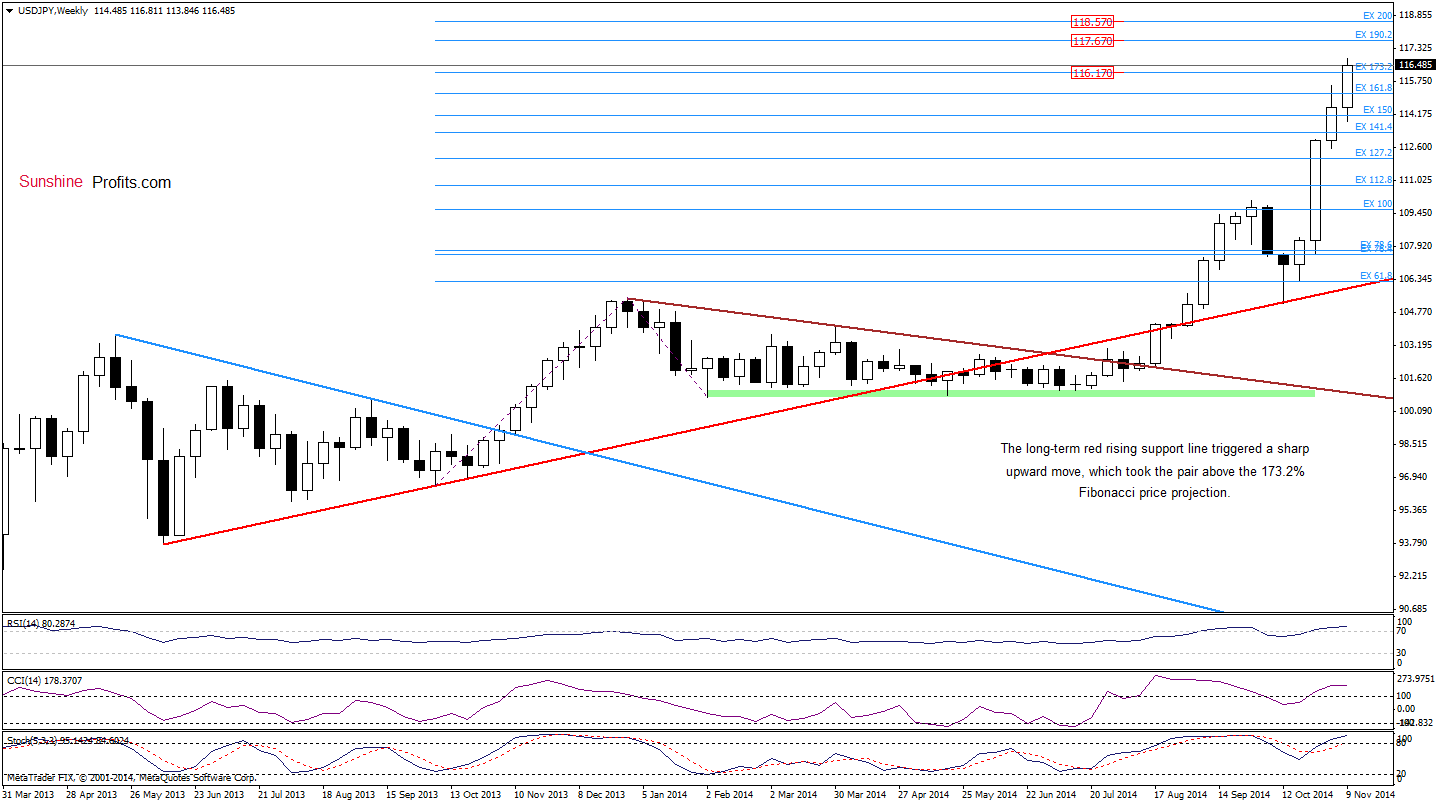
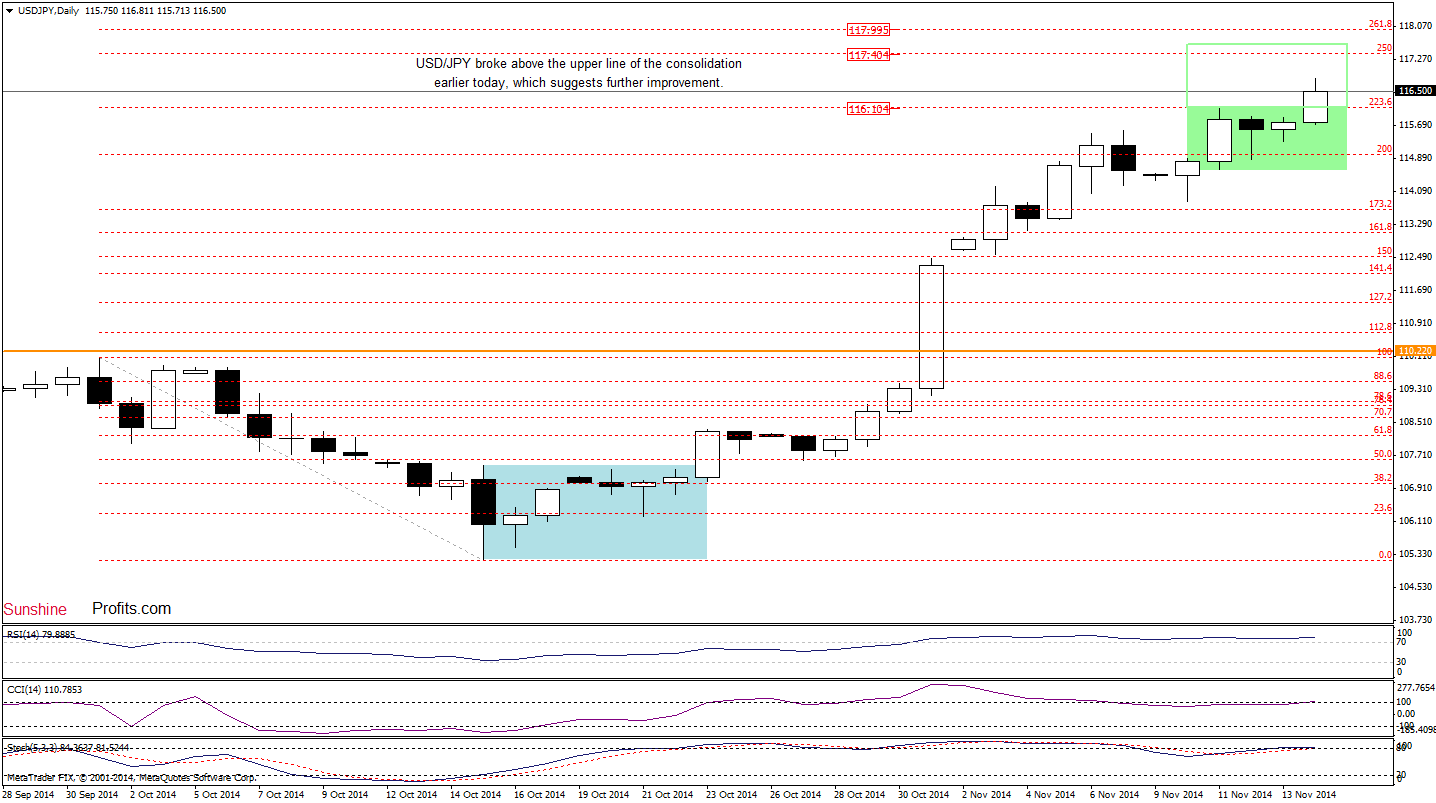
Yesterday, we wrote the following:
(…) Taking into account the fact that the exchange rate is consolidating once again we could see another upswing in the coming days.
As you see on the above charts, currency bulls pushed the pair higher as we expected and USD/JPY hit a fresh multi-year high. With this move, the exchange rate broke above the upper line of the consolidation, which suggests further improvement. If this is the case, the initial upside target would be the 250% Fibonacci extension at 117.40 or even the solid resistance zone (marked on the monthly chart) around 117.60-118.57. Nevertheless, we should keep in mind that there are negative divergences between the CCI, Stochastic Oscillator and the exchange rate, while the monthly RSI climbed to its highest level since Dec 2013, which suggests that a pause is just around the corner.
Very short-term outlook: bullish
Short-term outlook: mixed with bullish bias
MT outlook: bullish
LT outlook: bullish
Trading position (short-term; our opinion): No positions are justified from the risk/reward perspective at the moment. We will keep you informed should anything change, or should we see a confirmation/invalidation of the above.
USD/CAD
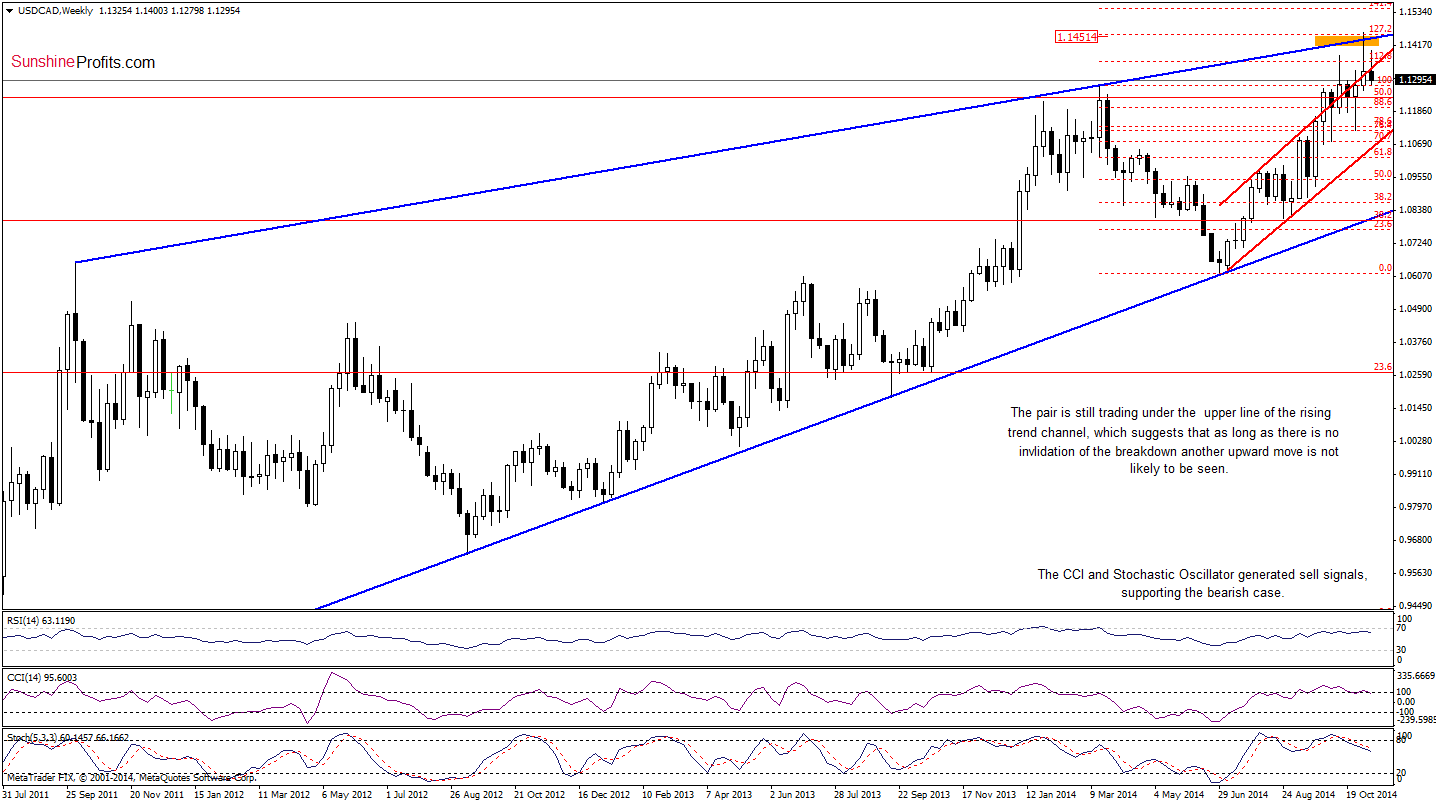
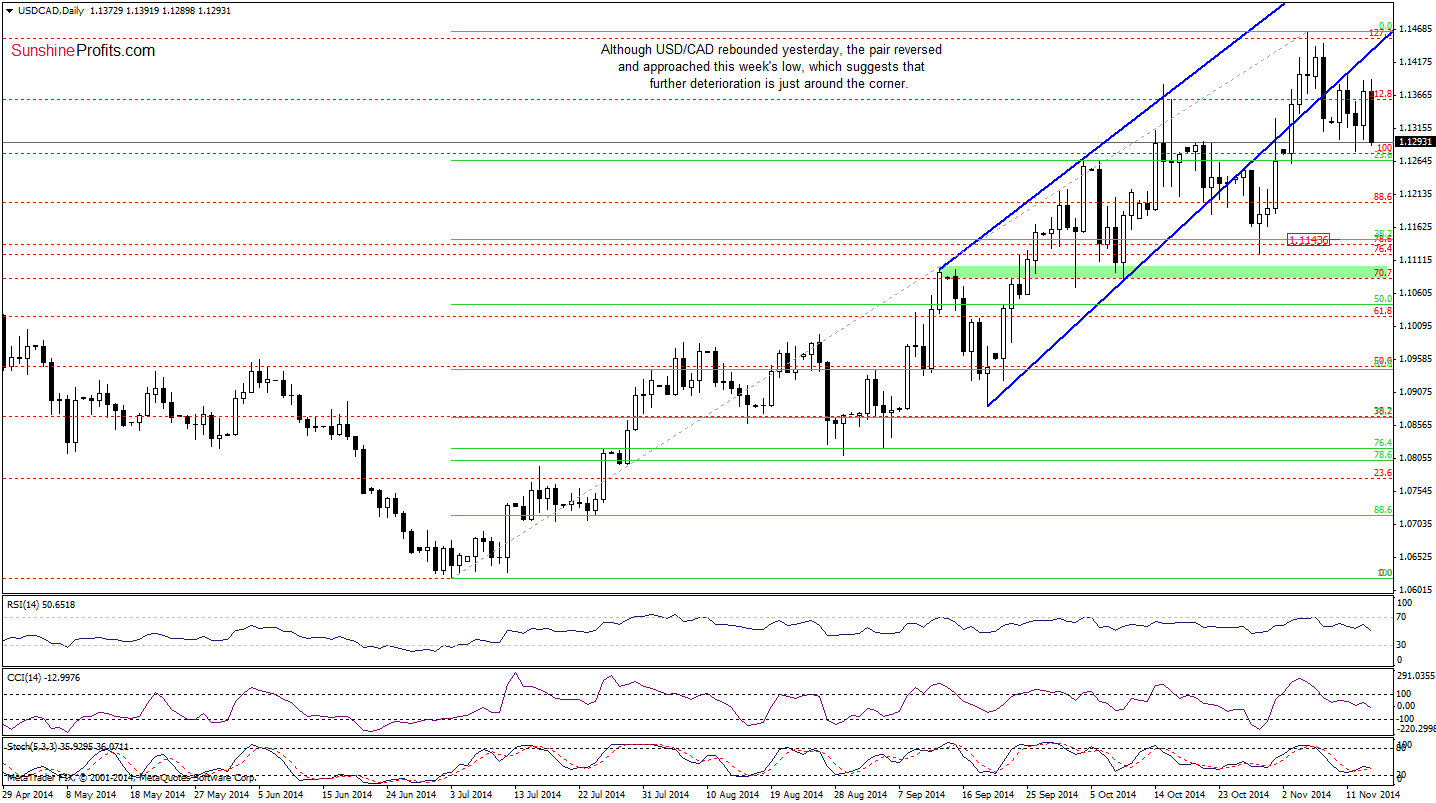
On the above charts, we see that the strong resistance zone created by the upper line of the rising trend channel (marked on the weekly chart) and the 127.2% Fibonacci extension still holds. Therefore, although USD/CAD moved higher yesterday, the pair reversed and decline today, approaching this week’s low. If we see a breakdown below 1.1279, we think that the exchange rate extend declines and the next downside target would be around 1.1142, where the 38.2% Fibonacci retracement (based on the entire Jul-Nov rally) is.
Very short-term outlook: mixed with bearish bias
Short-term outlook: mixed with bearish bias
MT outlook: mixed with bearish bias
LT outlook: bearish
Trading position (short-term; our opinion): No positions are justified from the risk/reward perspective at the moment. We will keep you informed should anything change, or should we see a confirmation/invalidation of the above.
USD/CHF
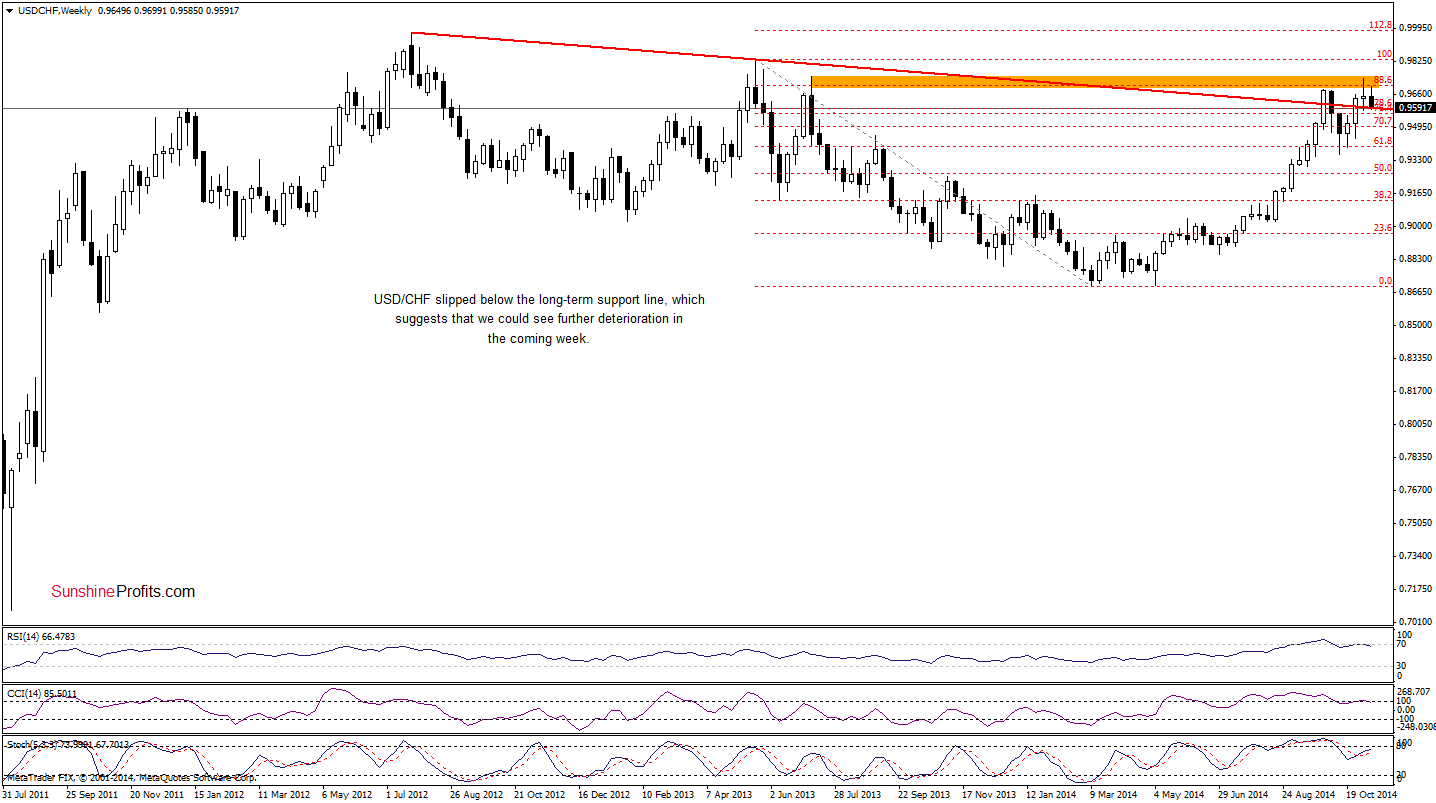
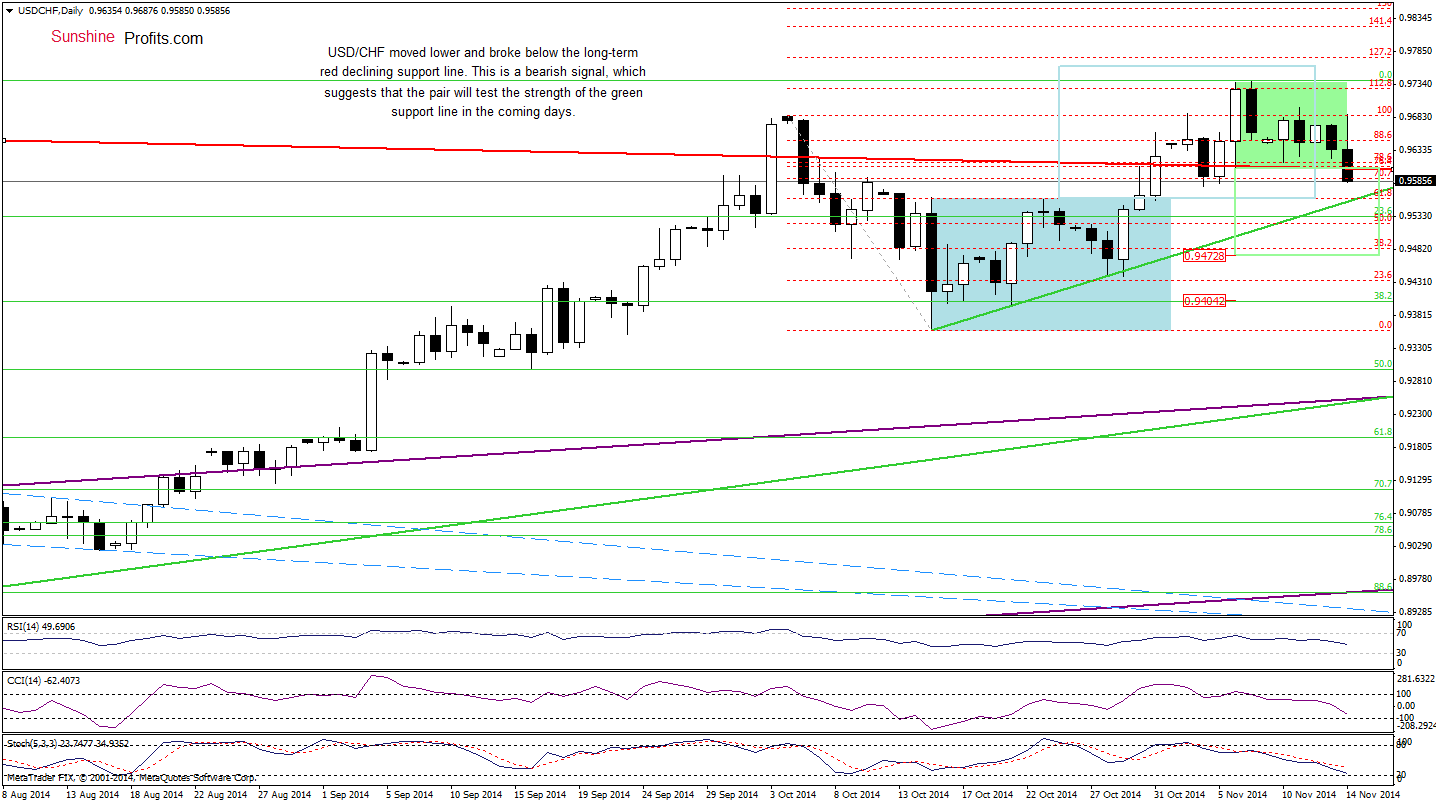
The overall situation has deteriorated earlier today as USD/CHF moved lower and broke below the key support – the long-term red line. This is a bearish signal (which will be even more bearish if the exchange rate closes the day below it), which suggests a test of the strength of the green support line seen on the daily chart (currently around 0.9555). Please note that the current position of the indicators supports the bearish case.
Very short-term outlook: bearish
Short-term outlook: mixed
MT outlook: bearish
LT outlook: bearish
Trading position (short-term; our opinion): No positions are justified from the risk/reward perspective at the moment. We will keep you informed should anything change, or should we see a confirmation/invalidation of the above.
AUD/USD
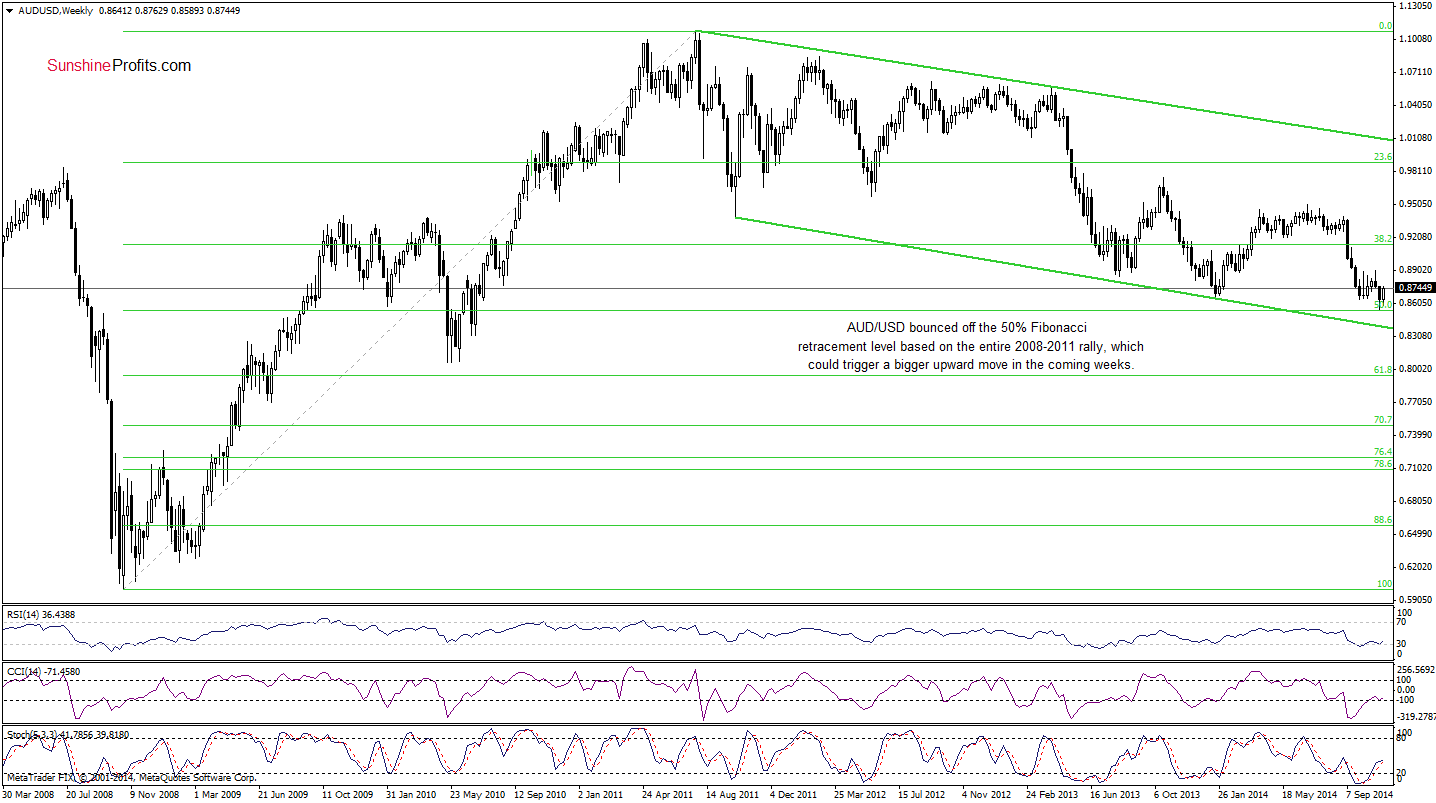
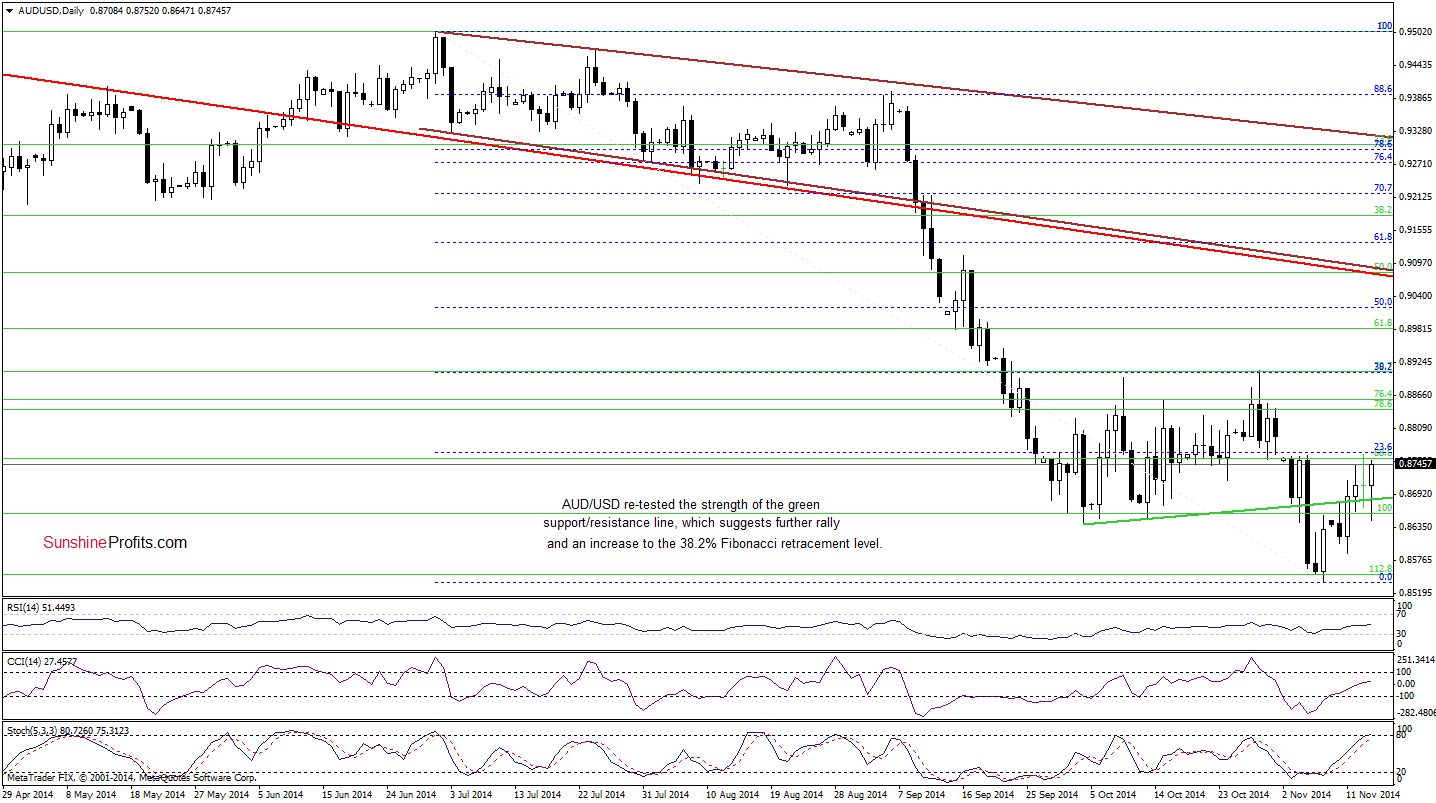
Looking at the above charts we see that although AUD/USD slipped below the green support line, the breakdown was invalidated almost immediately, which is a bullish signal, which suggests further improvement and an increase to the 38.2% Fibonacci retracement (around 0.8909) in the coming days. Please note that buy signals generated by the indicators remain in place, supporting the bullish case.
Very short-term outlook: bullish
Short-term outlook: mixed with bullish bias
MT outlook: mixed
LT outlook: bearish
Trading position (short-term): In our opinion, no positions are justified from the risk/reward perspective at the moment. We will keep you informed should anything change, or should we see a confirmation/invalidation of the above.
Thank you.
Nadia Simmons
Forex & Oil Trading Strategist
Przemyslaw Radomski, CFA
Founder, Editor-in-chief
Gold & Silver Trading Alerts
Forex Trading Alerts
Oil Investment Updates
Oil Trading Alerts

