
Earlier today, the Canadian dollar declined to its lowest level since Aug 2009 against the greenback as lower crude oil prices continued to pressure the Canadian currency. In this way, USD/CAD climbed above 1.1450 and reached a solid resistance zone. Will it stop further rally in the coming days?
In our opinion the following forex trading positions are justified - summary:
EUR/USD
Today, we’ll focus on the very short-term changes as the situation in the medium term remains almost unchanged.
Yesterday, we wrote:
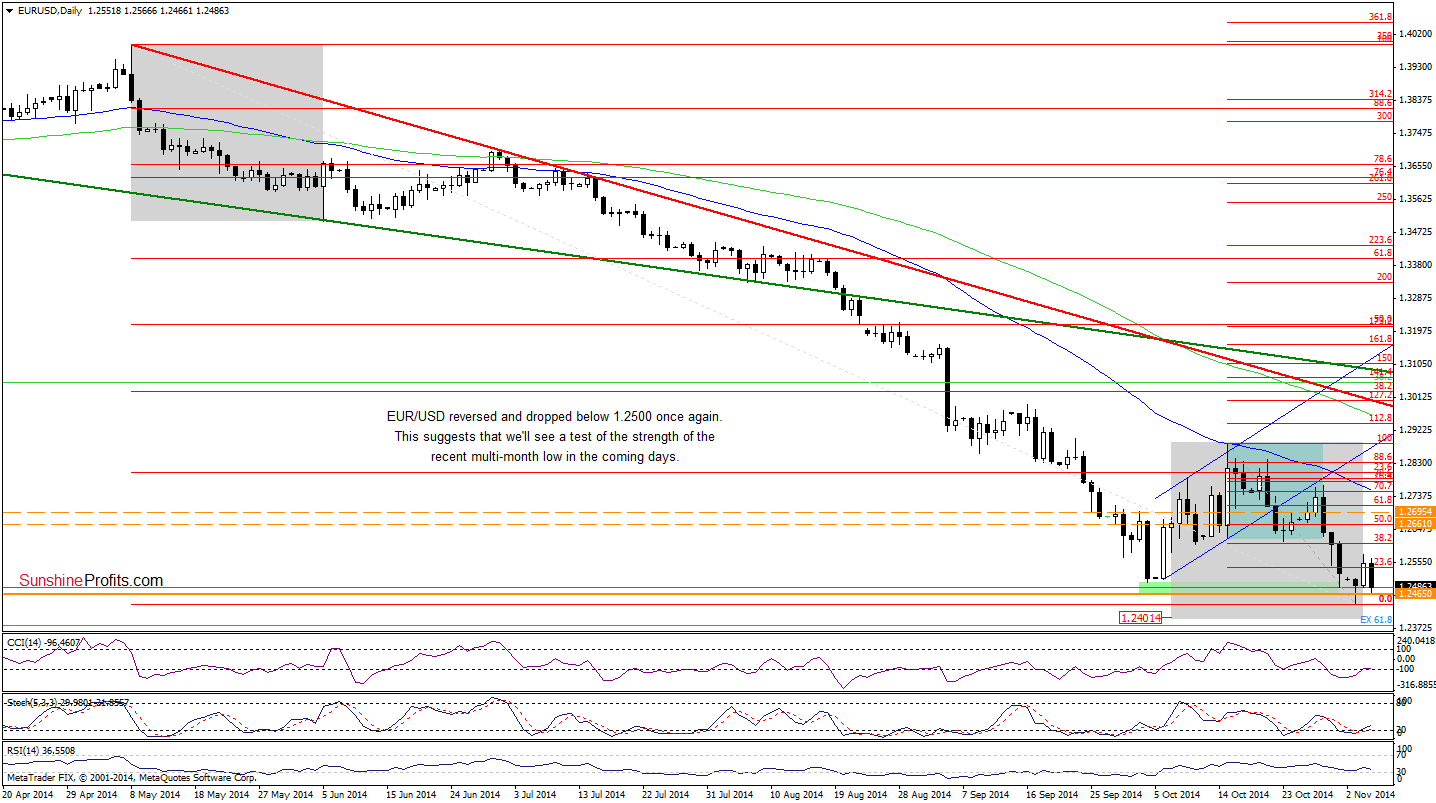
(…) EUR/USD bounced off a multi-month low, invalidating the breakdown below the recent lows. Although this is a bullish signal that suggests further improvement (…) we should keep in mind that as long as there is no weekly close above 1.2500, another downswing can’t be ruled out.
Looking at the above chart, we see that despite yesterday’s improvement, the exchange rate reversed and slipped under 1.2500 once again, which suggests that we’ll see a test of the strength of the recent low in the coming days. Will it withstand the selling pressure? At this point it’s worth quoting our Forex Trading Alert posted on Monday:
(…) we could see further deterioration and a drop to the support zone created by the 127.2% Fibonacci extension (based on the Apr 2013 low and the May 2014 high) and the psychological barrier of 1.2400. What’s interesting, when we factor in the Elliott wave theory and compare the current downward move (a potential wave 5) to the one that we saw in May (the first wave to the downside), we clearly see that they will be equal around 1.2401, which increases the probability of further declines.
Very short-term outlook: mixed with bearish bias
Short-term outlook: mixed
MT outlook: mixed
LT outlook: bearish
Trading position (short-term): In our opinion, no positions are justified from the risk/reward perspective at the moment. We will keep you informed should anything change, or should we see a confirmation/invalidation of the above.
USD/JPY
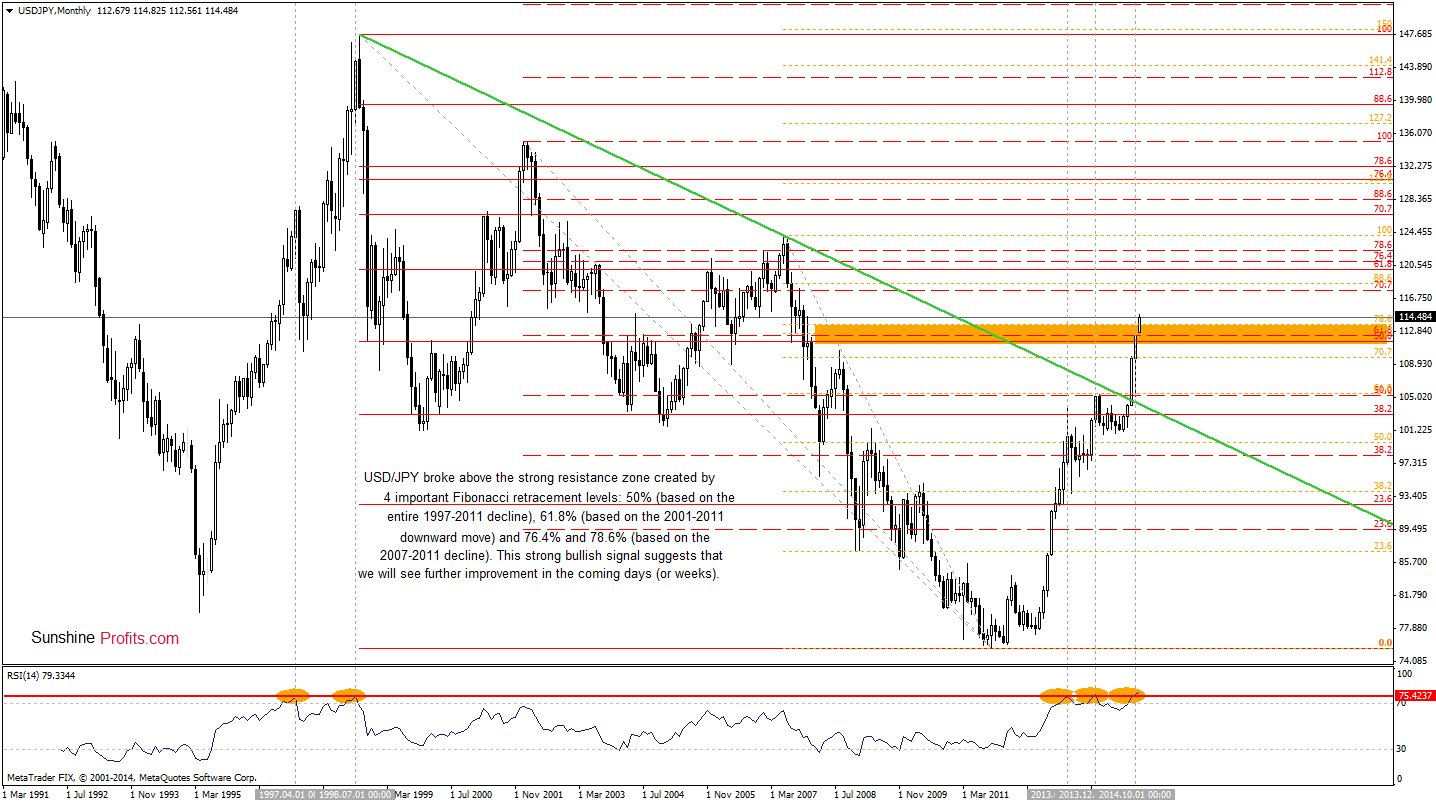
The first thing that catches the eye on the above chart is a breakout above the very strong resistance zone (marked with orange). Although it’s not confirmed, we think that such bullish development will trigger further rally. How high could the exchange rate go? Let’s take a look at the charts below and find out.
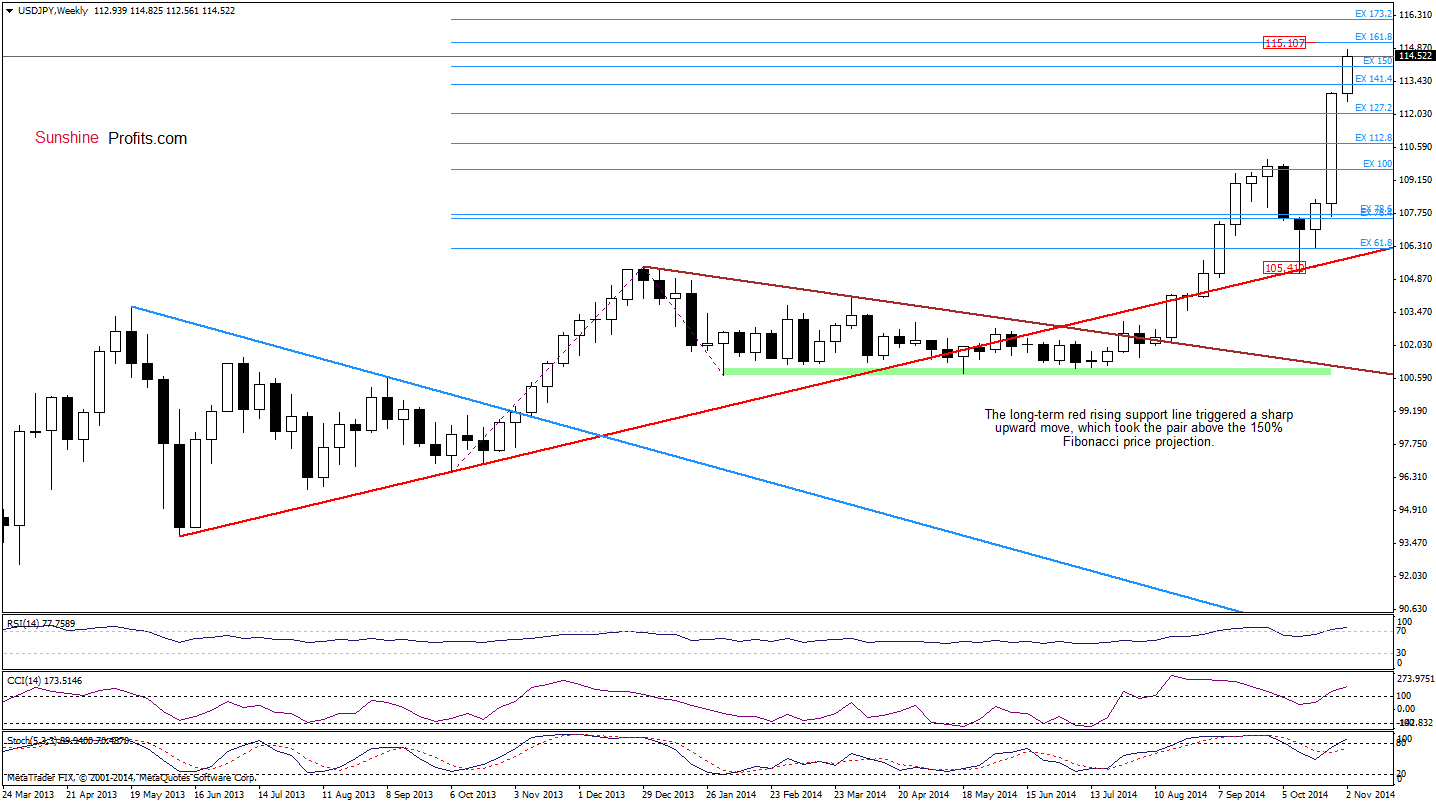
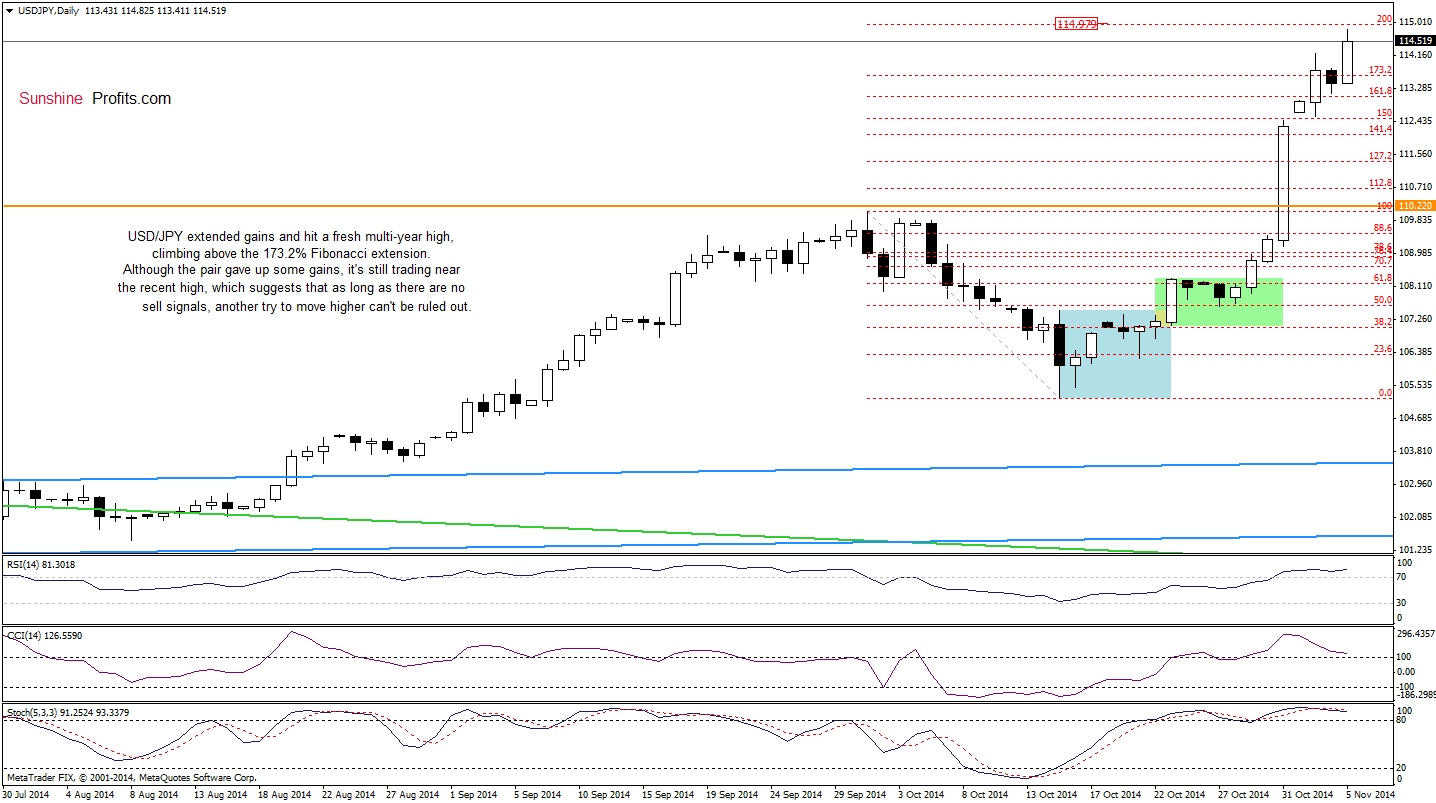
Looking at the above charts, we see that the initial upside target will be around 115-115.11, where the 200% Fibonacci extension based on the Oct correction (marked on the daily chart) and the 161.8% Fibonacci price projection based on the Oct 2013 and Feb 2014 lows and Dec 2013 high (seen on the weekly chart) are. If it’s broken the next target for currency bulls would be the 173.2% Fibonacci price projection around 116. Despite all these bullish signs, we should keep in mind that there are negative divergences between the CCI, Stochastic Oscillator and the exchange rate, while the monthly RSI climbed above the level of 75 (as a reminder, in the past such high reading of the indicator preceded bigger correcions), which suggests that a pause is just around the corner.
Very short-term outlook: bullish
Short-term outlook: mixed with bullish bias
MT outlook: bullish
LT outlook: bullish
Trading position (short-term; our opinion): No positions are justified from the risk/reward perspective at the moment. We will keep you informed should anything change, or should we see a confirmation/invalidation of the above.
USD/CAD
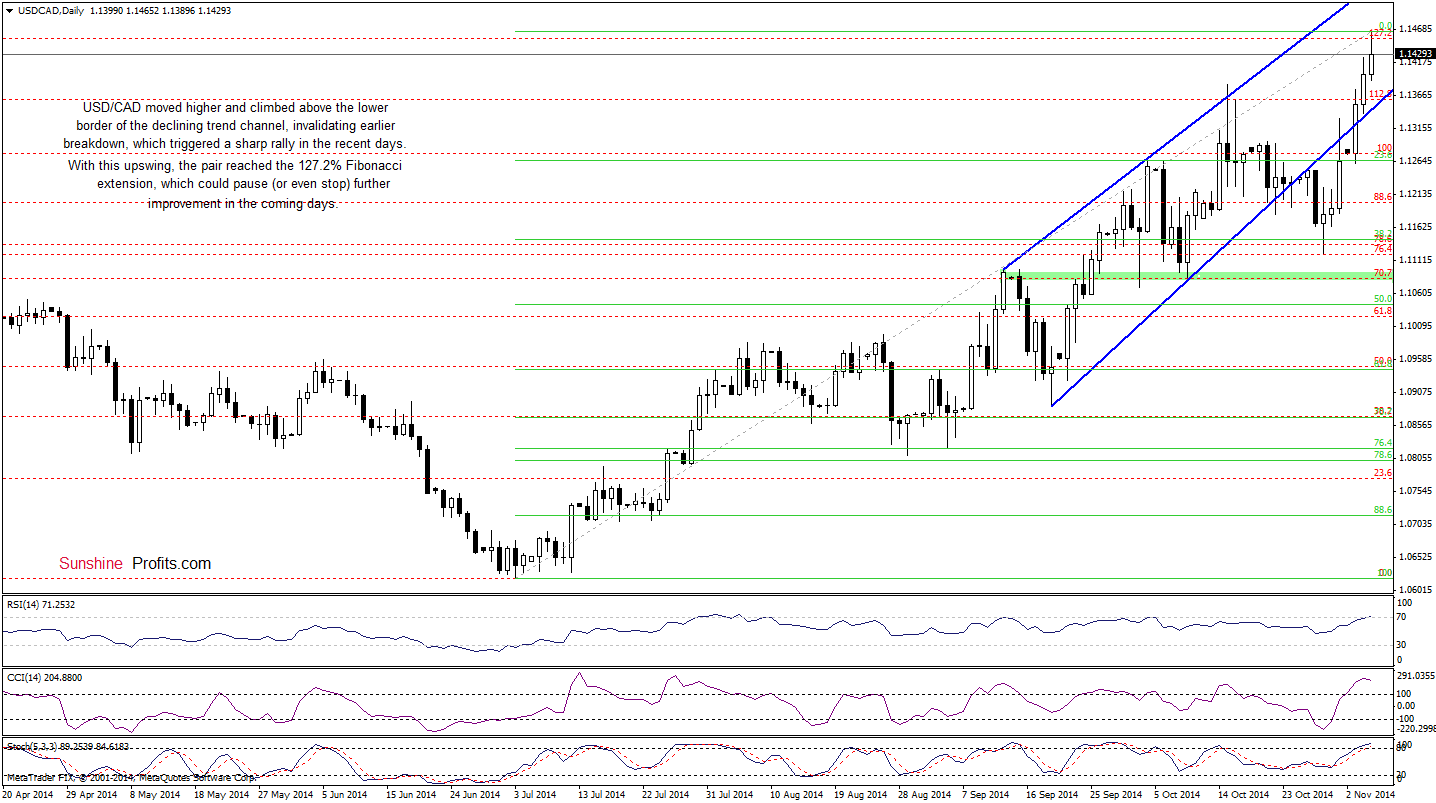
The most important event of the recent days was an invalidation of the breakdown below the lower border of the rising trend channel. This strong bullish signal triggered a sharp rally, which resulted in a fresh 2014 high. Will we see further rally? Let’s examine the weekly chart and look for clues.
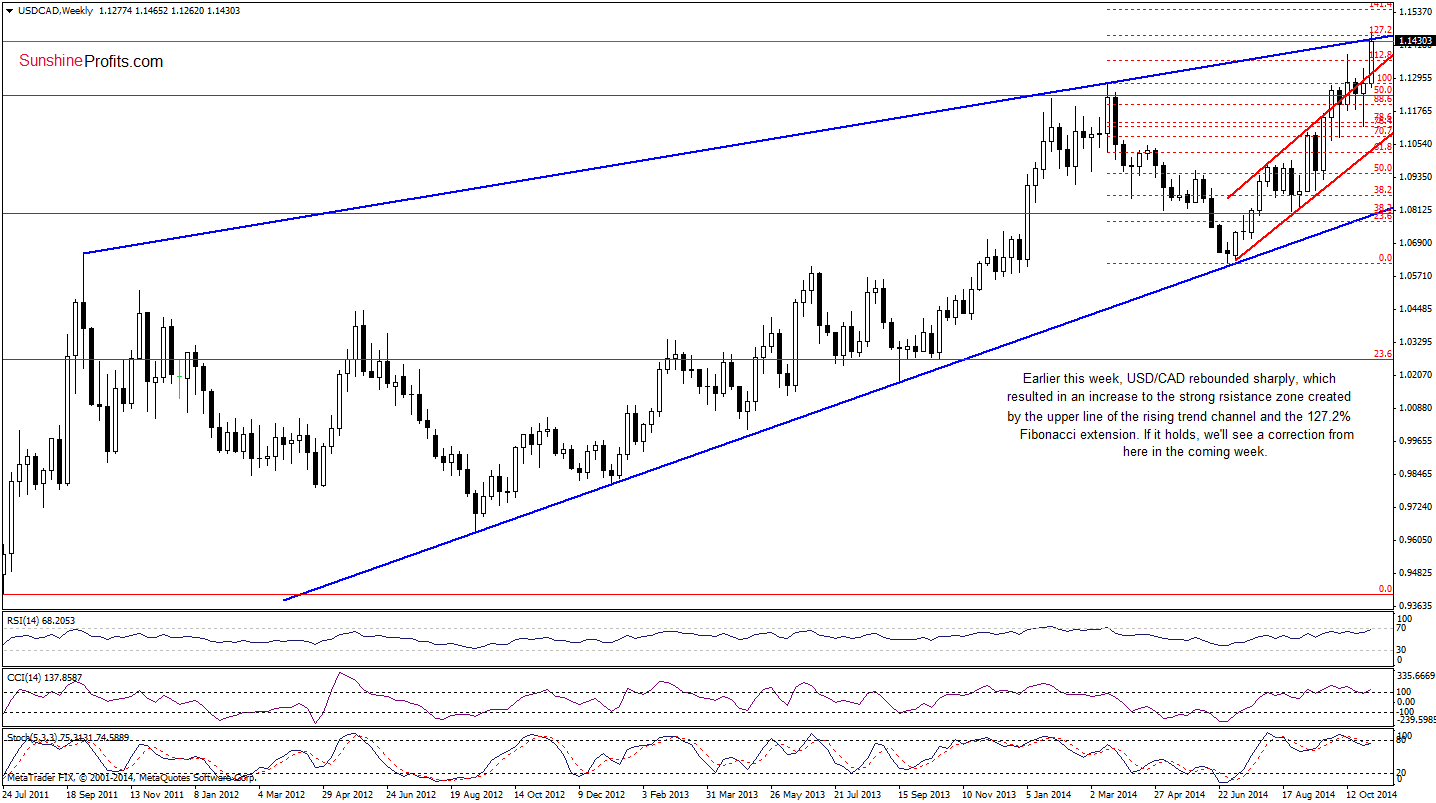
From this perspective, we see that the recent upward move took USD/CAD to the strong resistance zone created by the upper line of the rising trend channel and the 127.2% Fibonaci extension. In the previous month, the proximity to this area was enough to encourage crrency bears to act and trigger a correcion. Taking this fact into account and combining it with the current position of the indicators (in the medium and short term), we think that we’ll see another pullback from here in the coming days. If this is the case, the initial downside target would be around 1.1344, where the lower border of the rising trend channel (marked on the daily chart) is. If it’s broken, the next downside target would be around 1.1142, where the 38.2% Fibonacci retracement (based on the entire Jul-Nov rally) is.
Very short-term outlook: mixed with bearish bias
Short-term outlook: mixed with bearish bias
MT outlook: mixed with bearish bias
LT outlook: bearish
Trading position (short-term; our opinion): No positions are justified from the risk/reward perspective at the moment. We will keep you informed should anything change, or should we see a confirmation/invalidation of the above.
Thank you.
Nadia Simmons
Forex & Oil Trading Strategist
Przemyslaw Radomski, CFA
Founder, Editor-in-chief
Gold & Silver Trading Alerts
Forex Trading Alerts
Oil Investment Updates
Oil Trading Alerts

