
Although the British pound moved higher after data showed that the U.K. manufacturing PMI rose to 53.2 in October (beating analysts’ expectations for a drop to 51.2), the GBP/USD pair reversed and slipped below the long-term support/resistance line as U.S. dollar strengthened supported by upbeat manufacturing data. Where will the exchange rate head next?
In our opinion the following forex trading positions are justified - summary:
- EUR/USD: none
- GBP/USD: none
- USD/JPY: none
- USD/CAD: none
- USD/CHF: none
- AUD/USD: long (stop-loss order: 0.8587; initial price target: 0.8943)
EUR/USD
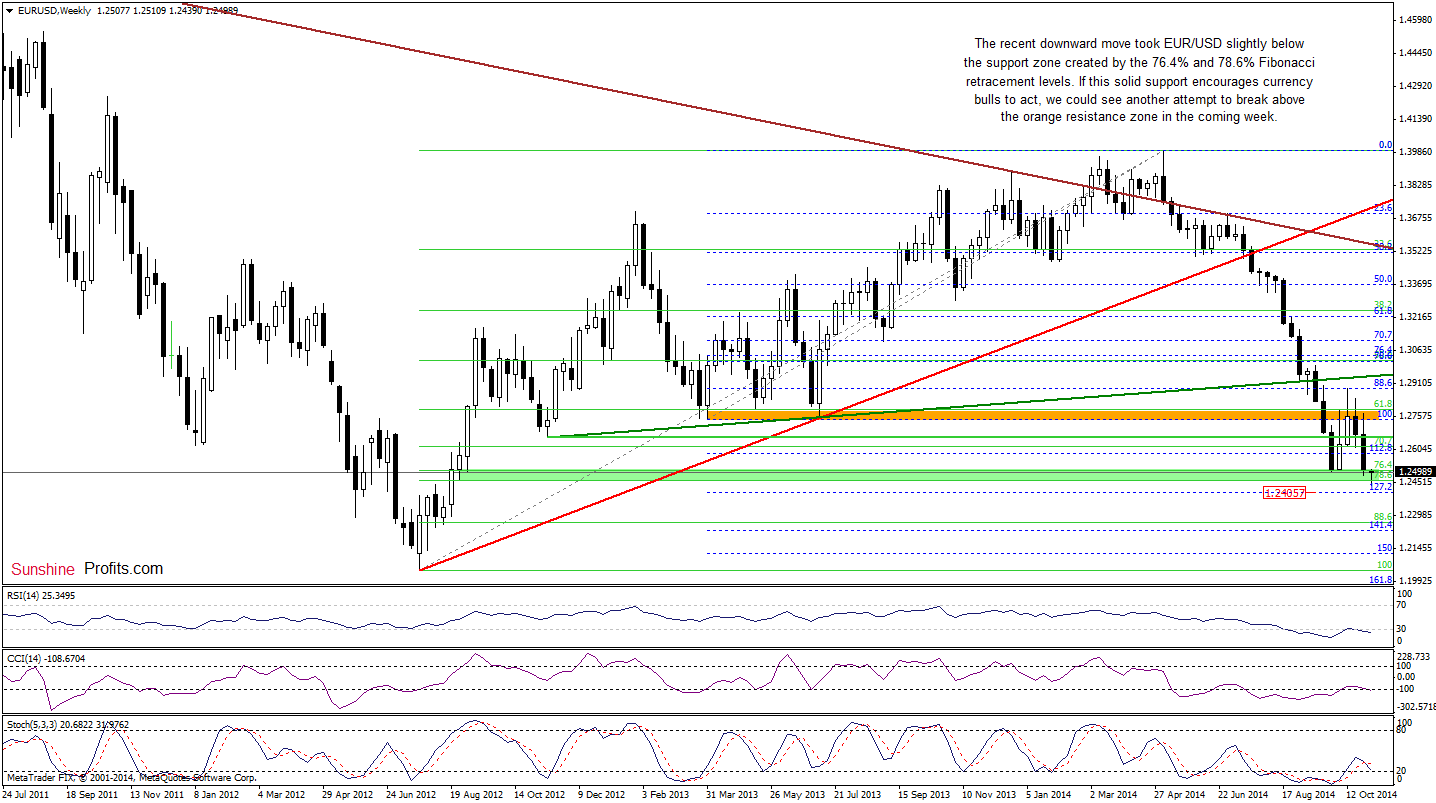
The situation in the medium term has deteriorated as EUR/USD extended losses and broke below the recent lows. With this downswing, the exchange rate also slipped under the support zone created by the 76.4% and 78.6% Fibonacci retracement levels, which is a negative signal that suggests a drop to the 127.2% Fibonacci extension (based on the Apr 2013 low and the May 2014 high) around 1.2406. Nevertheless, if currency bulls manage to invalidate the breakdown, we could see another attempt to break above the orange resistance zone. Which scenario is more likely at the moment? Let’s examine the daily chart and look for more clues about future moves.
In our Forex Trading Alert posted on Thursday, we wrote the following:
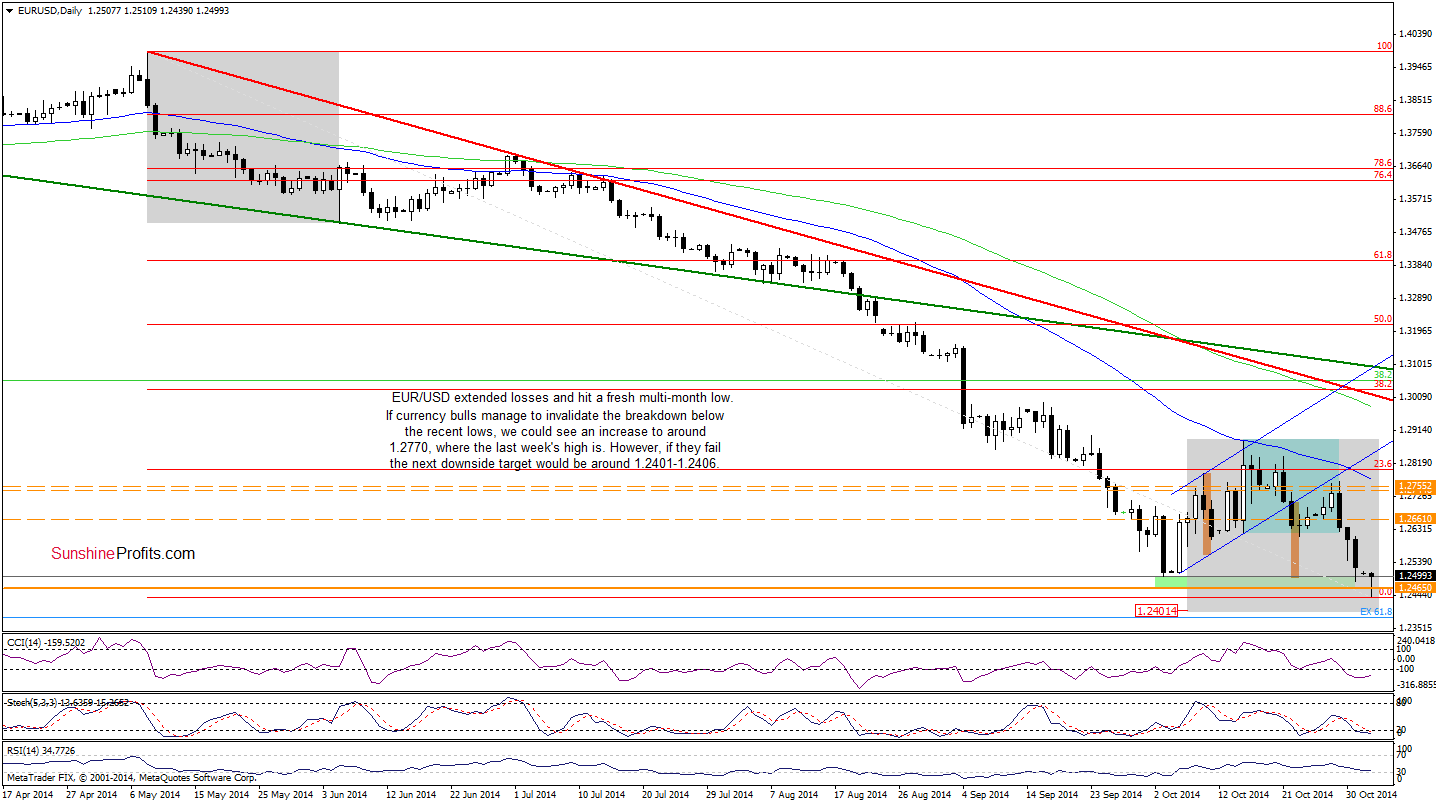
(…) the lower border of the rising trend channel in combination with the orange resistance zone (marked on the weekly chart) successfully stopped the rally, triggering a sharp decline. In this way, the breakdown was verified, which is a bearish signal that suggests a test of the recent lows – especially when we factor in a breakdown below the lower border of the consolidation (marked with blue).
As you on the above chart, currency bears not realized the above-mentioned scenario (as we expected), but also pushed EUR/USD to a fresh multi-month low of 1.2439 earlier today. Although the exchange rate rebounded in the following hours, the pair is still trading under the recent lows. Therefore, as long as there is no comeback above 1.2500, today’s upswing is nothing more than a verification of the breakdown. If this is the case, and the pair declines from here, we could see further deterioration and a drop to the support zone created by the 127.2% Fibonacci extension (based on the Apr 2013 low and the May 2014 high) and the psychological barrier of 1.2400. What’s interesting, when we factor in the Elliott wave theory and compare the current downward move (a potential wave 5) to the one that we saw in May (the first wave to the downside), we clearly see that they will be equal around 1.2401, which increases the probability of further declines.
Very short-term outlook: mixed with bearish bias
Short-term outlook: mixed
MT outlook: mixed
LT outlook: bearish
Trading position (short-term): In our opinion, no positions are justified from the risk/reward perspective at the moment. We will keep you informed should anything change, or should we see a confirmation/invalidation of the above.
GBP/USD
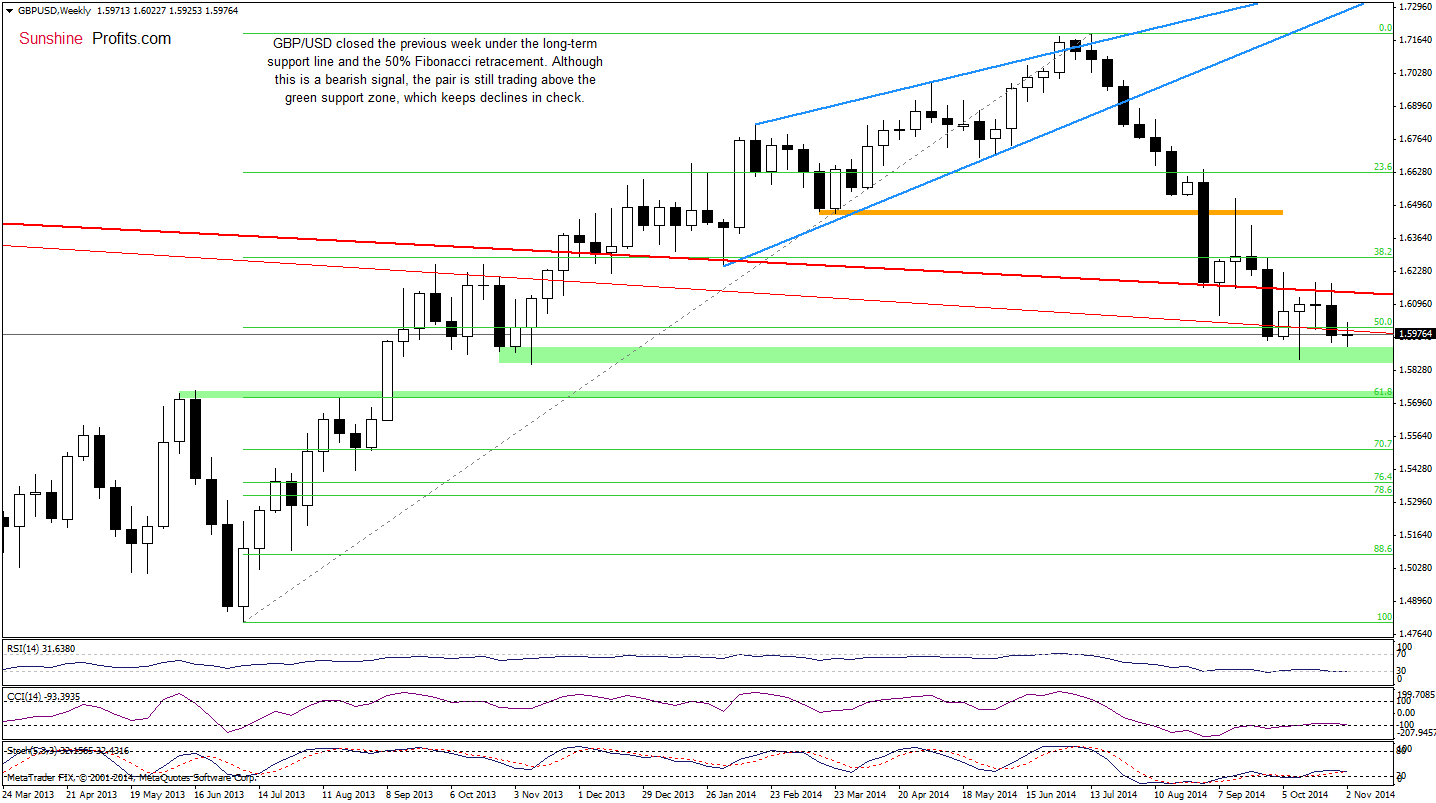
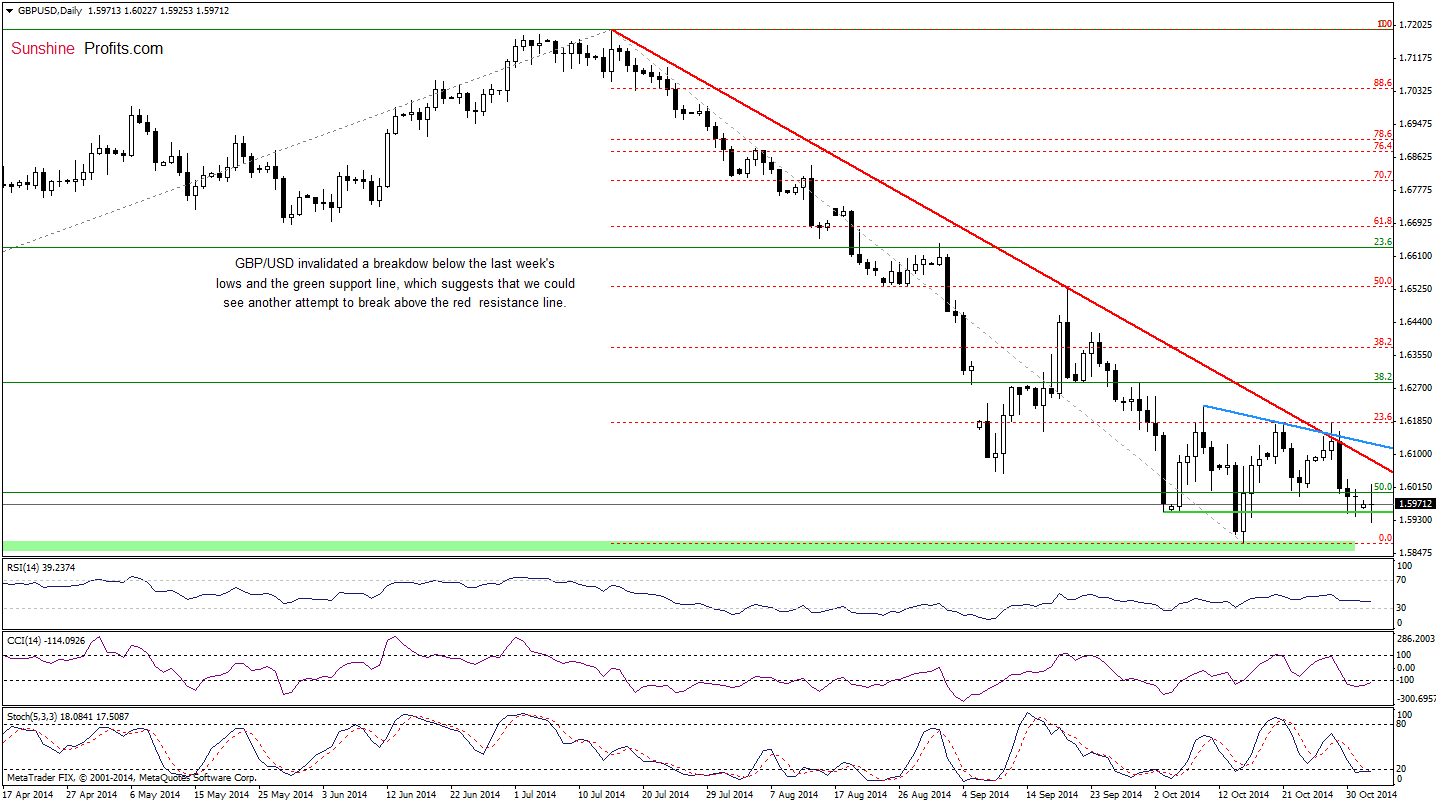
On the daily chart, we see that GBP/USD invalidated the breakdown below the support area created by the Oct 3, Oct 6 and Oct 16 lows earlier today. This bullish signal suggest that we could see another attempt to break above the red declining resistance line, but will the pair move higher from here in the nearest future? Looking at the weekly chart, we see that the exchange rate closed the previous week under the long-term support line, which signifies to us that as long as there is no invalidation of the breakdown below this key line further improvement is questionable.
Very short-term outlook: mixed
Short-term outlook: mixed
MT outlook: mixed
LT outlook: mixed
Trading position (short-term): In our opinion, no positions are justified from the risk/reward perspective at the moment. We will keep you informed should anything change, or should we see a confirmation/invalidation of the above.
USD/CAD
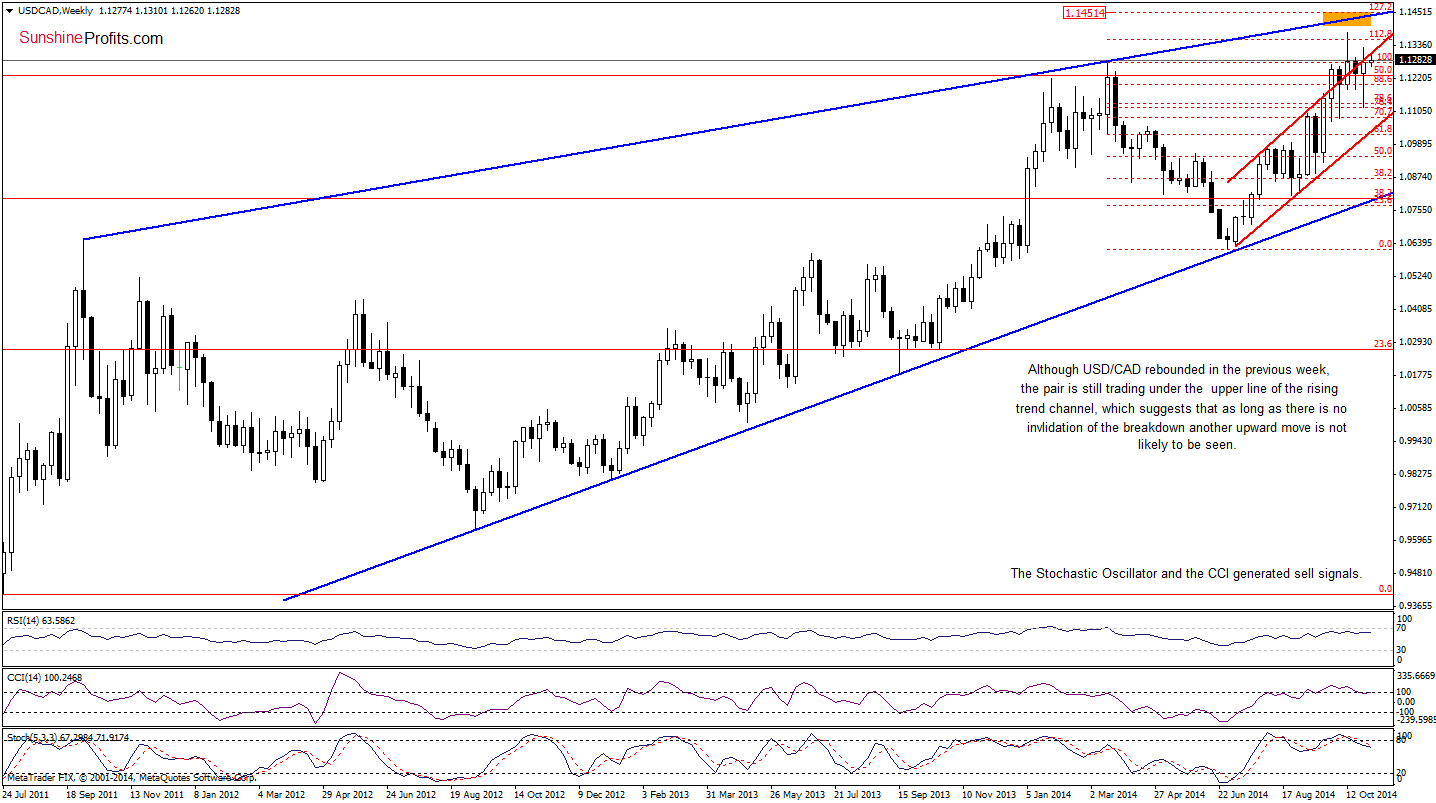
Although USD/CAD rebounded in the previous week, the medium-term picture hasn’t changed much as the pair is still trading under the upper line of the rising trend channel, which keeps gains in check.
Having say that, let’s move on to the daily chart.
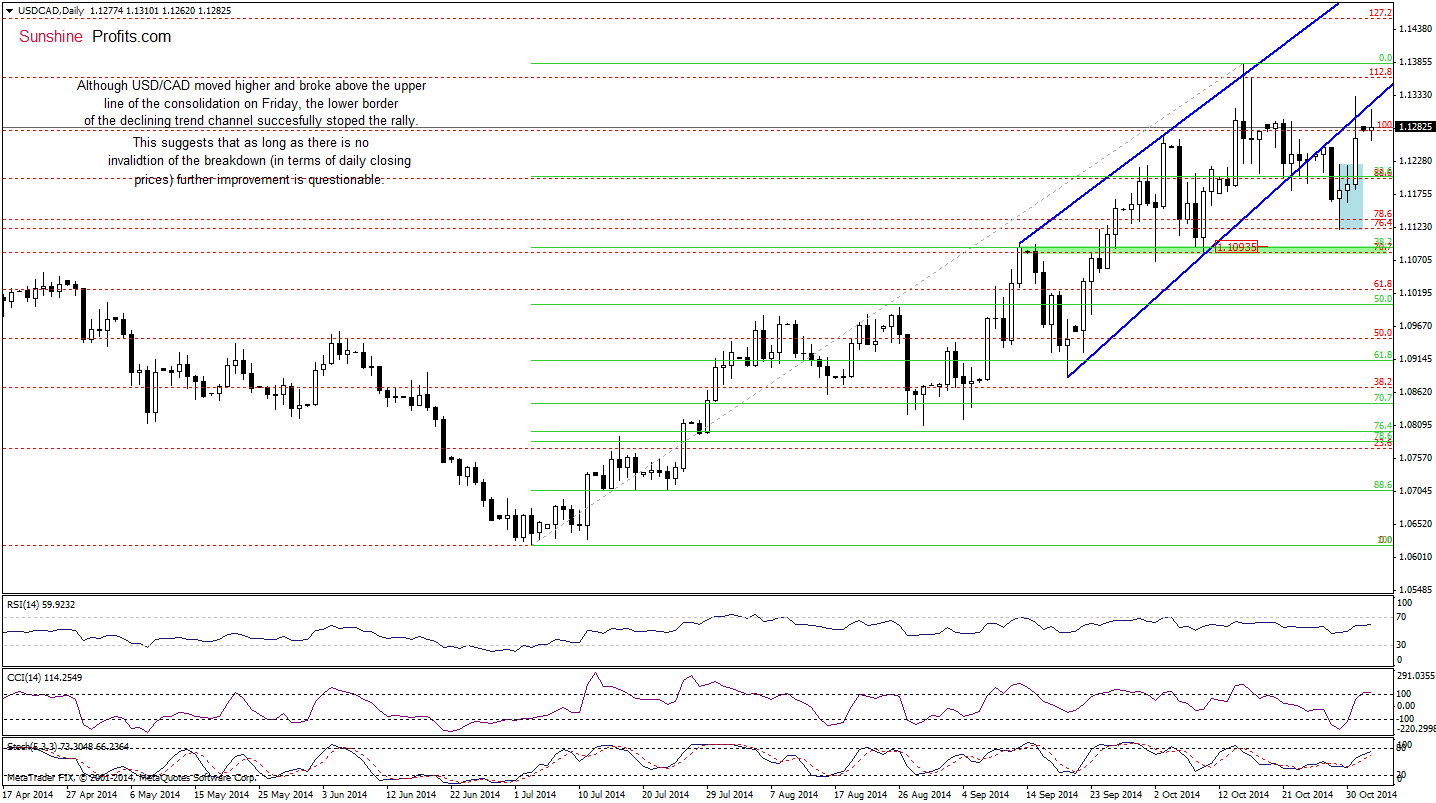
Quoting our last commentary on this currency pair:
(…) If currency bulls push the pair higher, we’ll see an attempt to invalidate the breakdown bellow the lower border of the rising trend channel (currently around 1.1292).
Looking at the daily chart, we see that although the exchange rate moved higher and broke above the upper line of the consolidation on Friday, the lower border of the rising trend channel succesfully stopped further rally. As a result, USD/CAD declined and is still trading under this key resistance line. Taking into acount the size of the pullback and buy signals generated by the indicators, it seems that another try to invalidate the breakdown should not surprise us. Nevertheless, as long as there is no invalidation of the breakdown under the upper line of the rising trend channel (marked on the weekly chart), another sizable upward move is not likely to be seen.
Very short-term outlook: mixed
Short-term outlook: mixed
MT outlook: mixed with bearish bias
LT outlook: bearish
Trading position (short-term; our opinion): No positions are justified from the risk/reward perspective at the moment. We will keep you informed should anything change, or should we see a confirmation/invalidation of the above.
Thank you.
Nadia Simmons
Forex & Oil Trading Strategist
Przemyslaw Radomski, CFA
Founder, Editor-in-chief
Gold & Silver Trading Alerts
Forex Trading Alerts
Oil Investment Updates
Oil Trading Alerts

