
Yesterday, the Commerce Department reported that U.S. gross domestic product grew at an annual rate of 3.5% in the three months to September, beating forecast for 3%. Thanks to these bullish numbers, the USD Index, which tracks the performance of the U.S. dollar against a basket of six major currencies climbed above 86.50. Earlier today, the index extended gains, hitting a fresh multi-month high of 87.08. How did this rally affected the picture of major currency pairs?
In our opinion the following forex trading positions are justified - summary:
- EUR/USD: none
- GBP/USD: none
- USD/JPY: none
- USD/CAD: none
- USD/CHF: none
- AUD/USD: long (stop-loss order: 0.8587; initial price target: 0.8943)
EUR/USD
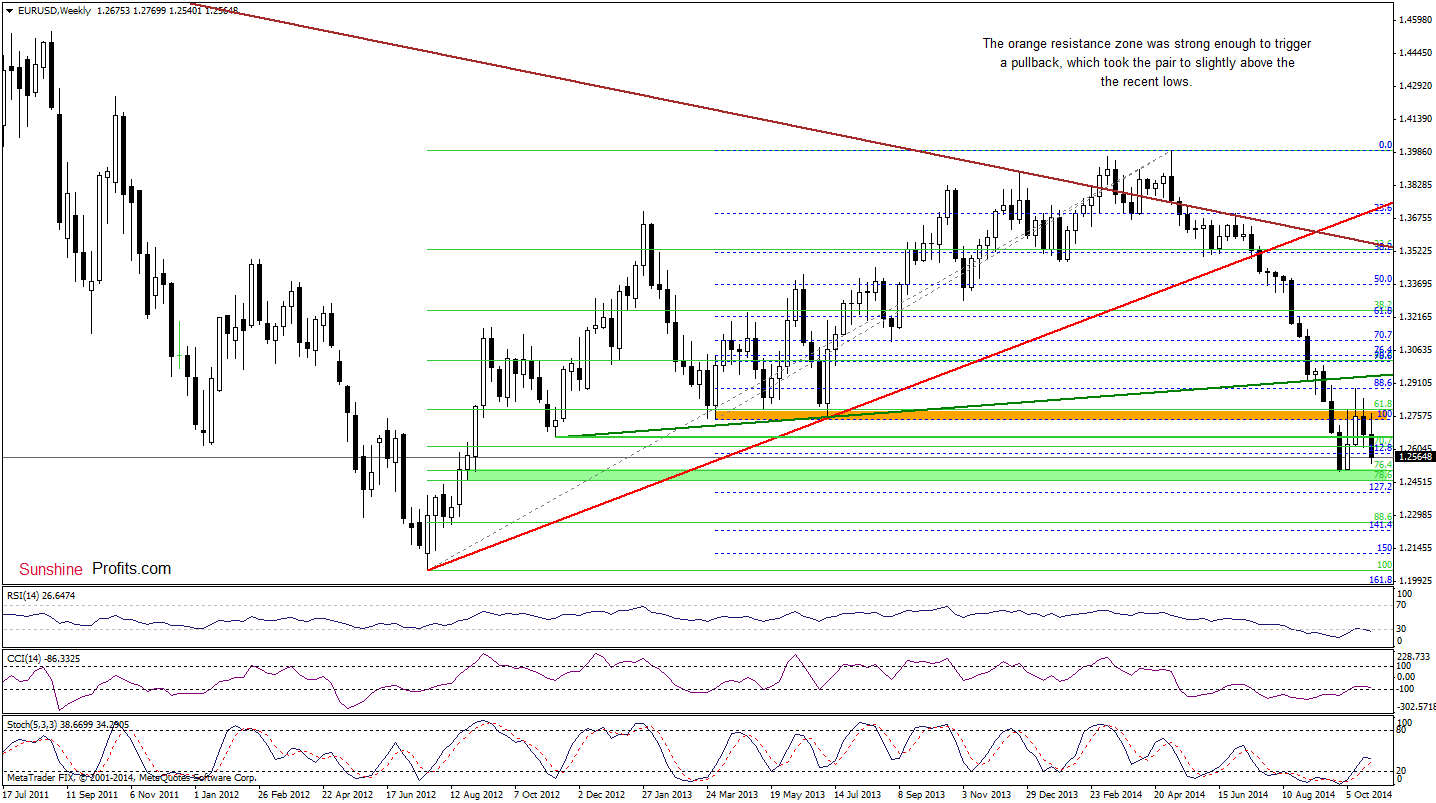
The situation in the medium term has deteriorated as currency bulls didn’t manage to push EUR/USD above the orange resistance zone (created by the Apr and Jul 2013 lows and the 61.8% Fibonacci retracement), which triggered a sharp decline that took the exchange rate to slightly above the recent lows. Will we see further deterioration? Let’s take a closer look at the daily chart and find out.
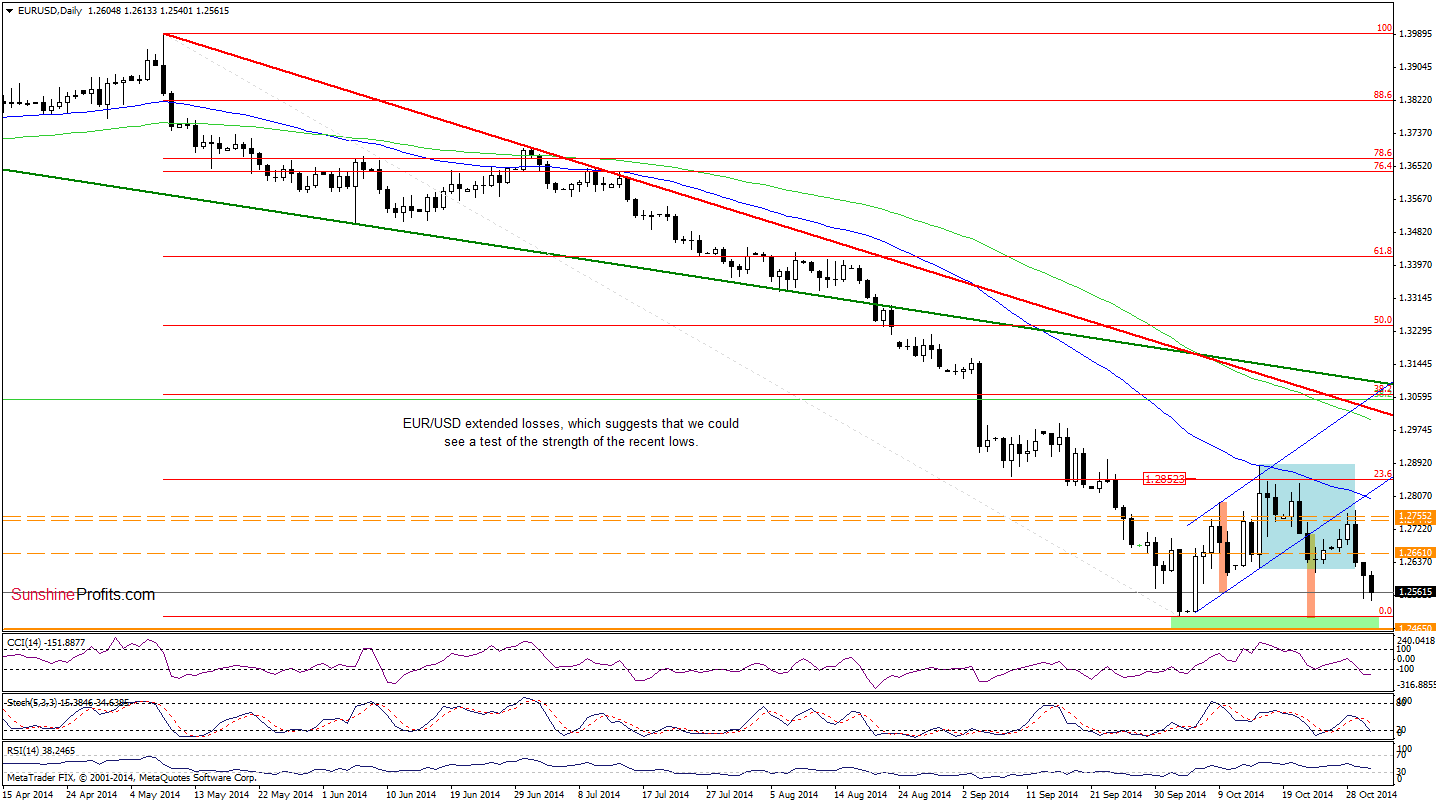
Looking at the above chart, we see that EUR/USD moved lower earlier today, which means that what we wrote yesterday is up-to-date:
(…) the lower border of the rising trend channel in combination with the orange resistance zone (marked on the weekly chart) successfully stopped the rally, triggering a sharp decline. In this way, the breakdown was verified, which is a bearish signal that suggests a test of the recent lows – especially when we factor in a breakdown below the lower border of the consolidation (marked with blue).
Very short-term outlook: mixed
Short-term outlook: mixed
MT outlook: mixed
LT outlook: bearish
Trading position (short-term): In our opinion, no positions are justified from the risk/reward perspective at the moment. We will keep you informed should anything change, or should we see a confirmation/invalidation of the above.
GBP/USD
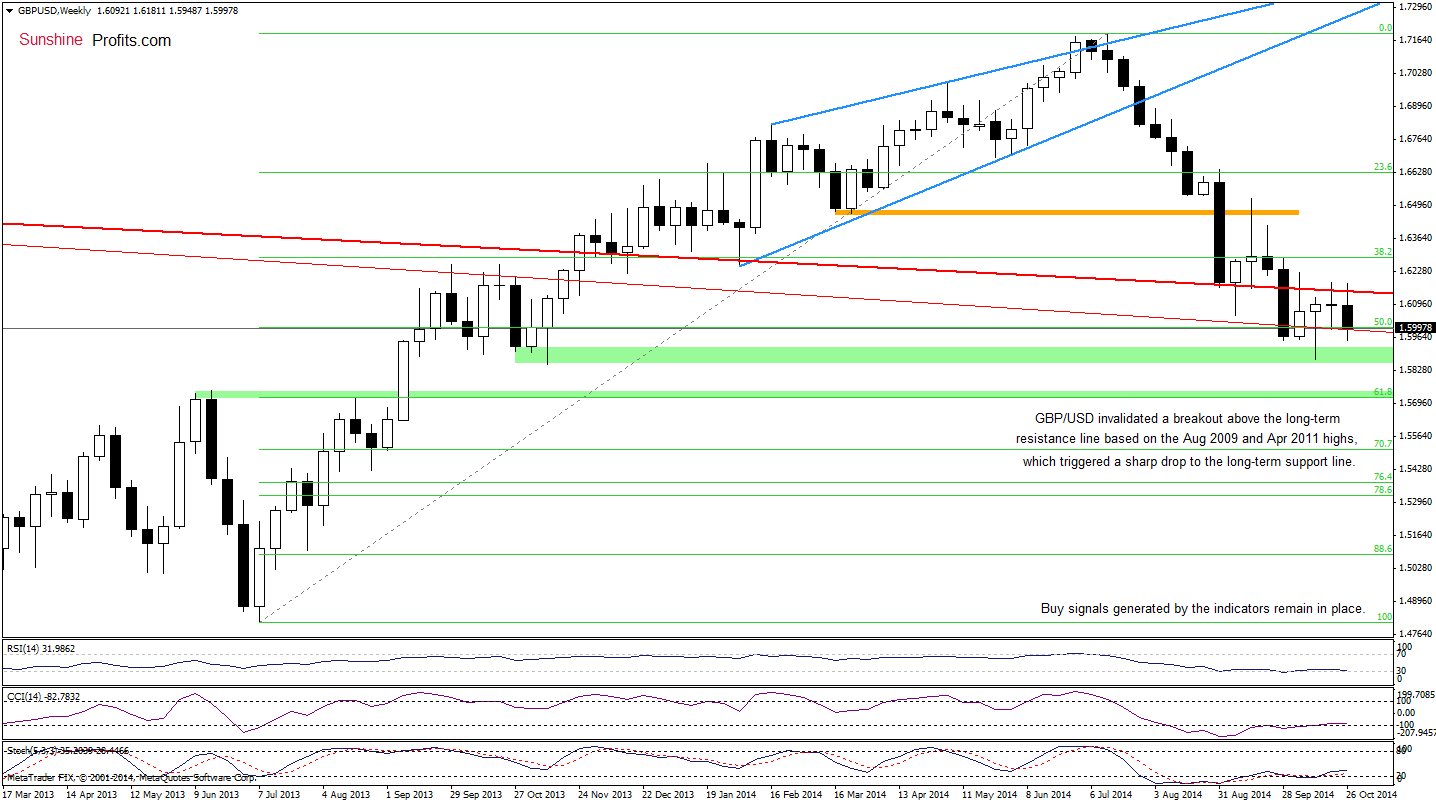
The medium-term picture has deteriorated as GBP/USD invalidated the breakout above the long-term resistance line based Aug 2009 and Apr 2011 highs. This bearish signal triggered a sharp pullback, which took the exchange rate to the key support line based on Apr 2011 and Dec 2012 highs and supported by the 50% Fibonacci retracement. If this area withstand the selling pressure, we’ll see another attempt to break above the key resistance line. However, if currency bulls fail, we could see another test of the strength of the green support one based on the Oct and Nov 2013 lows.
Once we know the situation in the medium-term, let’s take a look at the daily chart.
In our last commentary on this currency pair, we wrote:
(…) We do not recommend opening long position at the moment as the breakout is not confirmed
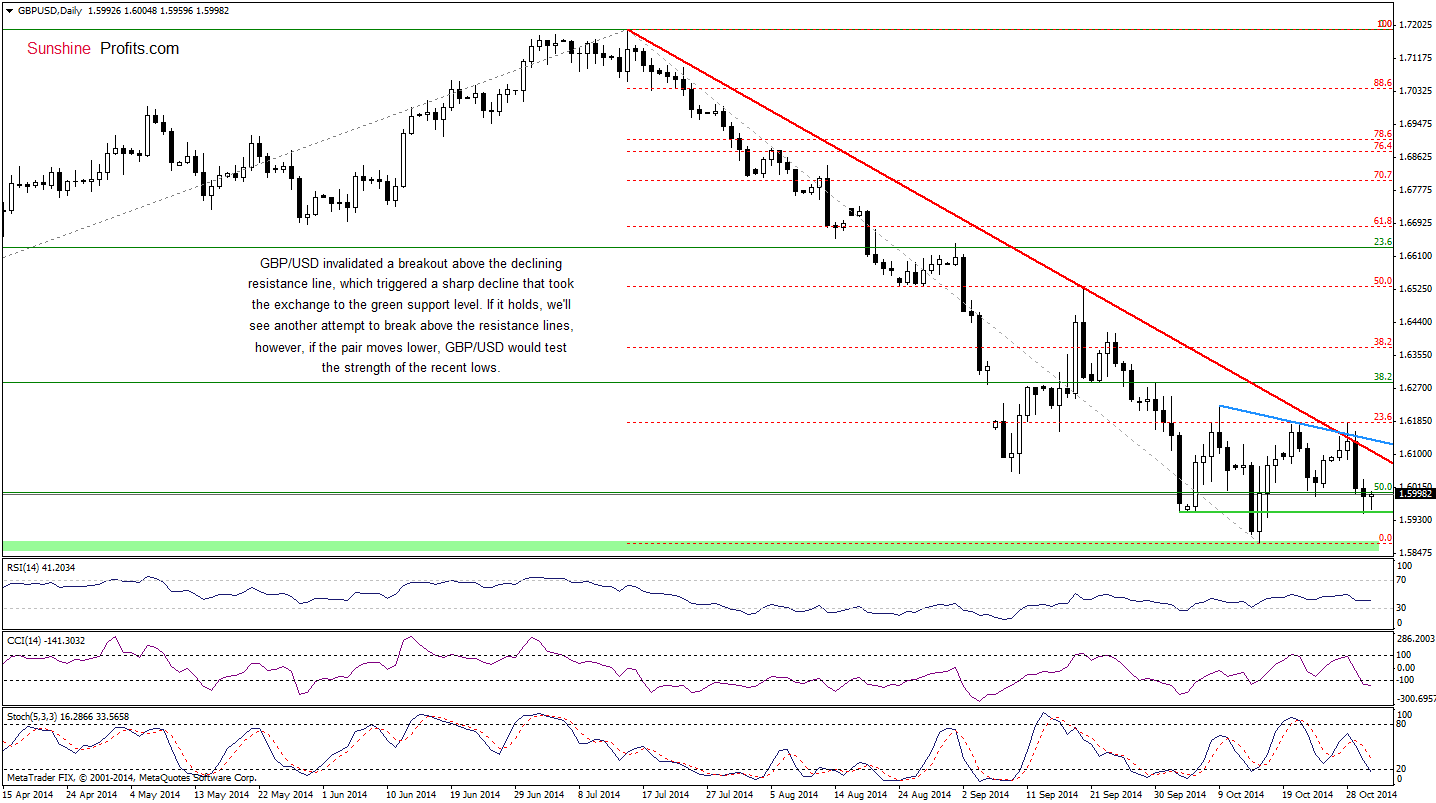
As you see on the above chart, this decision was the right one, because GBP/USD invalidated the breakout above the red and blue declining resistance lines. This strong bearish signal triggered a sharp decline, which took the exchange rate to the support area created by the Oct 3, Oct 6 and Oct 16 lows. If it holds, we’ll see another attempt to break above the red declining resistance line. However, if it’s broken, the pair will test the recent low. Which scenario is more likely at the moment? When we take a closer look at the position of the daily indicators, we clearly see that sell signals remain in place, supporting the bearish case. Taking this fact into account, we think that the next move will be to the downside.
Very short-term outlook: bearish
Short-term outlook: mixed with bearish bias
MT outlook: mixed
LT outlook: mixed
Trading position (short-term): In our opinion, no positions are justified from the risk/reward perspective at the moment. We will keep you informed should anything change, or should we see a confirmation/invalidation of the above.
USD/JPY
Quoting our yesterday’s Forex Trading Alert:
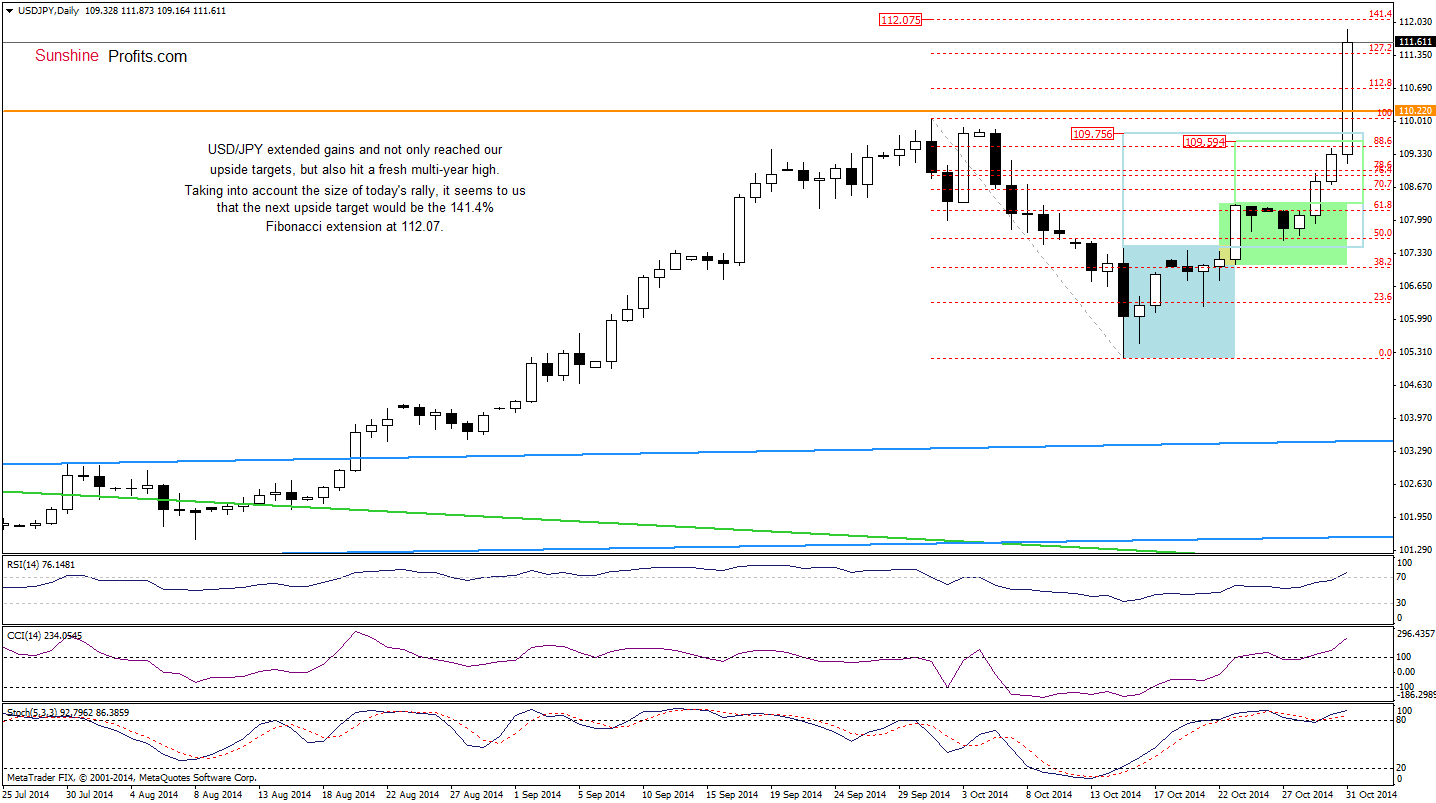
(…) after several days in a consolidation range (marked with green), USD/JPY moved higher once again, breaking above the upper line of the formation. This is a positive signal, which suggests further improvement to 109.59 or even to 109.75, where the size of the upward move will correspond to the height of the green or blue consolidation.
The above chart clearly shows that currency bulls not only realized the above scenario as we expected, but also pushed the pair well above the recent high. In this way, USD/JPY broke above the 127.2% Fibonacci extension, which suggests that the next upside target will be around 112.07, where the next short-term resistance is.
How much room for further rally does the pair have?
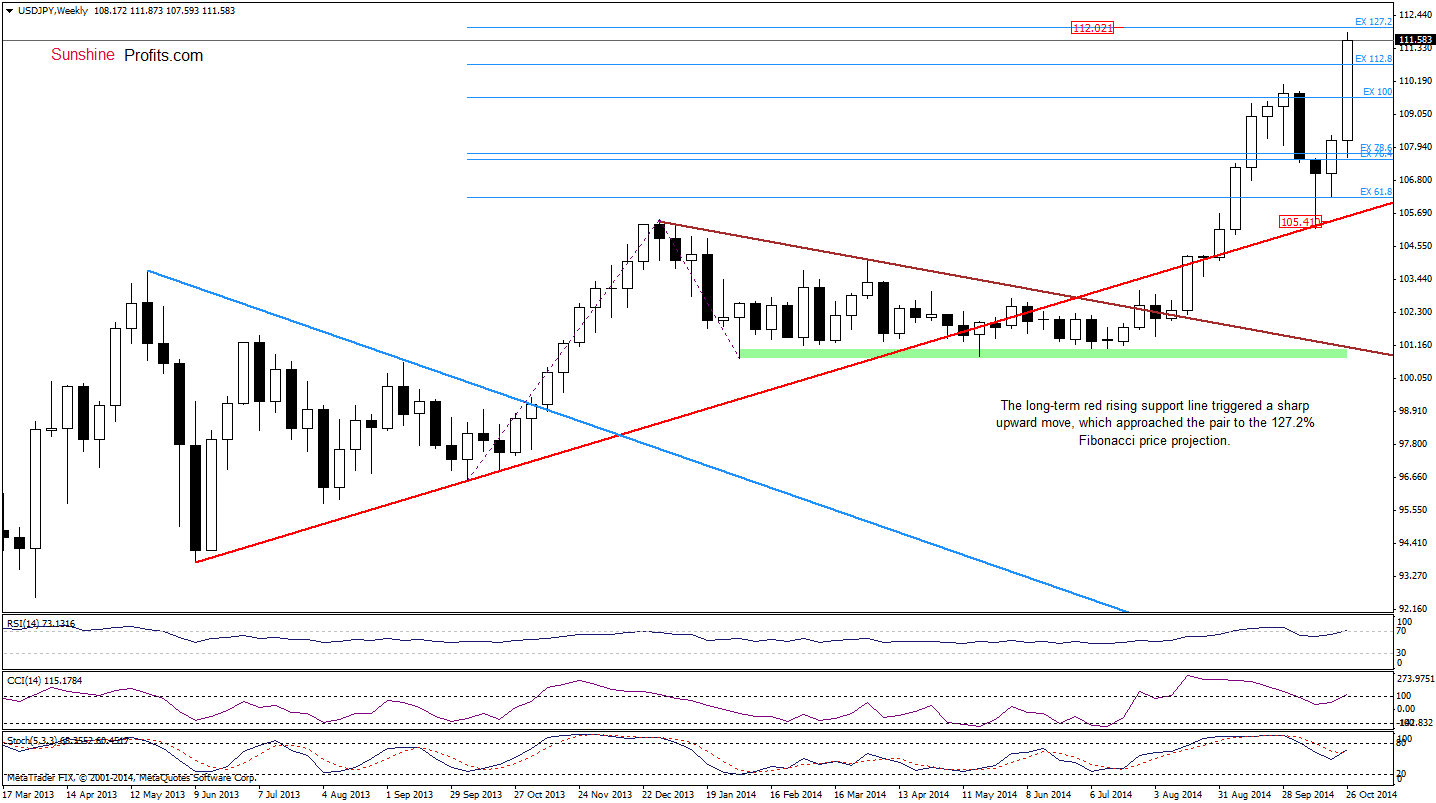
As you see on the weekly chart, the nearest resistance is the 127.2% Fibonacci price projection based on the Oct 2013 and Feb 2014 lows and Dec 2013 high. Will it stop further rally?
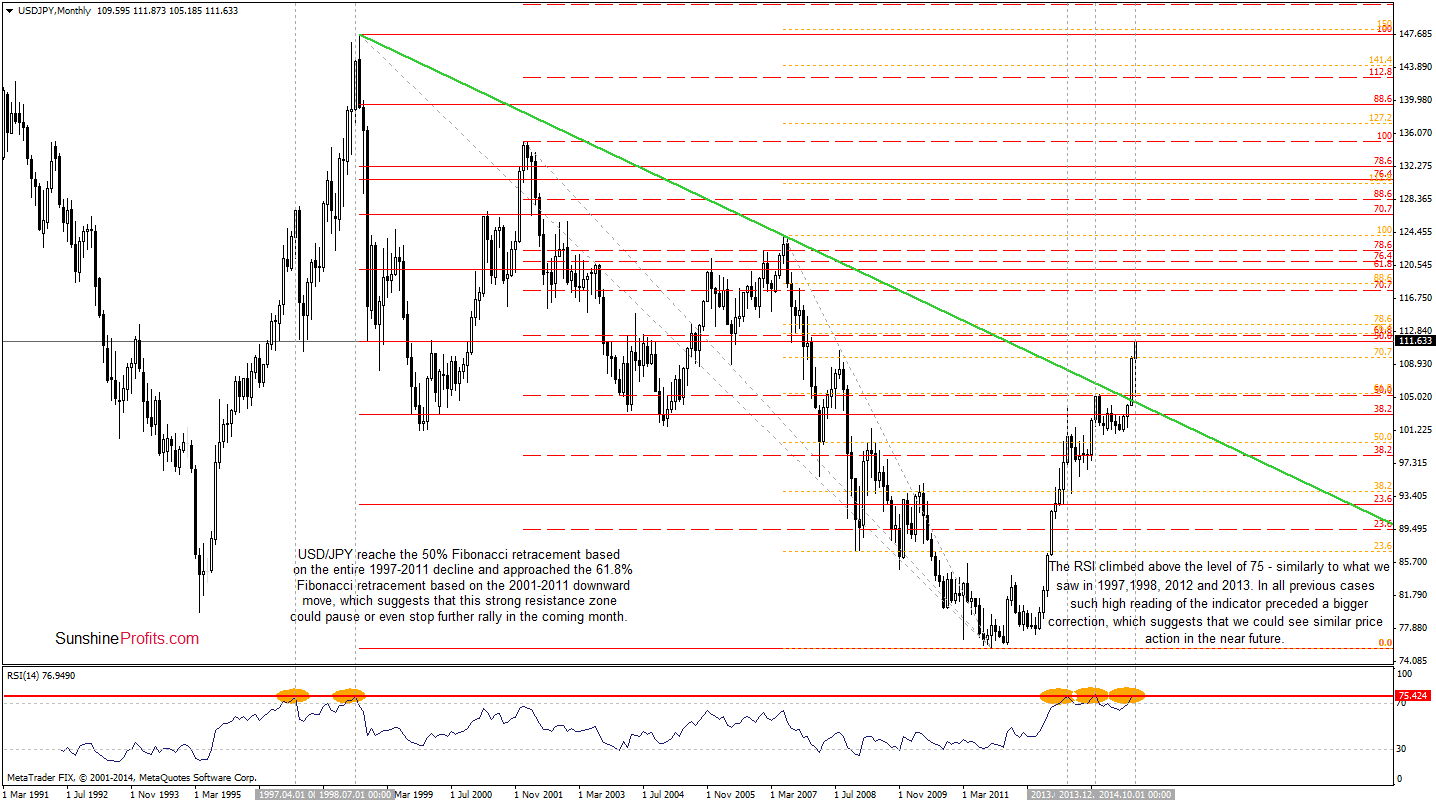
Focusing only on the weekly chart it’s hard to say with a certainty where will the pair head next. However, when we zoom out our picture and take a closer look at he monthly chart, we see the USD/JPY reached the solid resistance zone created by the 50% Fibonacci retracement based on the entire 1997-2011 declines and the 61.8% Fibonacci retracement based on the 2001-2011 downward move. Additionally, slightly above the current levels are also 76.4% and 78.6% Fibonacci retracement levels, which reinforce this resistance area. On top of that, when we focus on the RSI, we see that the indicator climbed to the level of 75 once again. We saw similar readings in 1997, 1998, 2012 and 2013. In all previous cases, such high reading of the indicator preceded bigger correcions. Therefore, taking all the above into account, we think that we could see a similar price action in the near future and trend reversal is just around the corner.
Very short-term outlook: mixed
Short-term outlook: mixed
MT outlook: mixed
LT outlook: bearish
Trading position (short-term; our opinion): No positions are justified from the risk/reward perspective at the moment. We will keep you informed should anything change, or should we see a confirmation/invalidation of the above.
USD/CAD
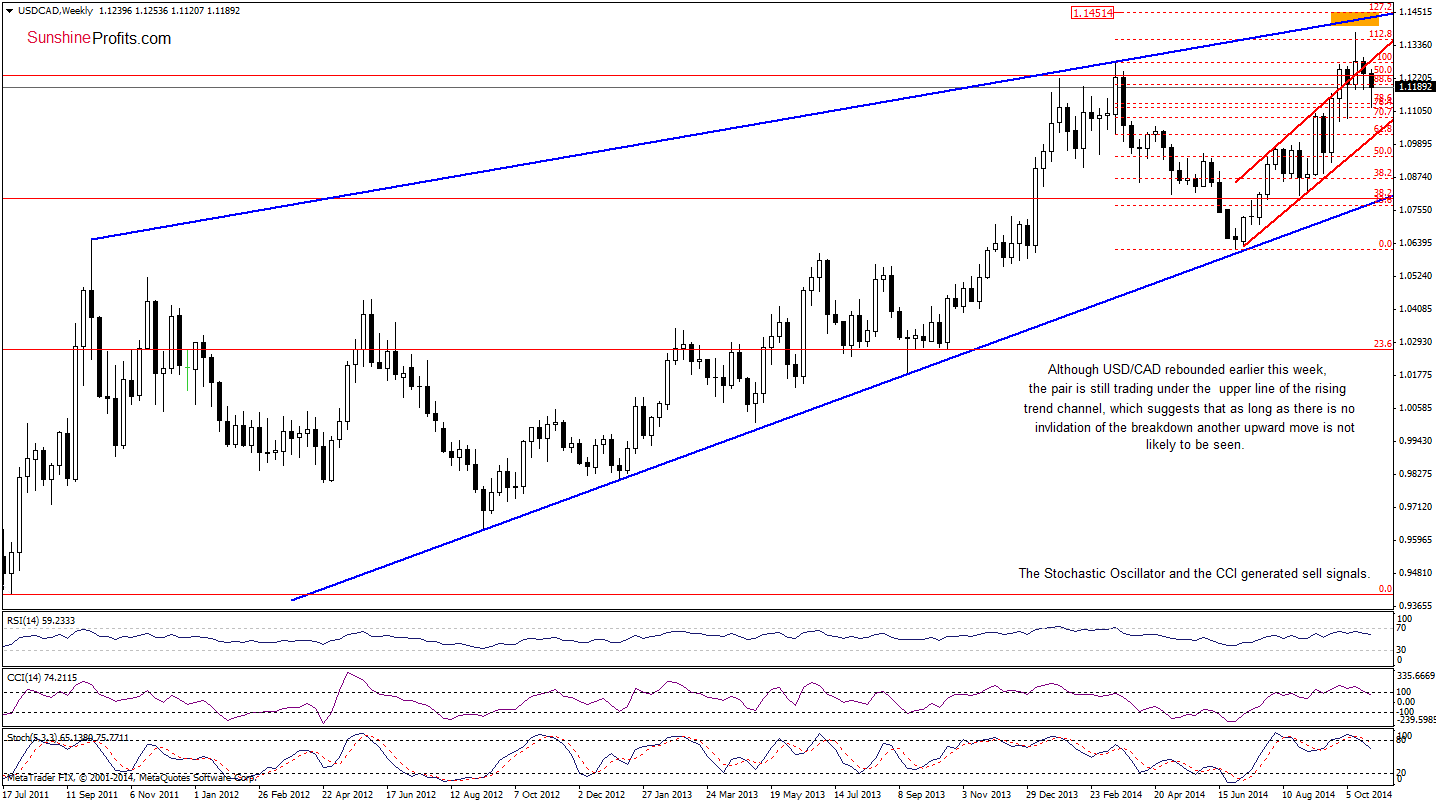
The medium-term picture hasn’t changed much as USD/CAD is still trading under the upper line of the rising trend channel. Therefore, as long as there is no invalidation of the breakdown, another attempt to move lower can’t be ruled out.
Having say that, let’s move on to the daily chart.
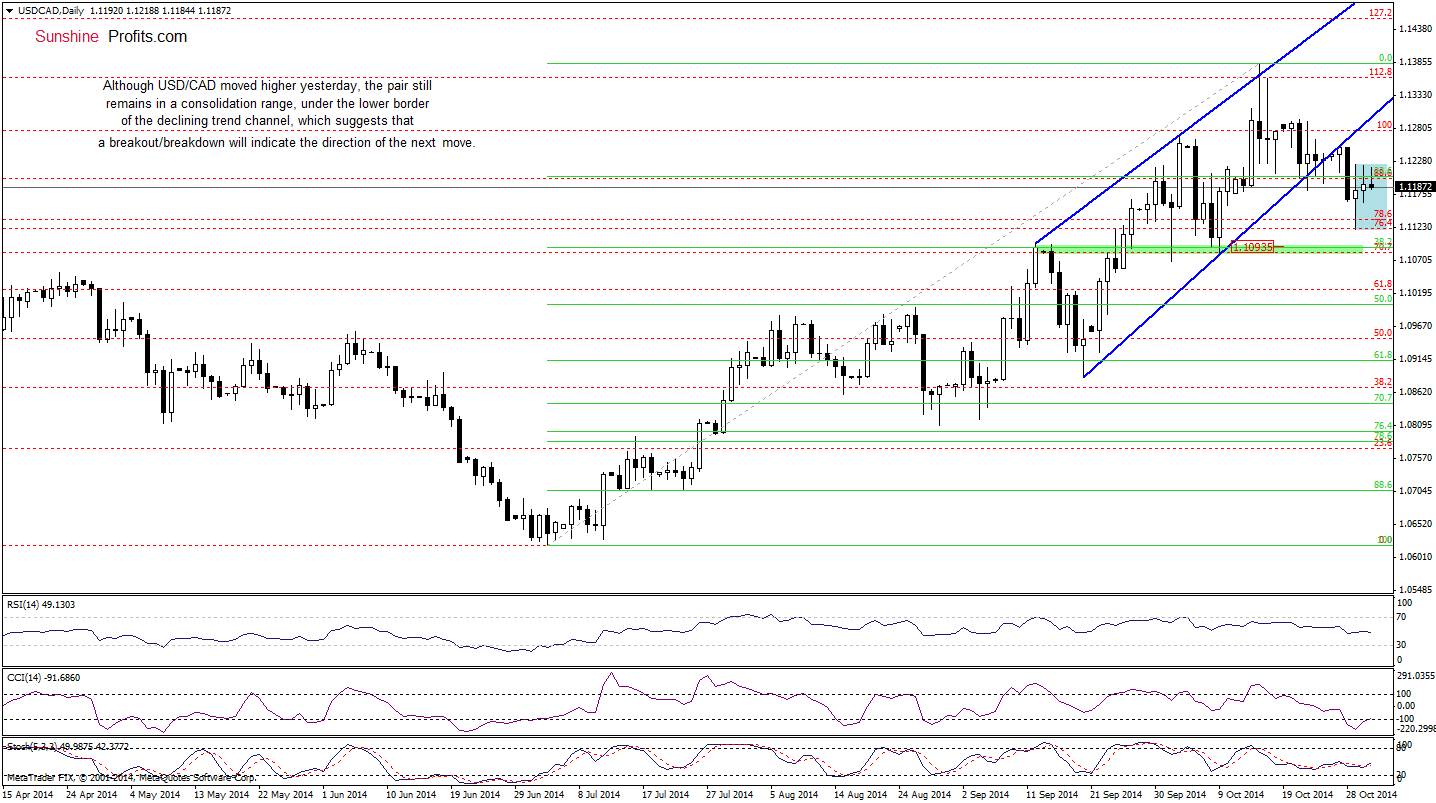
From this perspective, we see that although USD/CAD moved litle lower earlier today, the pair is still trading in a consolidation rane (marked with blue). Therefore, we think that a breakout/breakdown will indicate the direction of the next move. If currency bulls push the pair higher, we’ll see an attempt to invalidate the breakdown bellow the lower border of the rising trend channel (currently around 1.1292). On the other hand, if the pair moves lower, we’ll see a drop to the 38.2% Fibonacci retracement based on the entire Jul-Oct rally. Which scenario is more likely? Taking into account the current position of the indicators (and the situation in the USD Index), it seems that the next move will be to the upside.
Very short-term outlook: mixed with bullish bias
Short-term outlook: mixed with bullish bias
MT outlook: mixed with bearish bias
LT outlook: bearish
Trading position (short-term; our opinion): No positions are justified from the risk/reward perspective at the moment. We will keep you informed should anything change, or should we see a confirmation/invalidation of the above.
USD/CHF
Quoting our last commentary on this currency pair:
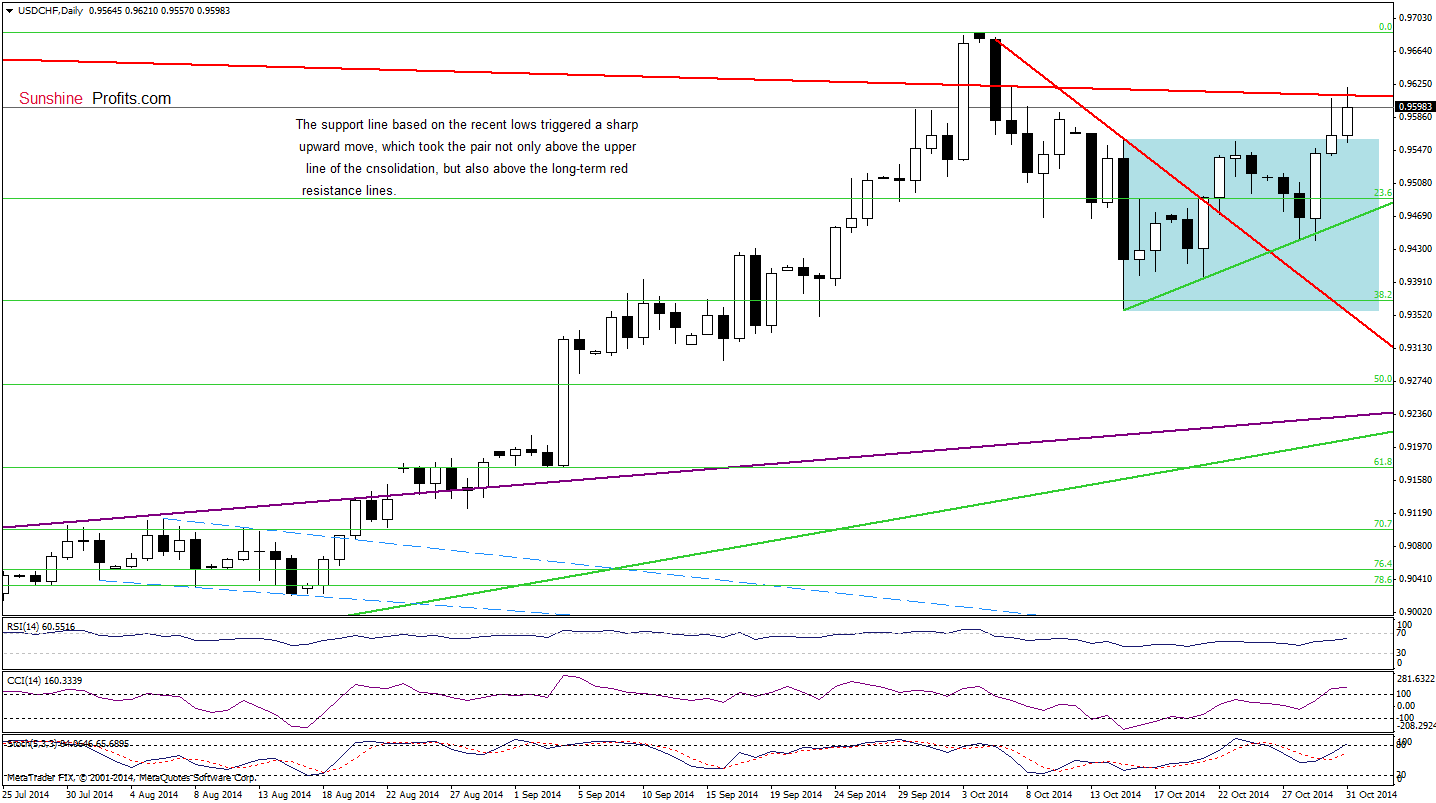
(…) a pullback (…) took the pair to the green line based on the recent lows. (…) we may see another upswing from here (similarly to what we saw yesterday) and an increase to the upper line of the consolidation.
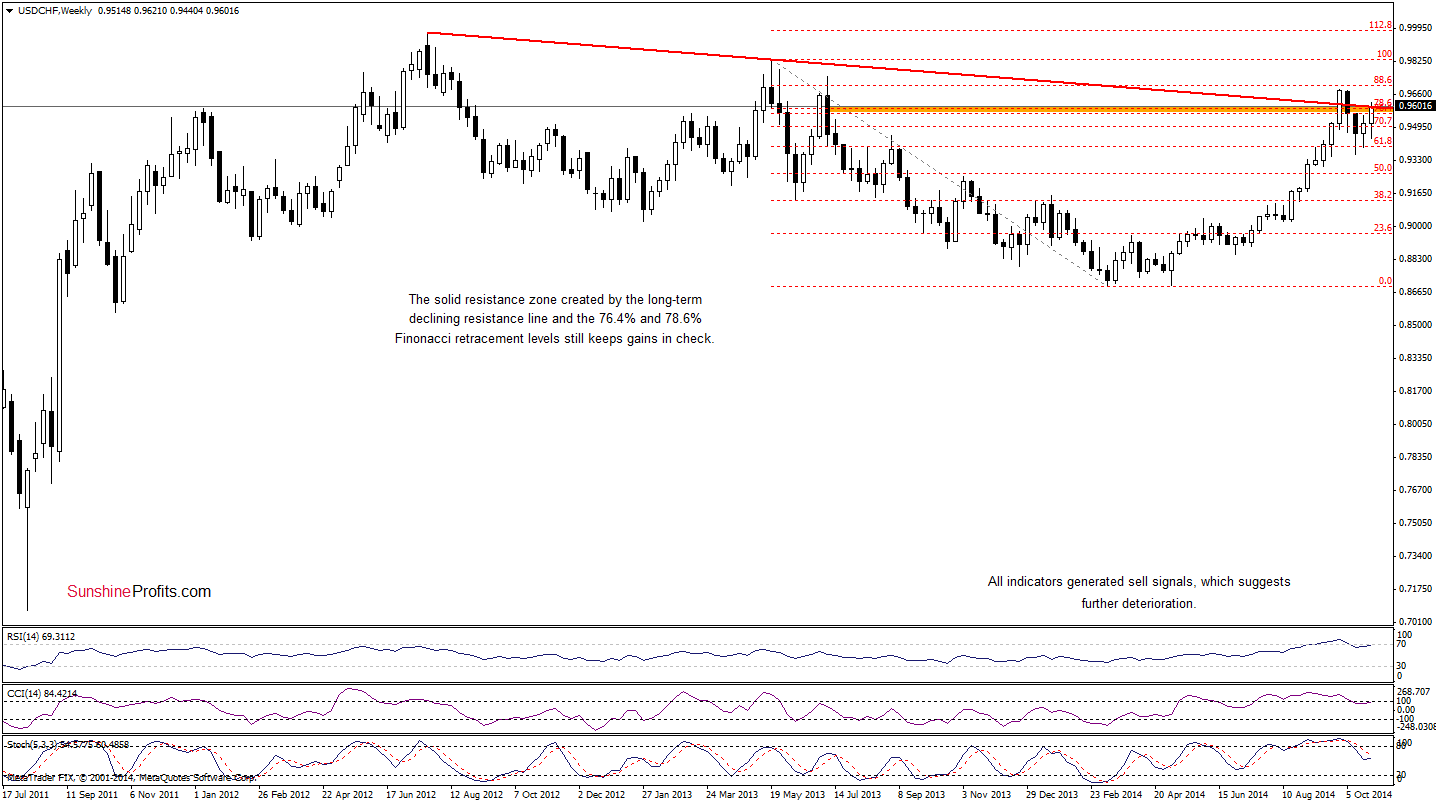
Looking on the above chart, we see that USD/CHF not only reached the above-mentioned upside target, but also climbed above the long-term declining resistance line. Although the pair gave up some gains, the exchange rate is still trading slightly below this line, which suggests that we may see another attempt to move higher. If this is the case, the next upside target would be the Oct 5 high of 0.9686. Nevertheless, we should keep in mind that we might see such price action only if USD/CHF breaks above the resistance zone (marked on the weekly chart) created by the long-term declining resistance line (based on the Jul 2012 and May 2013 highs) and the 76.4% and 78.6% Fibonacci retracement levels.
Very short-term outlook: mixed
Short-term outlook: mixed
MT outlook: bearish
LT outlook: bearish
Trading position (short-term; our opinion): No positions are justified from the risk/reward perspective at the moment. We will keep you informed should anything change, or should we see a confirmation/invalidation of the above.
AUD/USD
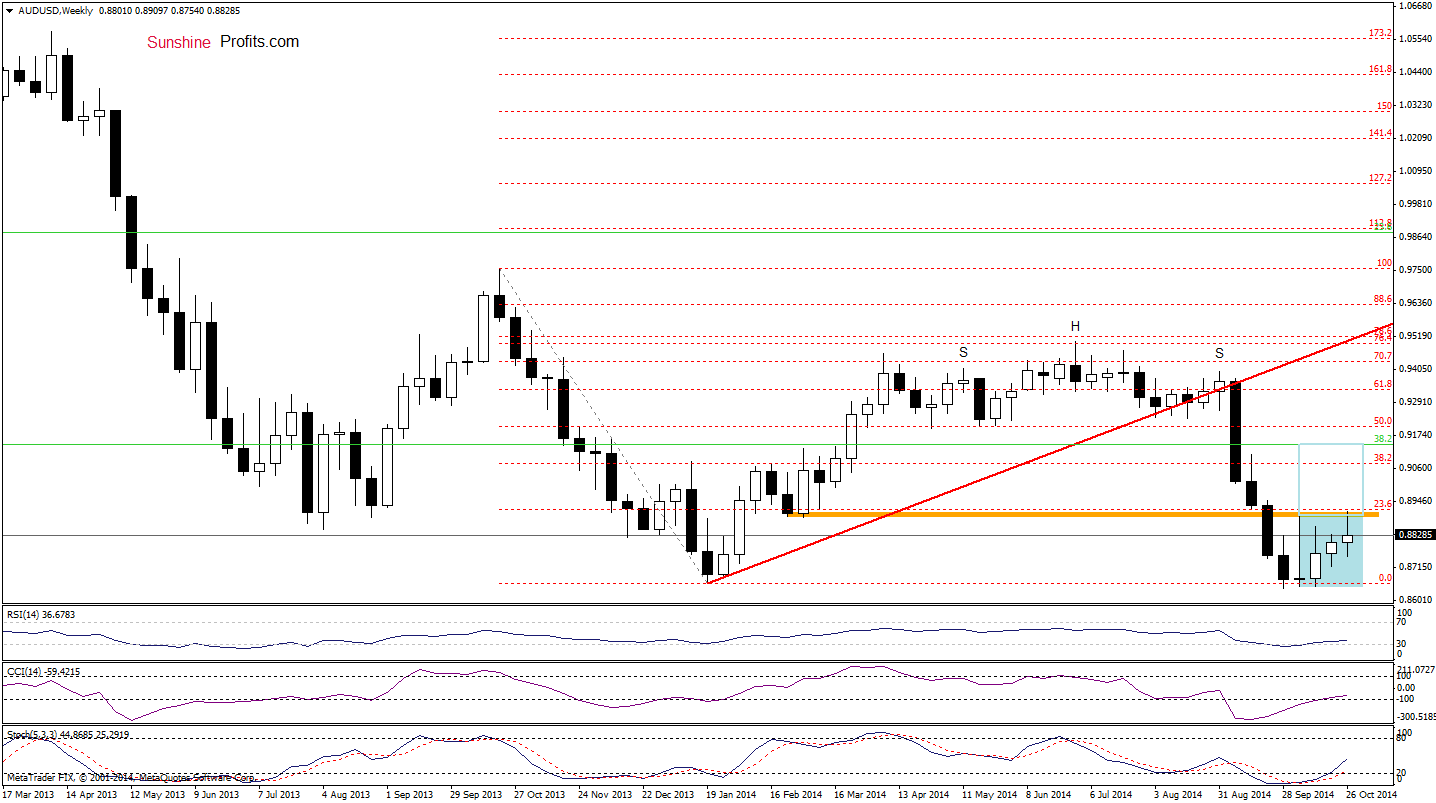
From this perspective, we see that the situation hasn’t changed much as AUD/USD is still trading in a consolidation rnge between the orange resistance zone and the recent lows. Are there any short-term factors that could give us more clues about future moves? Let’s check.
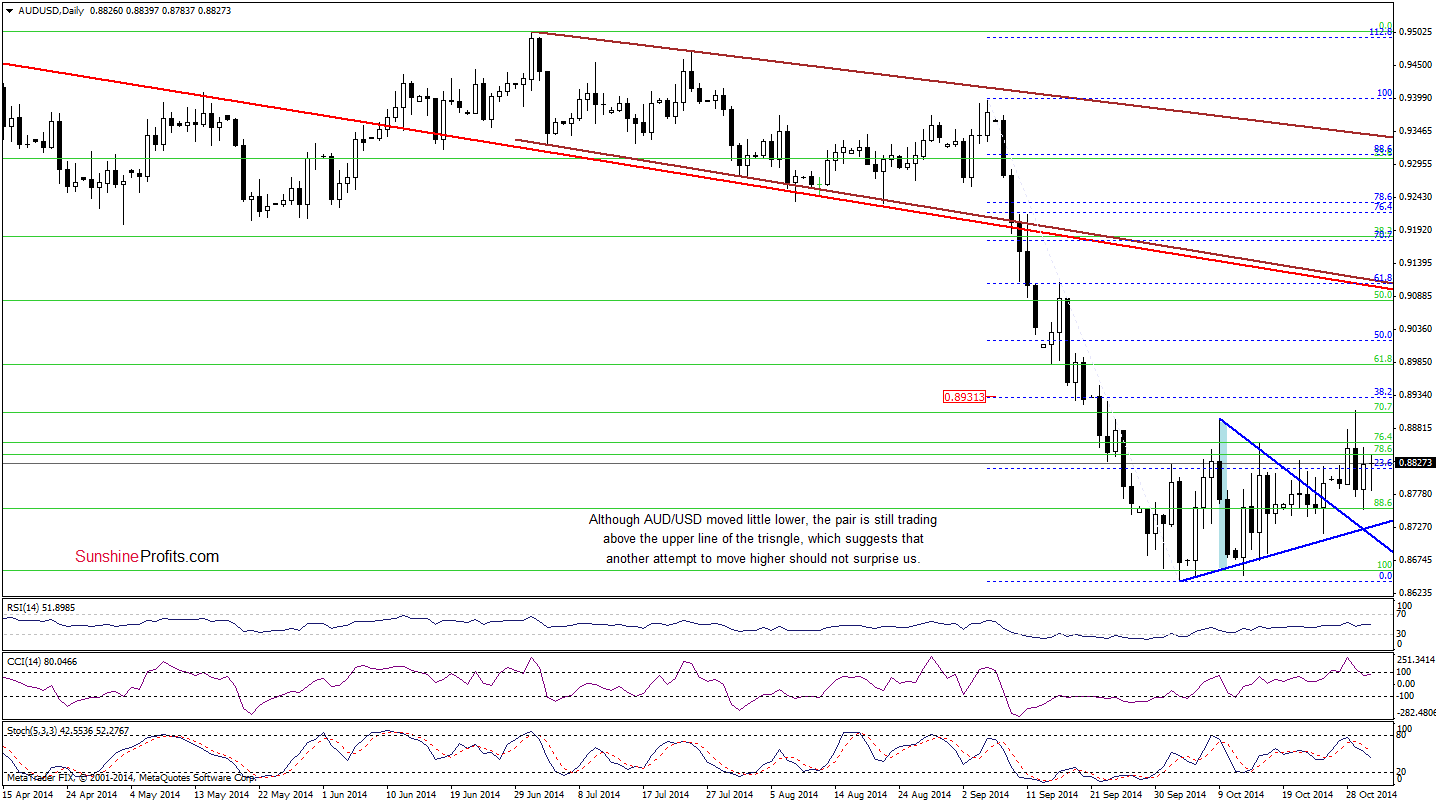
Looking ath the above chart, we see that AUD/USD invalidated a breakout above the Oct 9 high. Although this bearish signal triggered a pullback in the recent days, we think that as long as there is no invalidation of the breakout above the upper line of the triangle, another attempt to move higher should not surprise us.
Very short-term outlook: bullish
Short-term outlook: bullish
MT outlook: mixed
LT outlook: bearish
Trading position (short-term; our opinion): Long positions with a stop-loss order at 0.8587 are still justified from the risk/reward perspective at the moment. We will keep you informed should anything change, or should we see a confirmation/invalidation of the above.
Thank you.
Nadia Simmons
Forex & Oil Trading Strategist
Forex Trading Alerts
Oil Investment Updates
Oil Trading Alerts

