
Earlier today, the U.S. dollar moved lower against other major currencies as investors were eyeing the conclusion of the Fed's two day policy meeting later in the day. As a result, AUD/USD broke above the nearest resistance levels and hit a fresh monthly high. Will the exchange rate reach the next Fibonacci retracement?
In our opinion the following forex trading positions are justified - summary:
- EUR/USD: none
- GBP/USD: none
- USD/JPY: none
- USD/CAD: none
- USD/CHF: none
- AUD/USD: long (stop-loss order: 0.8587; initial price target: 0.8943)
EUR/USD
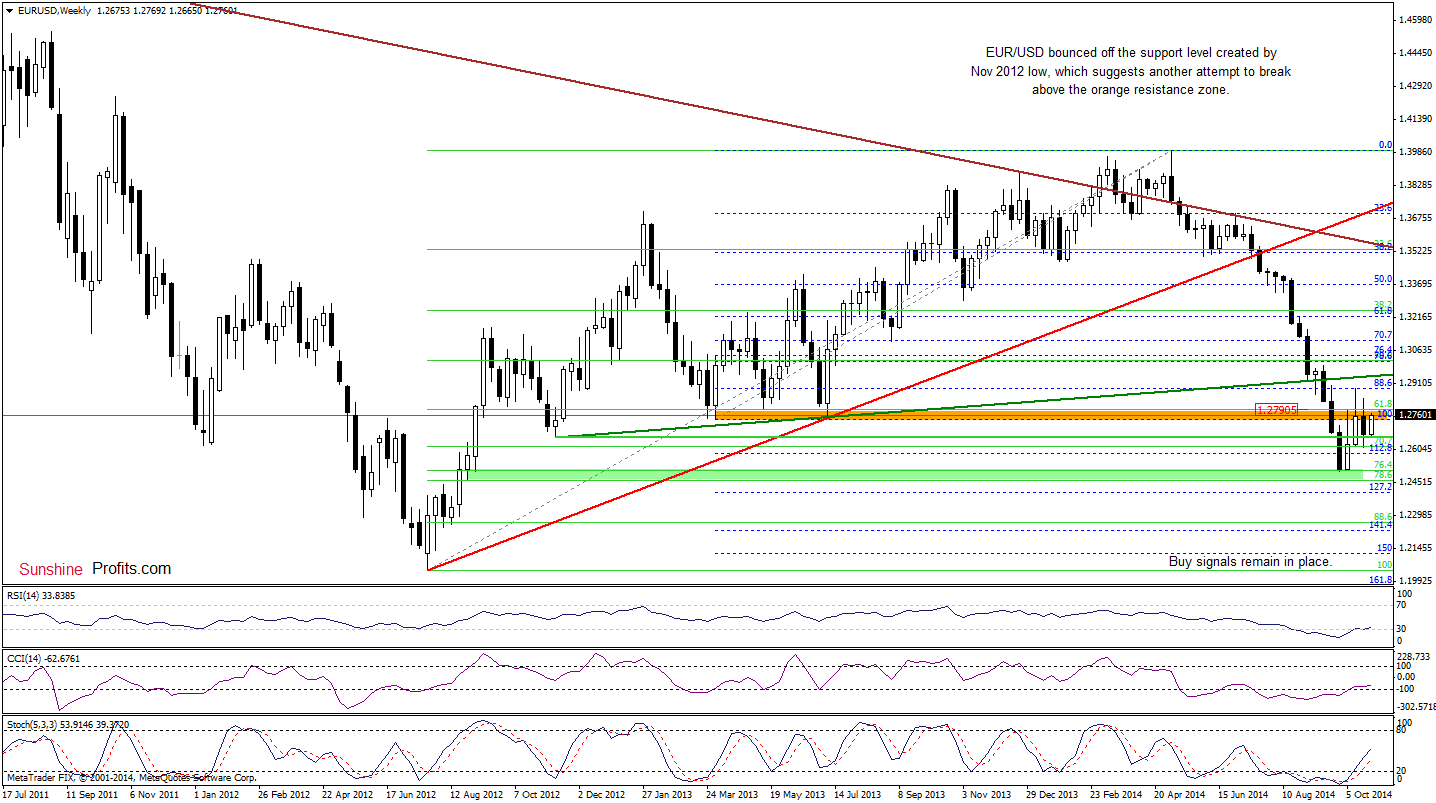
The situation in the medium term hasn’t changed much as EUR/USD is still trading in a narrow range between the support level created by the Nov 2012 low and the orange resistance zone (created by the Apr and Jul 2013 lows and the 61.8% Fibonacci retracement), which keeps gains in check. In our opinion, as long as there is no weekly close above this area, another bigger upward move is not likely to be seen.
Having say that, let’s take a closer look at the daily chart.
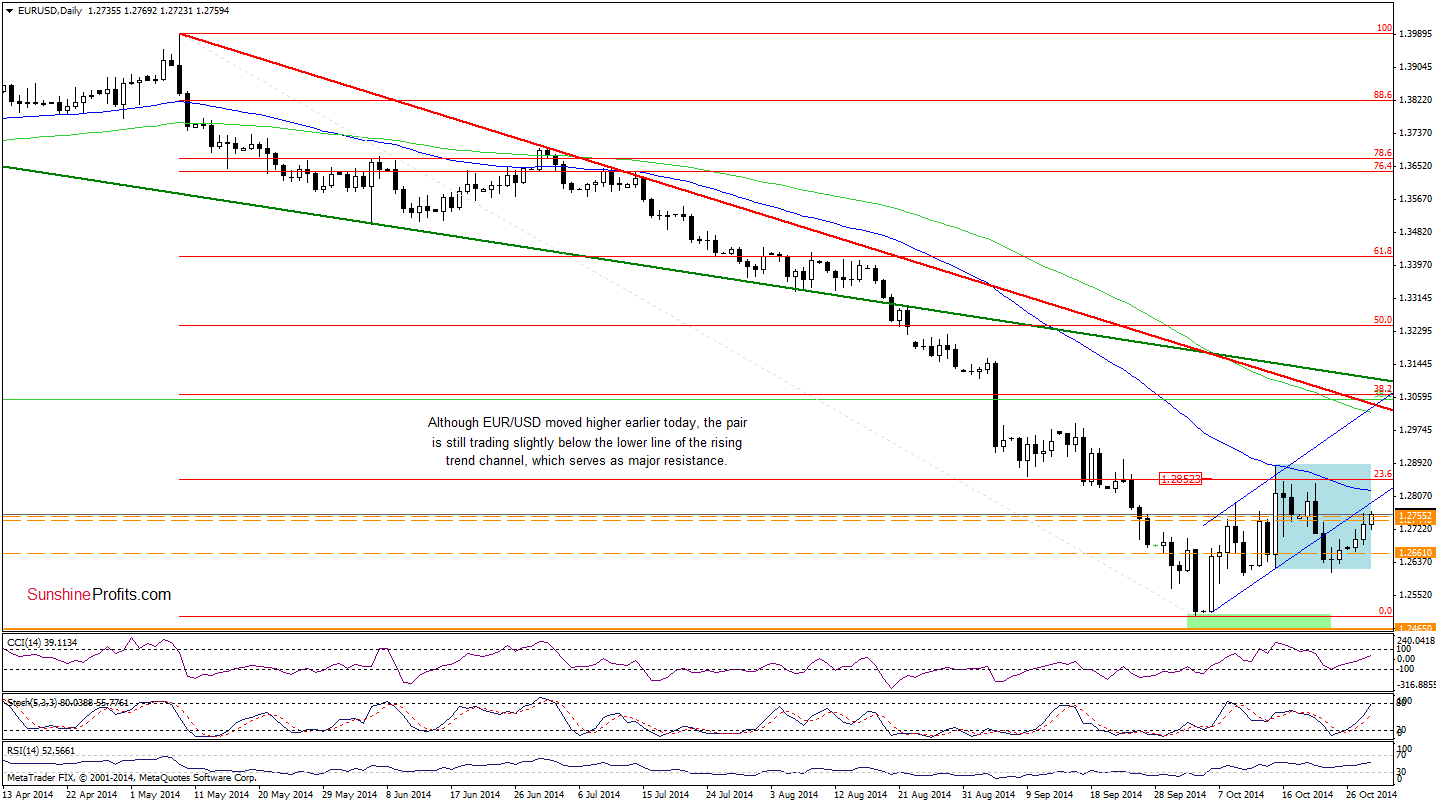
From this perspective, we see that although EUR/USD extended gains and climbed above yesterday’s high, the exchange rate still remains under the lower line of the rising trend channel. Therefore, what we wrote in our last commentary on this currency pair is up-to-date:
(…) Taking into account buy signals generated by the daily indicators, it seems that currency bulls will try to break above this resistance line in the nearest future. If they succeed, we’ll see further improvement and an increase to around 1.2852, where the 23.6% Fibonacci retracement is. Nevertheless, as long as there is no breakout, the recent upward move could be nothing more than a verification of the breakdown.
Very short-term outlook: mixed
Short-term outlook: mixed
MT outlook: mixed
LT outlook: bearish
Trading position (short-term): In our opinion, no positions are justified from the risk/reward perspective at the moment. We will keep you informed should anything change, or should we see a confirmation/invalidation of the above.
USD/CHF
The medium-term picture hasn’t changed much as USD/CHF is still trading in a narrow range, slightly below the strong resistance zone created by the long-term declining resistance line (based on the Jul 2012 and May 2013 highs) and the 76.4% and 78.6% Fibonacci retracement levels.
Will the daily chart give us more clues about future moves? Let’s check.
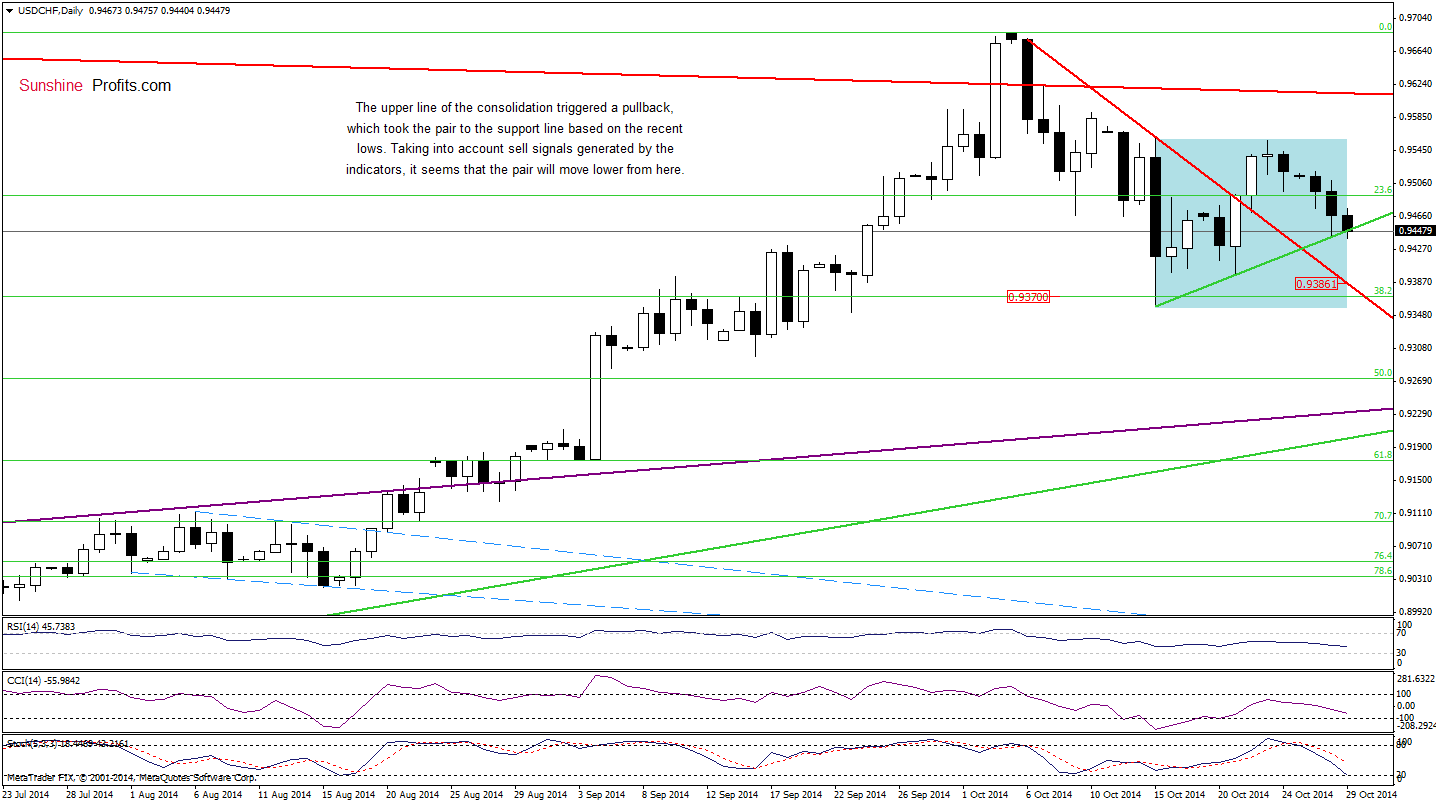
Looking at the above chart, we see that the upper line of the consolidation range in combination with the proximity to the long-term declining resistance line (marked with red) triggered a pullback, which took the pair to the green line based on the recent lows. Although this support encouraged currency bulls to act, USD/CHF reversed and slipped to this line once again. What’s next? On one hand, we may see another upswing from here (similarly to what we saw yesterday) and an increase to the upper line of the consolidation. On the other hand, if the exchange rate drops below this line, we’ll see further deterioration and the initial downside target would be around 0.9386, where the very short-term red support/resistance line is. Which scenario is more likely? Taking into account sell signals generated by the indicators and the proximity to the solid medium-term resistance zone, we think that the next move will be to the downside.
Very short-term outlook: mixed with bearish bias
Short-term outlook: mixed with bearish bias
MT outlook: bearish
LT outlook: bearish
Trading position (short-term; our opinion): No positions are justified from the risk/reward perspective at the moment. We will keep you informed should anything change, or should we see a confirmation/invalidation of the above.
AUD/USD
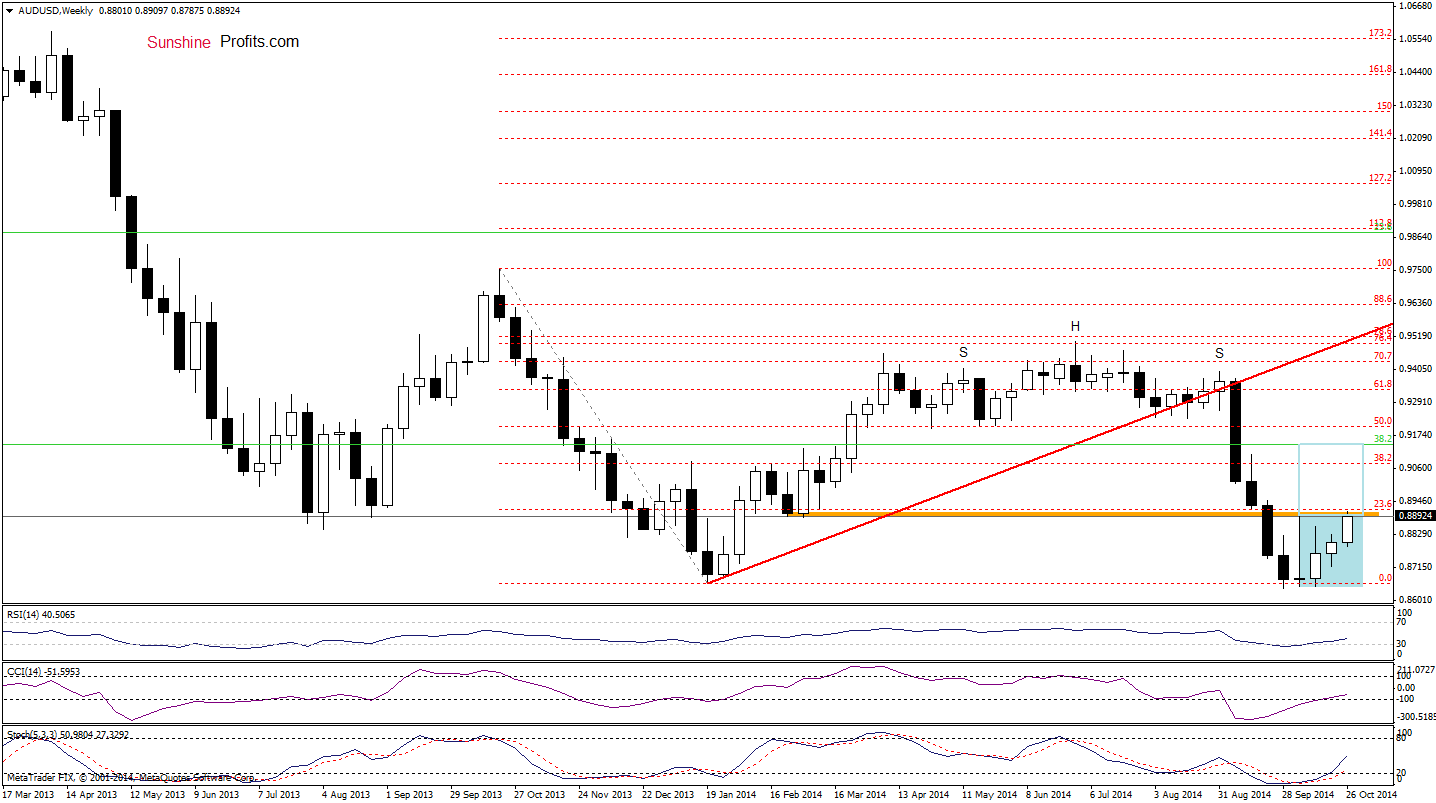
From this perspective, we see that the situation has improved slightly as AUD/USD climbed above the resistance level based on the March low (marked with orange). Although this is a bullish signal, we think that the medium-term picture will turn to bullish if we see a weekly close above this resistance.
Are there any short-term factors that could hinder further rally? Let’s examine the daily chart and find out.
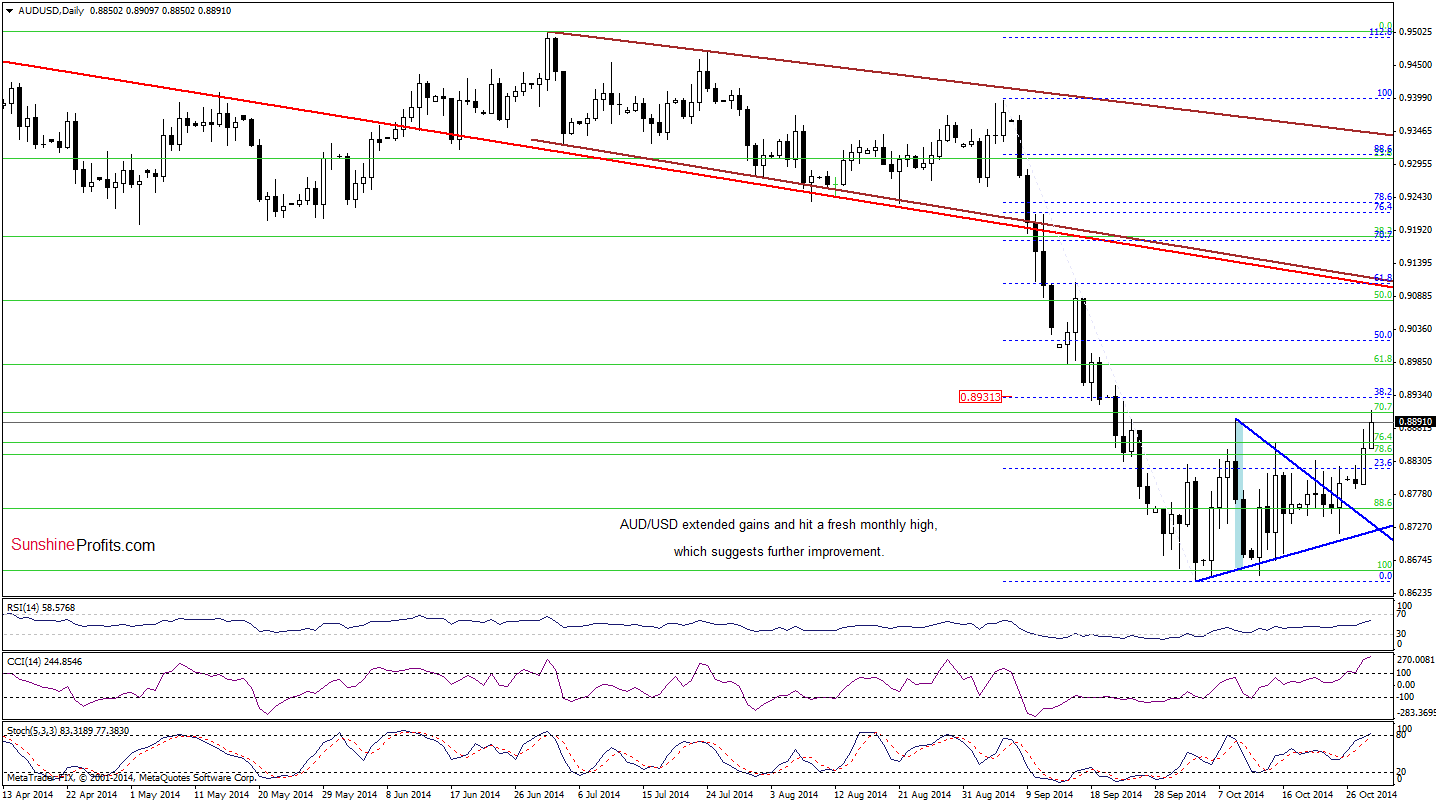
Quoting our Forex Trading Alert posted on Monday:
The first thing that catches the eye on the above chart is asuccesfull breakout above the upper line of the blue triangle. As you see, the exchange rate closed Friday’s session above this key resistance line, which is a bullish signal.
(…) we still think that (…) the initial upside target for currency bulls will be the Oct 9 high of 0.8896 and then the 38.2% Fibonacci retracement based on the Sep-Oct decline around 0.8931.
The daily chart clearly shows that currency bulls realized (so far only partly) the above-mentioned scenario as we expected and AUD/USD reached our initial upside target. Taking into account the breakout above the upper line of the consolidation (seen on the weekly chart) and buy signals generated by the daily and weekly indicators, we believe that the exchange rate will reach our next upside target in the nearest future.
Very short-term outlook: bullish
Short-term outlook: bullish
MT outlook: mixed
LT outlook: bearish
Trading position (short-term; our opinion): Long positions with a stop-loss order at 0.8587 are still justified from the risk/reward perspective at the moment. We will keep you informed should anything change, or should we see a confirmation/invalidation of the above.
Thank you.
Nadia Simmons
Forex & Oil Trading Strategist
Przemyslaw Radomski, CFA
Founder, Editor-in-chief
Gold & Silver Trading Alerts
Forex Trading Alerts
Oil Investment Updates
Oil Trading Alerts

