
Earlier today, German research institute Ifo showed that its index of business climate dropped to 103.2 in October from 104.7 in the previous month. Thanks to these disappointing numbers, EUR/USD moved away from the short-term resistance line. Where will the exchange rate head next?
In our opinion the following forex trading positions are justified - summary:
- EUR/USD: none
- GBP/USD: none
- USD/JPY: none
- USD/CAD: none
- USD/CHF: none
- AUD/USD: long (stop-loss order: 0.8587; initial price target: 0.8943)
EUR/USD
The situation in the medium term hasn’t changed much as EUR/USD is still trading around the Nov 2012 low. Did the very short-term picture change? Let’s check.
On Thursday, we wrote the following:
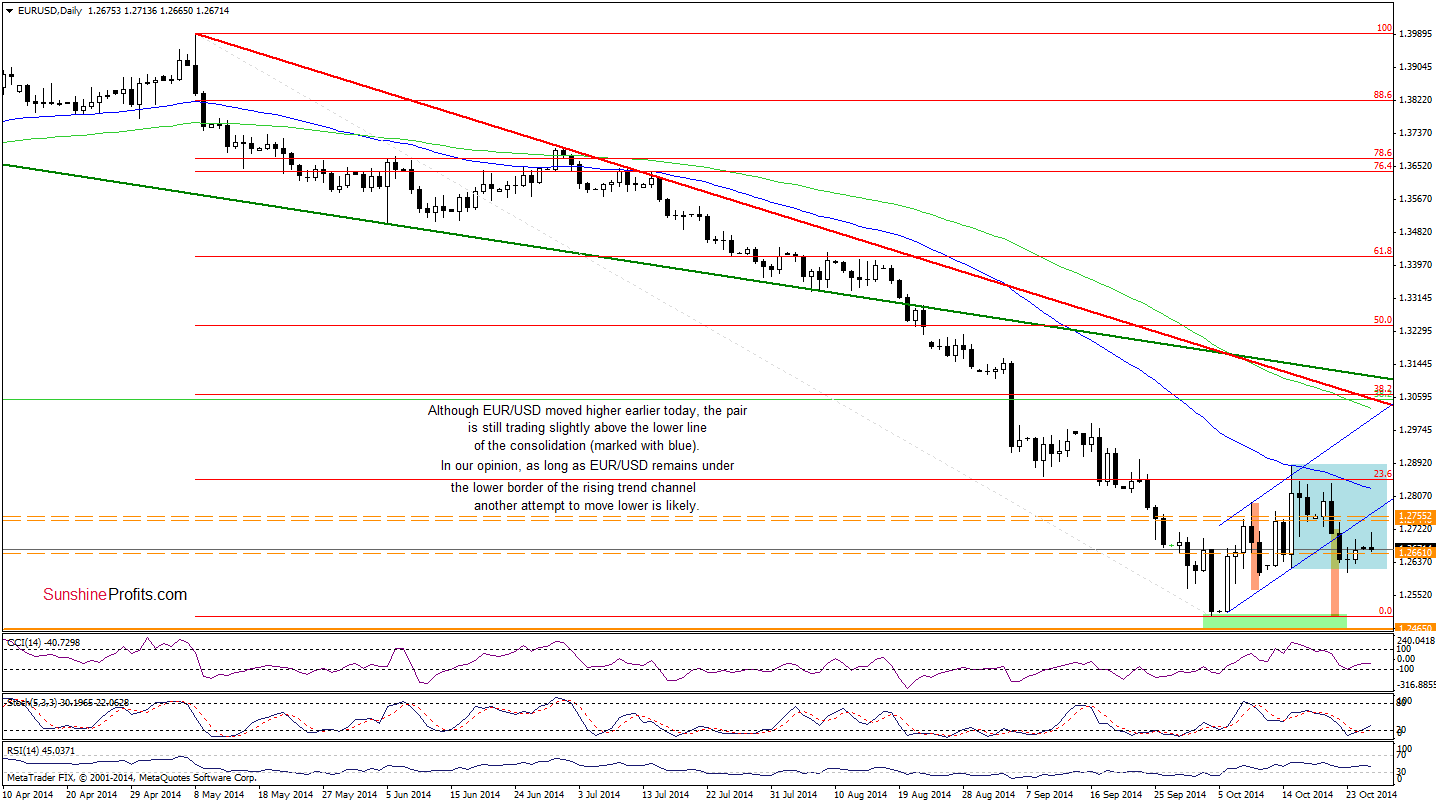
(…) the pair reached the bottom line of the consolidation (marked with blue), which triggered a small upswing. Although we could see further improvement, we think that as long as EUR/USD is trading under the previously-broken lower line of the trend channel, another attempt to move lower is likely. This scenario is currently reinforced by sell signals generated by the CCI and Stochastic Oscillator (…)
Looking at the above chart, we see that although EUR/USD moved higher and came back above the Nov 2012 low earlier today, the proximity to the lower line of the trend channel encouraged currency bears to act as we expected. Taking this fact into account, it seems to us that the recent upward move could be nothing more than a verification of the breakdown. If this is the case, we’ll see another test of the lower border of the consolidation in the nearest future.
Very short-term outlook: mixed with bearish bias
Short-term outlook: mixed with bearish bias
MT outlook: mixed
LT outlook: bearish
Trading position (short-term): In our opinion, no positions are justified from the risk/reward perspective at the moment. We will keep you informed should anything change, or should we see a confirmation/invalidation of the above.
GBP/USD
The medium-term picture remains almost unchanged as GBP/USD is still trading between the resistance line based Aug 2009 and Apr 2011 highs and the support line based on the Apr 2011 and Dec 2012 highs. Will the very short-term picture give us more clues about future moves? Let’s take a closer look at the daily chart and find out.
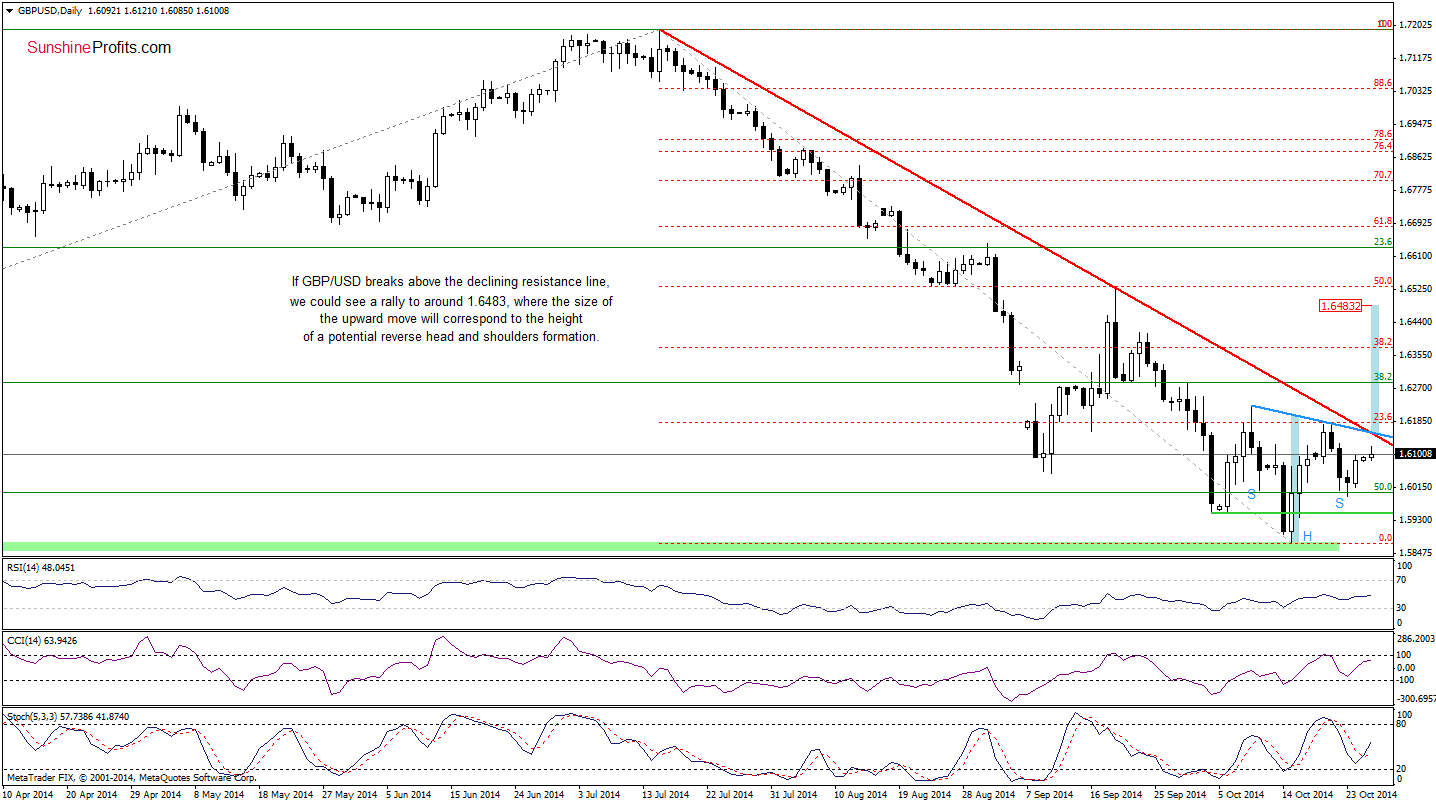
From this perspective, we see that the exchange rate extended gains above the 50% Fibonacci retracement and approached the red declining resistance line. As you see on the above chart, in this area is also the blue resistance line, which is a neck line of a potential reverse head and shoulders formation. Therefore, if currency bulls do not give up and manage to push the exchange rate above these lines, we’ll see a rally to around 1.6483, where the size of the upward move will correspond to the height of the formation. Looking at the daily chart, we see that buy signals generated by the indicators remain in place, supporting the bullish case. Nevertheless, we should keep in mind that the realization of the above scenario will be more likely if the pair breaks above 1.6148, where the long-term resistance line is.
Very short-term outlook: mixed with bullish bias
Short-term outlook: mixed with bullish bias
MT outlook: mixed
LT outlook: mixed
Trading position (short-term): In our opinion, no positions are justified from the risk/reward perspective. We will keep you informed should anything change, or should we see a confirmation/invalidation of the above.
AUD/USD
The situation in the medium term hasn’t changed much as AUD/USD is still trading in a narrow range between the resistance level based on the March low (marked with orange) and the recent lows. Are there any very short-term changes that could tell us where will the pair head next?
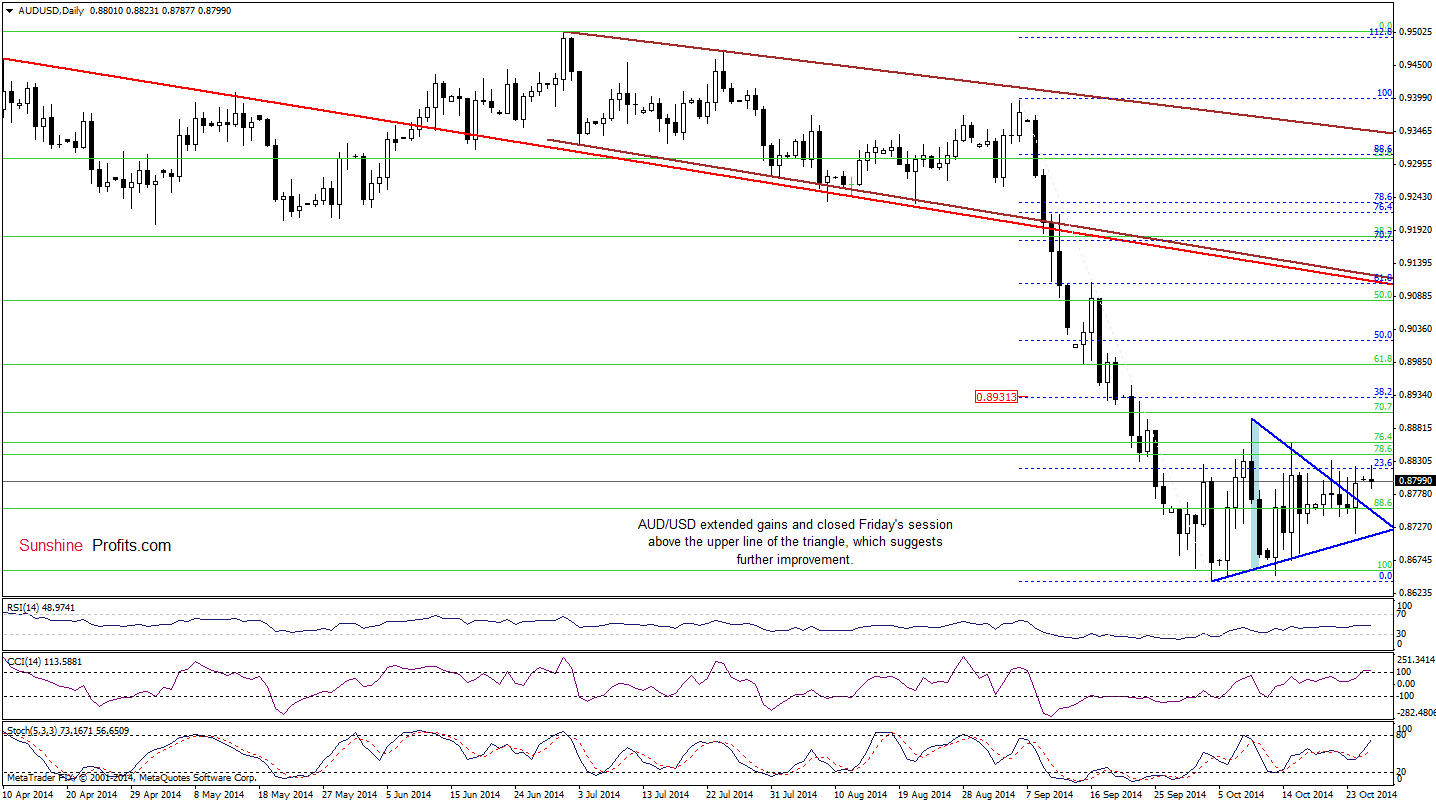
The first thing that catches the eye on the above chart is asuccesfull breakout above the upper line of the blue triangle. As you see, the exchange rate closed Friday’s session above this key resistance line, which is a bullish signal. Therefore, our last commentary on this currcny pair is up-to-date:
(…) we still think that another bigger upswing will be more likely if the pair closes the day above it. If this is the case, and we’ll see such price action, the initial upside target for currency bulls will be the Oct 9 high of 0.8896 and then the 38.2% Fibonacci retracement based on the Sep-Oct decline around 0.8931.
Very short-term outlook: bullish
Short-term outlook: bullish
MT outlook: mixed
LT outlook: bearish
Trading position (short-term; our opinion): Long positions with a stop-loss order at 0.8587 are still justified from the risk/reward perspective at the moment. We will keep you informed should anything change, or should we see a confirmation/invalidation of the above.
Thank you.
Nadia Simmons
Forex & Oil Trading Strategist
Przemyslaw Radomski, CFA
Founder, Editor-in-chief
Gold & Silver Trading Alerts
Forex Trading Alerts
Oil Investment Updates
Oil Trading Alerts

