
Although Friday’s upbeat U.S. data (which showed that U.S. housing starts rose more than expected in the previous month and U.S. consumer sentiment rose to the highest level since July 2007) pushed the greenback higher, the British pound didn’t extend losses. Does it mean that traders’ sentiment is improving?
In our opinion the following forex trading positions are justified - summary:
- EUR/USD: long (stop-loss order: 1.2560; initial price target: 1.3072)
- GBP/USD: none
- USD/JPY: none
- USD/CAD: none
- USD/CHF: short (stop-loss order: 0.9711; initial price target: 0.9332)
- AUD/USD: long (stop-loss order: 0.8587; initial price target: 0.8943)
EUR/USD
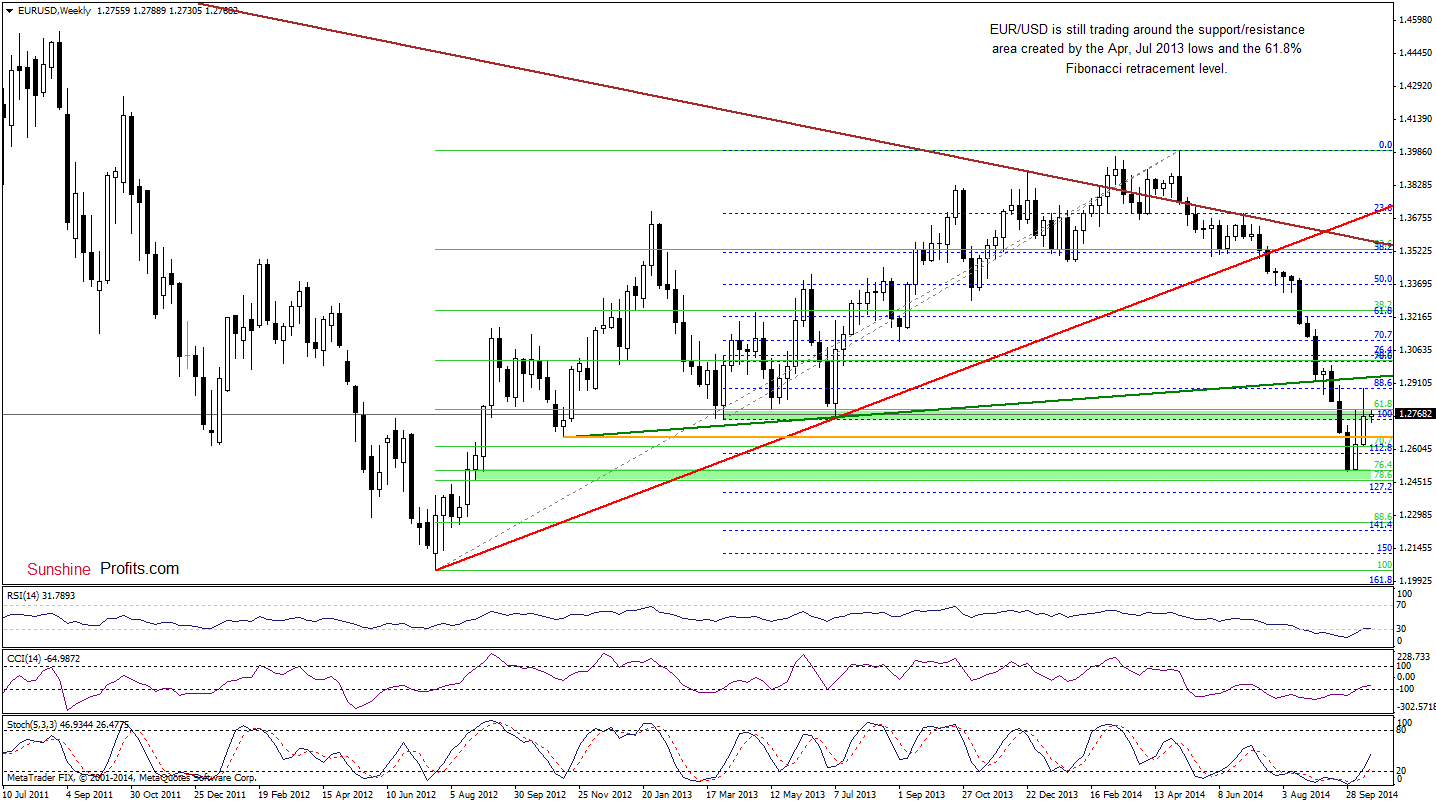
The situation in the medium term hasn’t changed much as EUR/USD is trading around the green support/resistance zone. Although the exchange rate closed the week above the Apr, Jul 2013 lows, the pair still remains under the 61.8% Fibonacci retracement level. If EUR/USD climbs above it, we could see another attempt to break above the previously-broken long-term green support/resistance line based on the Nov 2012 and Jul 2013 lows. Will the pair move higher? Let’s examine the daily chart and look for clues about future moves.
On Thursday, we wrote the following:
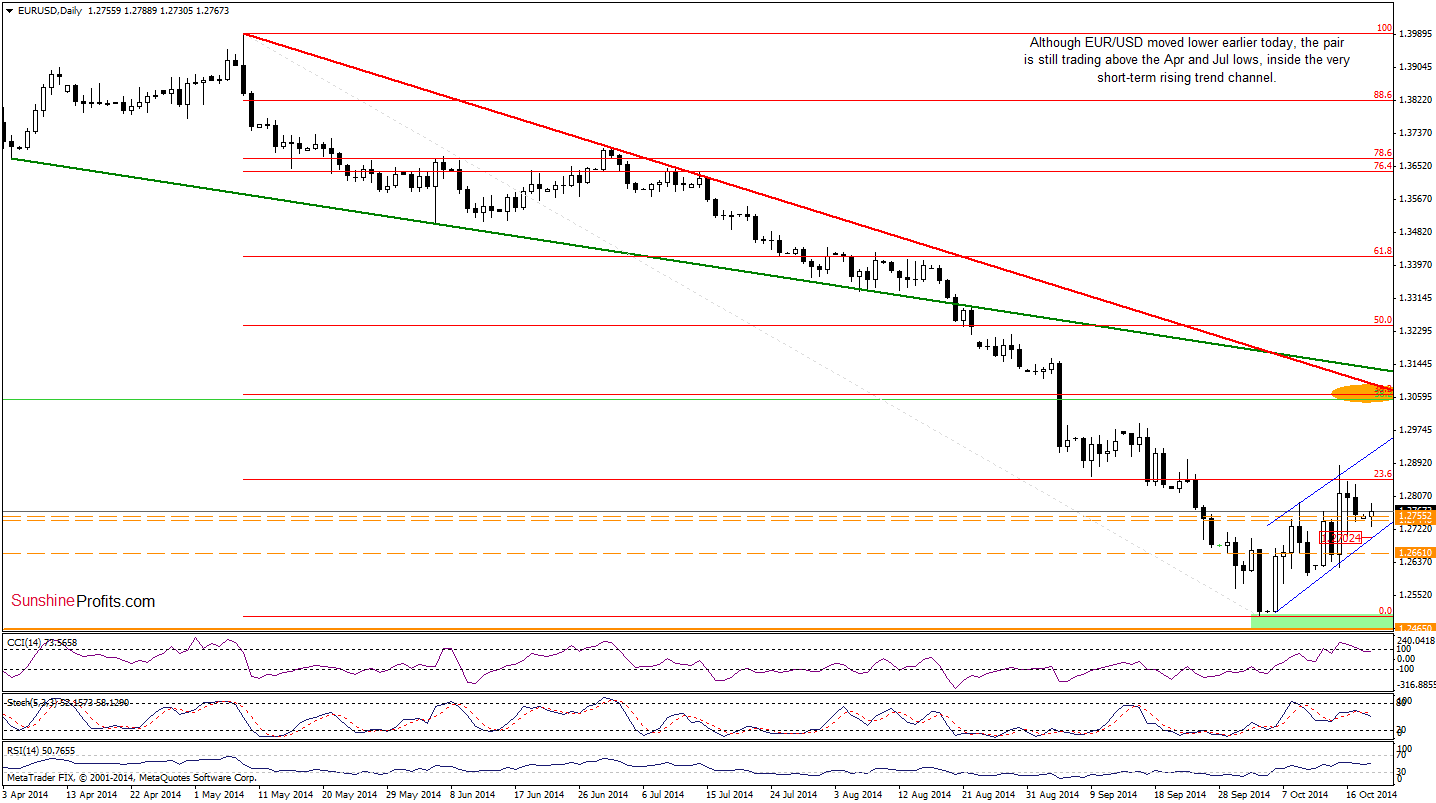
(…) the pair invalidated the breakout above the 23.6% Fibonacci retracement and the upper line of the very short-term rising trend channel, which could trigger a pullback in the coming day to the Apr and Jul 2013 lows or even to the lower border of the formation (currently around 1.2641).
Looking at the daily chart, we see that the situation developed in line with the above-mentioned scenario and EUR/USD slipped to the Apr and Jul 2013 lows. As you see, this support area triggered a small upswing earlier today, but the exchange rate still remains under the last week’s high and the upper border of the very short-term rising trend channel. Therefore, in our opinion, another sizable move (to at least the 38.2% Fibonacci retracement at 1.3068) will be more likely if the pair breaks above these levels.
Very short-term outlook: bullish
Short-term outlook:mixed with bullish bias
MT outlook: mixed
LT outlook: bearish
Trading position (short-term; in our opinion): Long positions with a stop-loss order at 1.2560 are justified from the risk/reward perspective at the moment. We will keep you informed should anything change, or should we see a confirmation/invalidation of the above.
GBP/USD
In our last commentary on this currency pair, we wrote:
(…) the pair (…) slipped to the recent lows. If GBP/USD moves lower, we may see a drop to the Nov 2013 low or even a decline to around 1.5787, where the size of the downward move will correspond to the height of the consolidation (…)
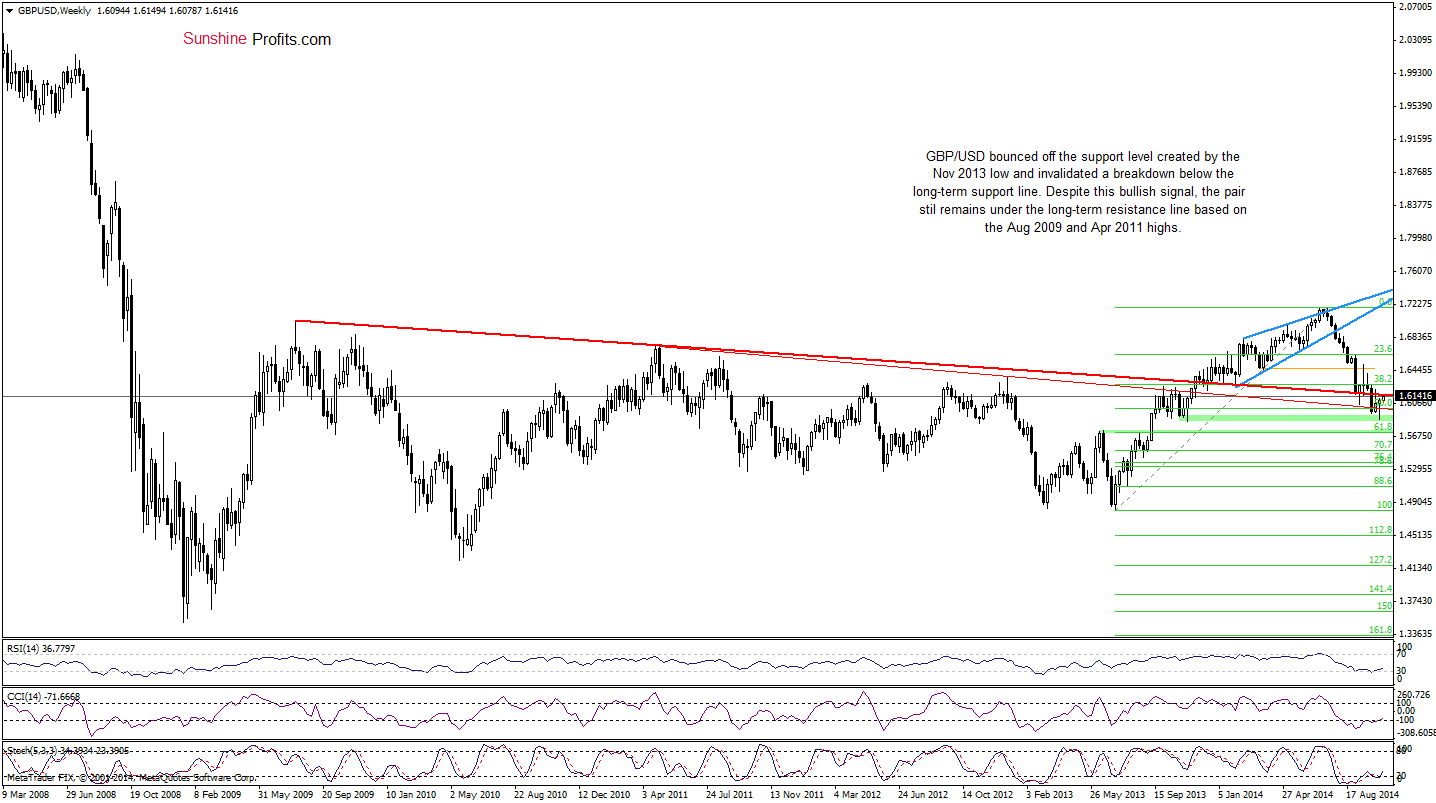
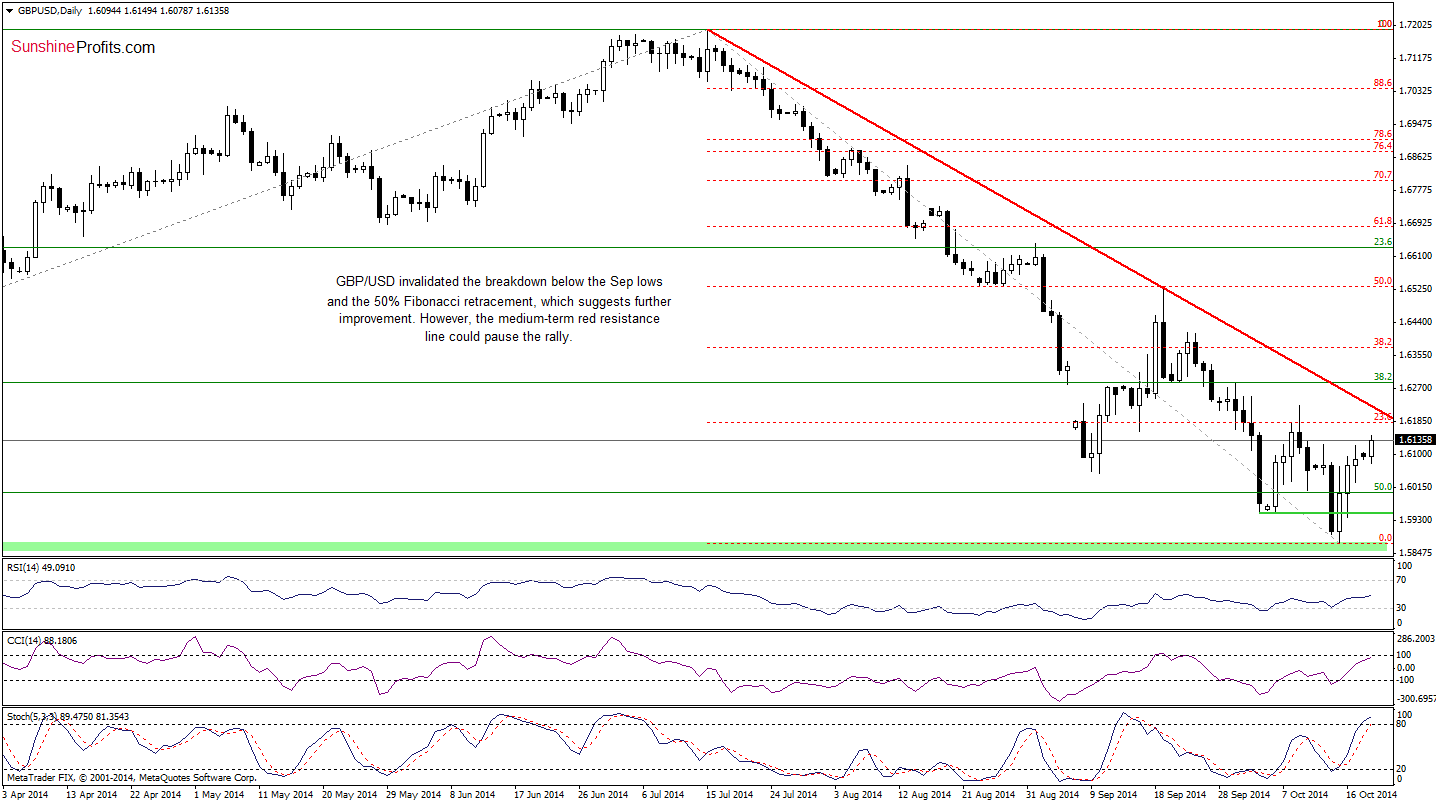
From today’s point of view, we see that currency bears pushed the pair lower and GBP/USD almost touched the Nov 2013 low as we expected. This solid support level not only withstood the selling pressure, but also triggered a corrective upswing. With this move, the exchange rate invalidated the breakdown under the long-term support red line (based on the Apr 2011 and Dec 2012 highs), which resulted in further rally and an increase to the upper long-term resistance red line (based on the Aug 2009 and Apr 2011 highs) earlier today. What’s interesting, slightly above this line is also the medium-term declining resistance line seen on the daily chart, which together create a strong resistance area. Therefore, we think that even if the pair moves little higher in the very short-term, the above-mentioned resistance zone will trigger a pullback in the coming days. In our opinion, this scenario will be even more likely, if the CCI and Stochastic Oscillator generate sell signals.
Very short-term outlook: bearish
Short-term outlook: mixed with bearish bias
MT outlook: mixed
LT outlook: mixed
Trading position (short-term): In our opinion, no positions are justified from the risk/reward perspective. We will keep you informed should anything change, or should we see a confirmation/invalidation of the above.
AUD/USD
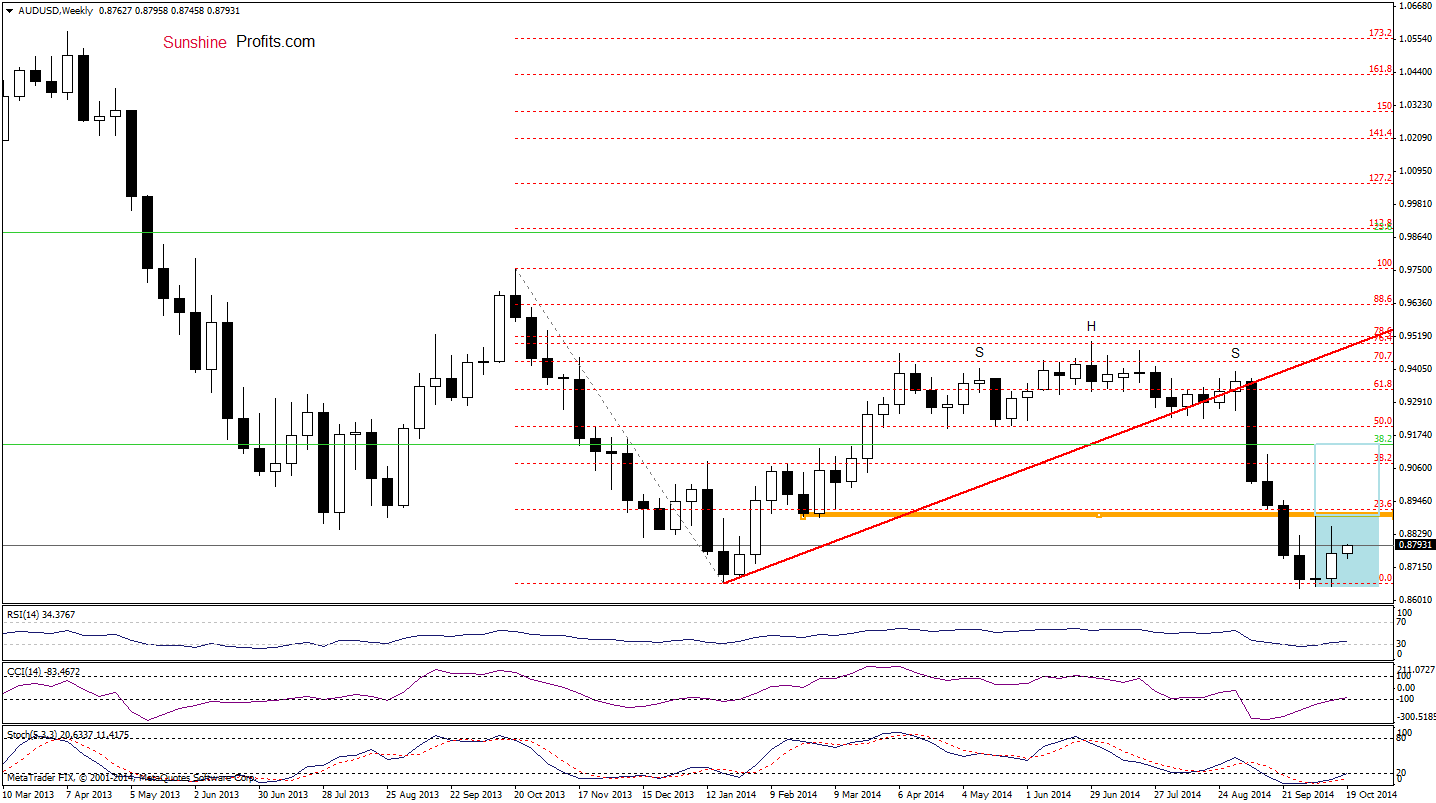
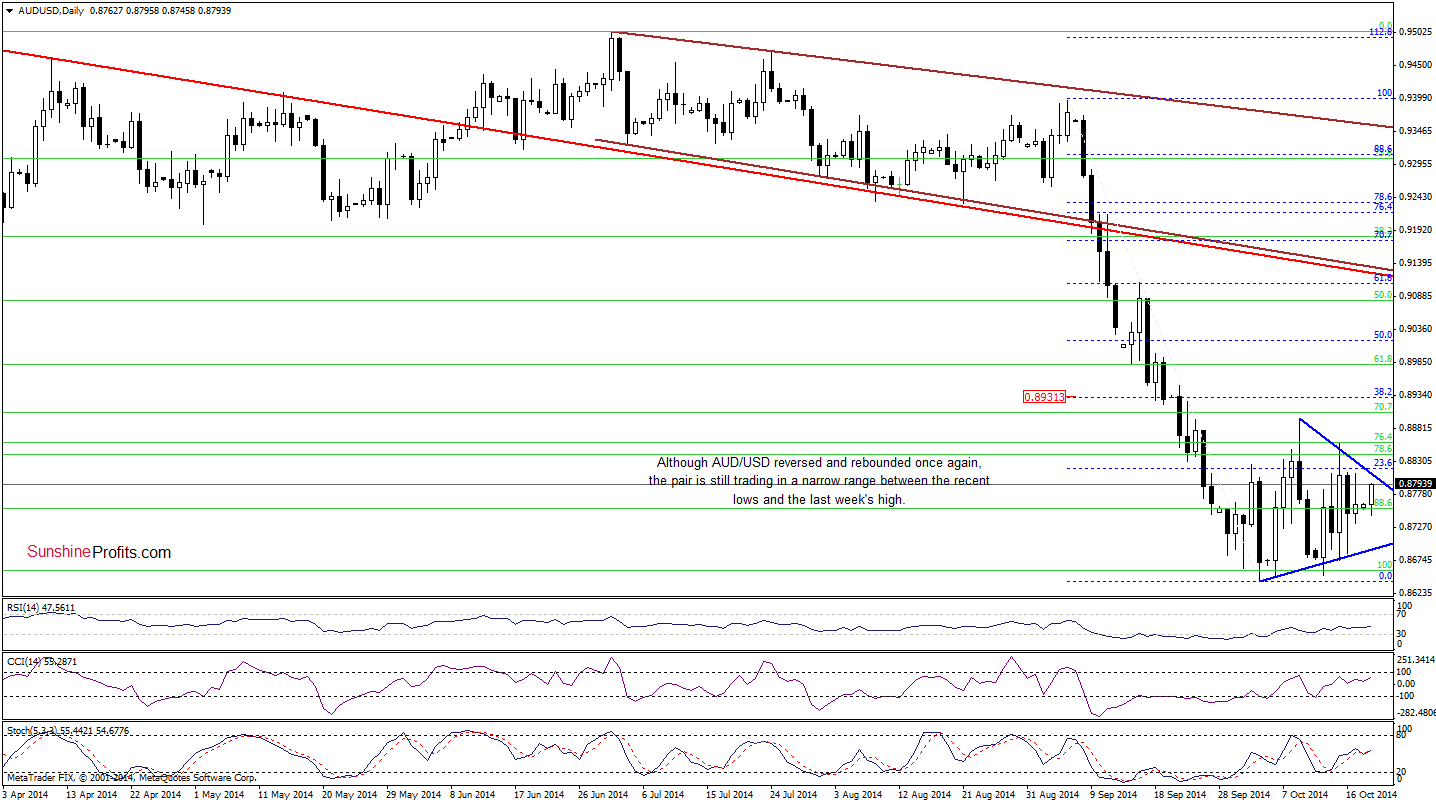
Looking at the above charts, we see that the overall situation hasn’t changed much as AUD/USD is still trading in a narrow range between the resistance level based on the March low (marked with orange on the weekly chart) and the recent lows. Therfore, what we wrote in our Forex Trading Alert posted on Oct 16 is up-to-date:
(…) it seems to us that a bigger upside move will be more likely if the exchange rate breaks above the Oct 9 high of 0.8896. Until this time, short-lived moves in both directions should not surprise us –especially when we factor in the fact that we can write in the recent price moves into the framework of the triangle (marked with blue on the daily chart). Taking the above into account, we think that a breakout above the upper line of the formation, will be sufficiently strong signal to trigger further improvement.
Very short-term outlook: mixed with bullish bias
Short-term outlook: bullish
MT outlook: mixed
LT outlook: bearish
Trading position (short-term; our opinion): Long positions with a stop-loss order at 0.8587 are still justified from the risk/reward perspective at the moment. We will keep you informed should anything change, or should we see a confirmation/invalidation of the above.
Thank you.
Nadia Simmons
Forex & Oil Trading Strategist
Przemyslaw Radomski, CFA
Founder, Editor-in-chief
Gold & Silver Trading Alerts
Forex Trading Alerts
Oil Investment Updates
Oil Trading Alerts

