
In our opinion the following forex trading positions are justified - summary:
- EUR/USD: long (stop-loss order: 1.2560; initial price target: 1.3072)
- GBP/USD: none
- USD/JPY: none
- USD/CAD: none
- USD/CHF: short (stop-loss order: 0.9711; initial price target: 0.9332)
- AUD/USD: long (stop-loss order: 0.8587; initial price target: 0.8943)
In the Oct 2, 2014 Forex Trading Alert, we covered the USD Index with great detail as it was one of the most important things that forex traders should keep in mind. It still is and the situation changed in the last 2 weeks, so today’s alert is a timely update on this key factor. It seems more useful at this time than the regular Friday coverage of all individual currency pairs that we focus on.
All texts included below that are written in italics are quotes from the Oct 2 alert and the remaining text was written / posted in Gold & Silver Trading Alert (minutes ago) today (charts courtesy of http://stockcharts.com).
Let’s start with the short-term picture.
From the short-term perspective, nothing really changed yesterday. The USD Index is more or less where it closed on Wednesday, so what we wrote in yesterday’s Gold & Silver Trading Alert about this index remains up-to-date:
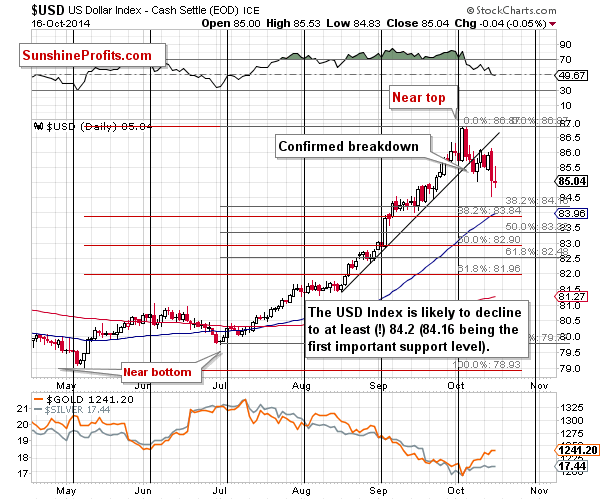
Firstly, the USD Index moved lower but not low enough. It would still need to move lower in order to reach even the highest of the short-term Fibonacci support levels. Consequently, it seems likely that it will decline further – at least to 84.2 or so.
As far as targets are concerned, our previous comments on the USD Index remain up-to-date:
How low can the USD Index move during the corrective downswing? It could decline to 82 (81.96 is the 61.8% Fibonacci retracement based on the May - October rally), but the decline could end as soon as the USD reaches 84.2 or so (84.16 is the 38.2% Fibonacci retracement based on the July – October rally). Either way, the USD Index is quite likely to decline at least by additional 1.4 index points, which is quite a lot.
Let’s check the big picture.
We have previously written about the move above the declining resistance line. We wrote that given the sharpness of the rally it’s not likely that the breakout will be confirmed and were have been expecting a corrective downswing. On Oct 2, we wrote the following:
Is the rally over? Not likely – from the long-term perspective, the rally was still not that big, and we would expect it to be, given about a yearly post-breakout consolidation.
However, the rally has been very sharp and a corrective downswing would be something quite natural at this time. Is it likely? Based on the weekly perspective – it is.
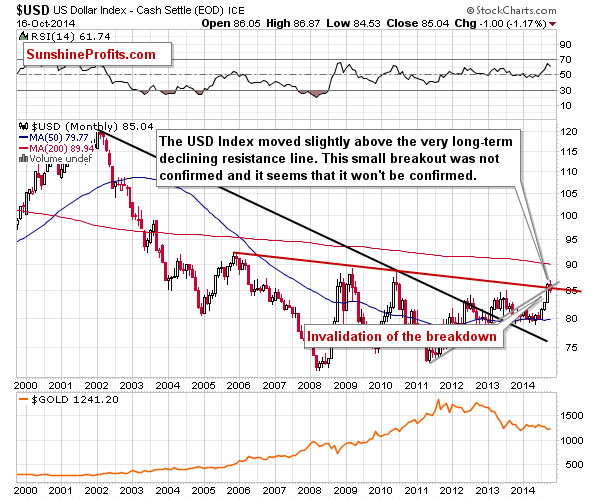
The breakout has been invalidated and the implications are bearish.
We have the following 2 factors: even the highest of the Fibonacci retracement levels was not reached yet, and the breakout above the long-term resistance line was invalidated. Is there a way to connect them?
The above chart does just that.
On Oct 2, we have commented on the above chart in the following way:
From the monthly perspective (and when you take a look at the above chart without enlarging it), the breakout is rather small. Enlarging the above chart, however, reveals that the breakout is indeed visible and similar to the previous 2 “breakouts.” The key thing here is that both previous breakouts above lines based on the 2005 high were followed by invalidations and sharp declines. That’s quite a good reason not to be bullish at this time or excited about the breakout.
There’s also another – perhaps even more important – interesting fact about the above perspective. The RSI indicator is at its 20+-year high. In other words, the sharpness of the most recent rally and absence of corrections have caused the USD Index to be extremely overbought from the medium-term perspective. We have been expecting the rally in the USD Index to be significant and we wrote on multiple occasions that given the long-term breakout that we saw over a year ago, the surprises would be to the upside, but no market could move in only one direction without periodical corrections. The RSI indicator tells us that such a correction is likely just around the corner.
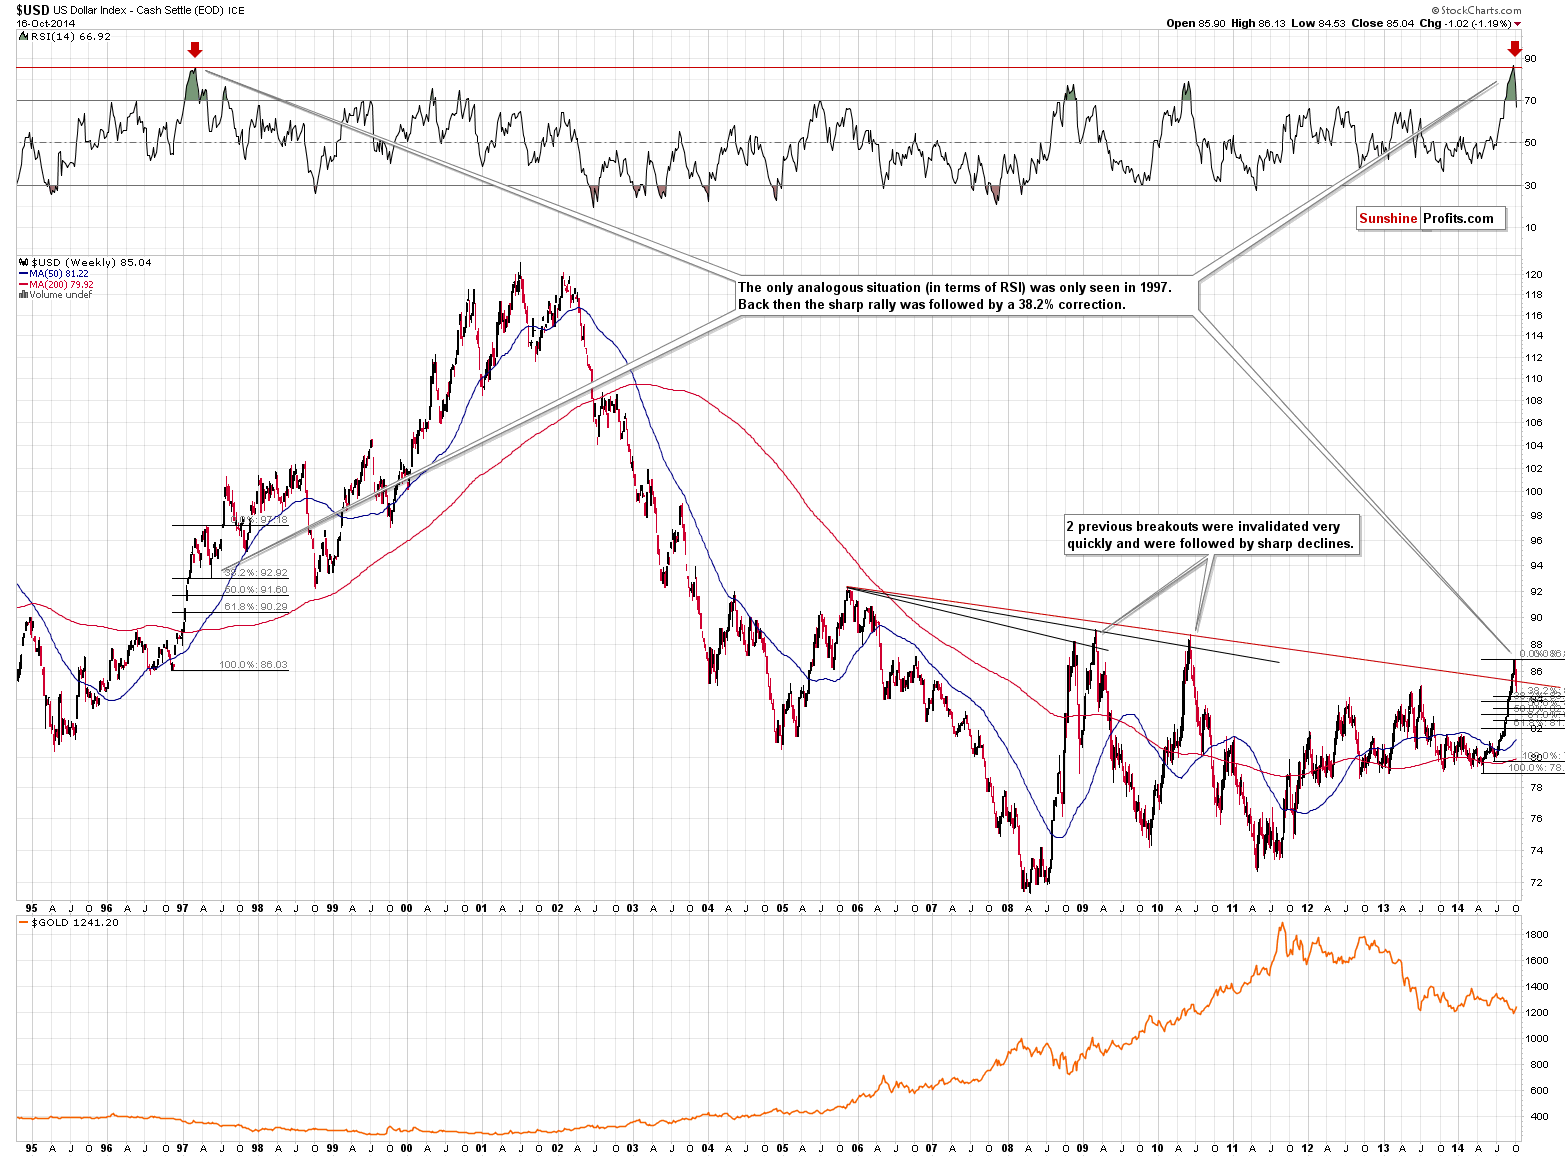
It turns out that when we take an even bigger perspective, we see that the previous analogous breakouts were invalidated rather quickly and declines followed. However, this time really is different because this time the rally was even sharper than it was in the previous cases when we had seen breakouts.
The time that was similar to what happened recently – as described by the RSI indicator – was in 1997. Back then the USD Index corrected exactly to the 38.2% Fibonacci retracement, which is what we have been expecting to see also this time. The long-term chart provides another reason for this scenario to materialize – after all history rhymes.
What does it all mean? That the corrective downswing in the USD Index is likely not over yet, but it seems likely that it will be over relatively soon. The initial target prices that we provided above take this scenario into account, but we will keep you informed, should we believe that the profits should be taken off the table.
Thank you.
Nadia Simmons
Forex & Oil Trading Strategist
Forex Trading Alerts
Oil Investment Updates
Oil Trading Alerts

