
Earlier today, official data showed that Chinese exports climbed 15.3% from a year earlier in September, beating forecasts for an 11.8% increase, while imports rose 7.0%, compared to expectations for a 2.7% decline. These stronger than expected trade data pushed AUD/USD triggered a sharp increase in the AUD/USD pair. Will we see further rally in the coming days?
In our opinion the following forex trading positions are justified - summary:
- EUR/USD: long (stop-loss order: 1.2560; initial price target: 1.3072)
- GBP/USD: none
- USD/JPY: short (stop-loss order: 110.73; initial price target: 105.20)
- USD/CAD: short (stop-loss order: 1.1360; initial price target: 1.1021)
- USD/CHF: short (stop-loss order: 0.9711; initial price target: 0.9332)
- AUD/USD: long (stop-loss order: 0.8587; initial price target: 0.8943)
EUR/USD
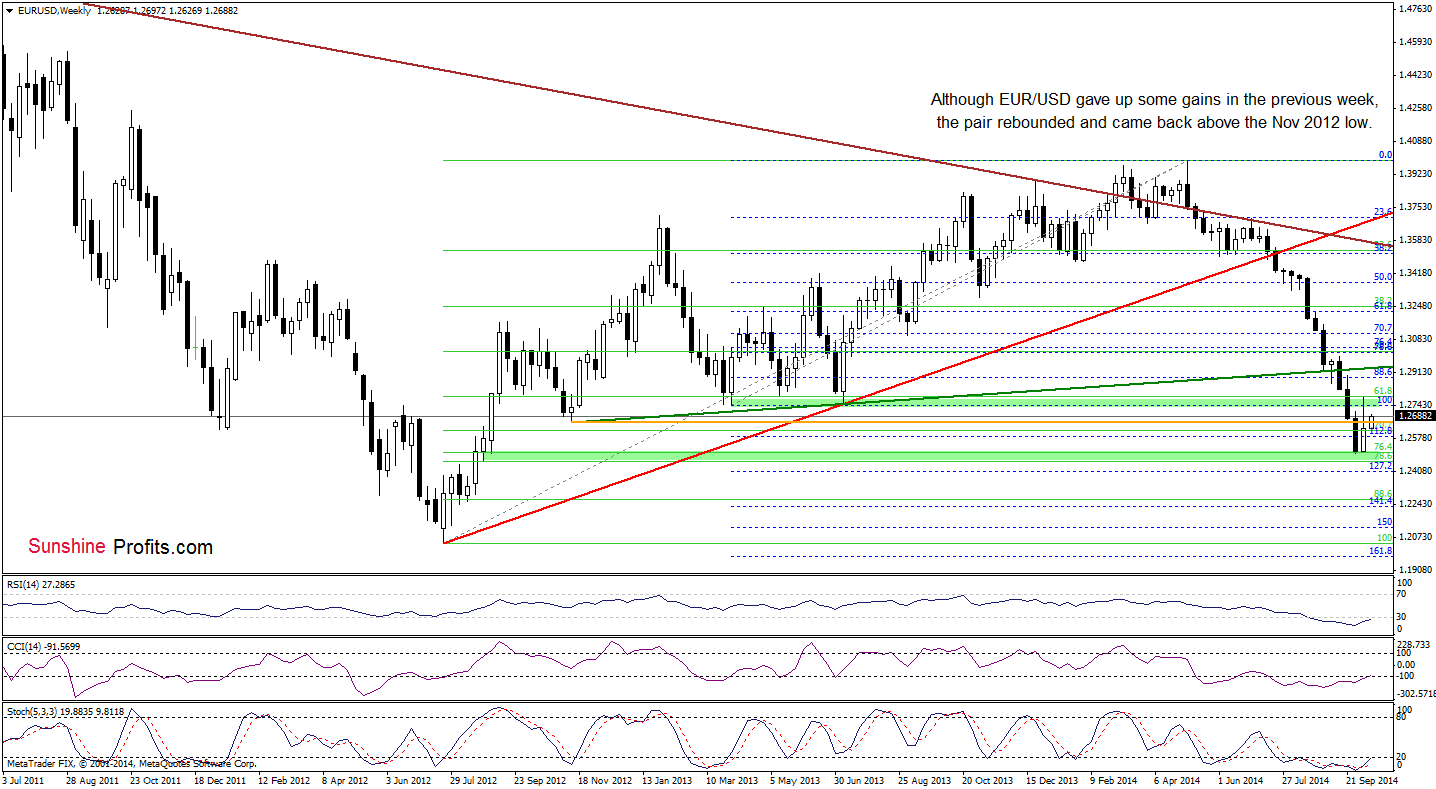
As you see on the weekly chart, although EUR/USD gave up some gains in the previous week, the exchange rate rebounded and came back above the Nov 2012 low, approaching the resistance zone created by the Apr and Jul 2013 lows and the 61.8% Fibonacci retracement. Will we see another attempt to break above this important area? Let’s examine the daily chart and find out whether we receive more clues about future moves or not.
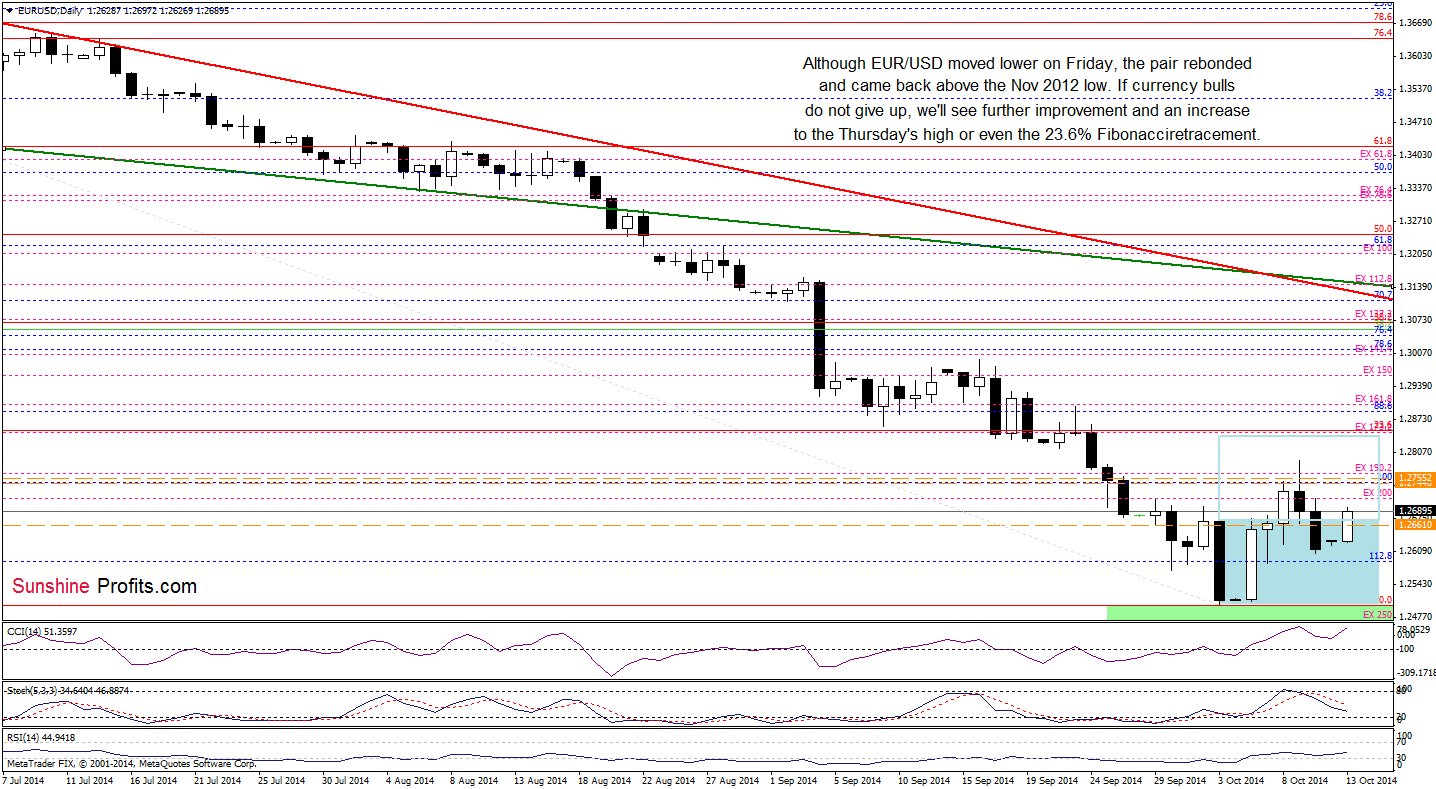
From this perspective, we see that although EUR/USD dropped below the upper line of the consolidation on Friday, currency bulls didn’t give up and managed to push the pair above it once again. Taking this fact into account, and combining it with a comeback above the Nov 2012 low and buy signals generated by the weekly indicators, we think that the exchange rate will move higher in the near future. If this is the case, we’ll see an increase to the Thursday’s high or even to the 23.6% Fibonacci retracement level at 1.2849.
Very short-term outlook: bullish
Short-term outlook:mixed with bullish bias
MT outlook: mixed
LT outlook: bearish
Trading position (short-term; in our opinion): Long positions with a stop-loss order at 1.2560 are justified from the risk/reward perspective at the moment. We will keep you informed should anything change, or should we see a confirmation/invalidation of the above.
USD/JPY
In our Forex Trading Alert posted on Oct 6, we wrote the following:
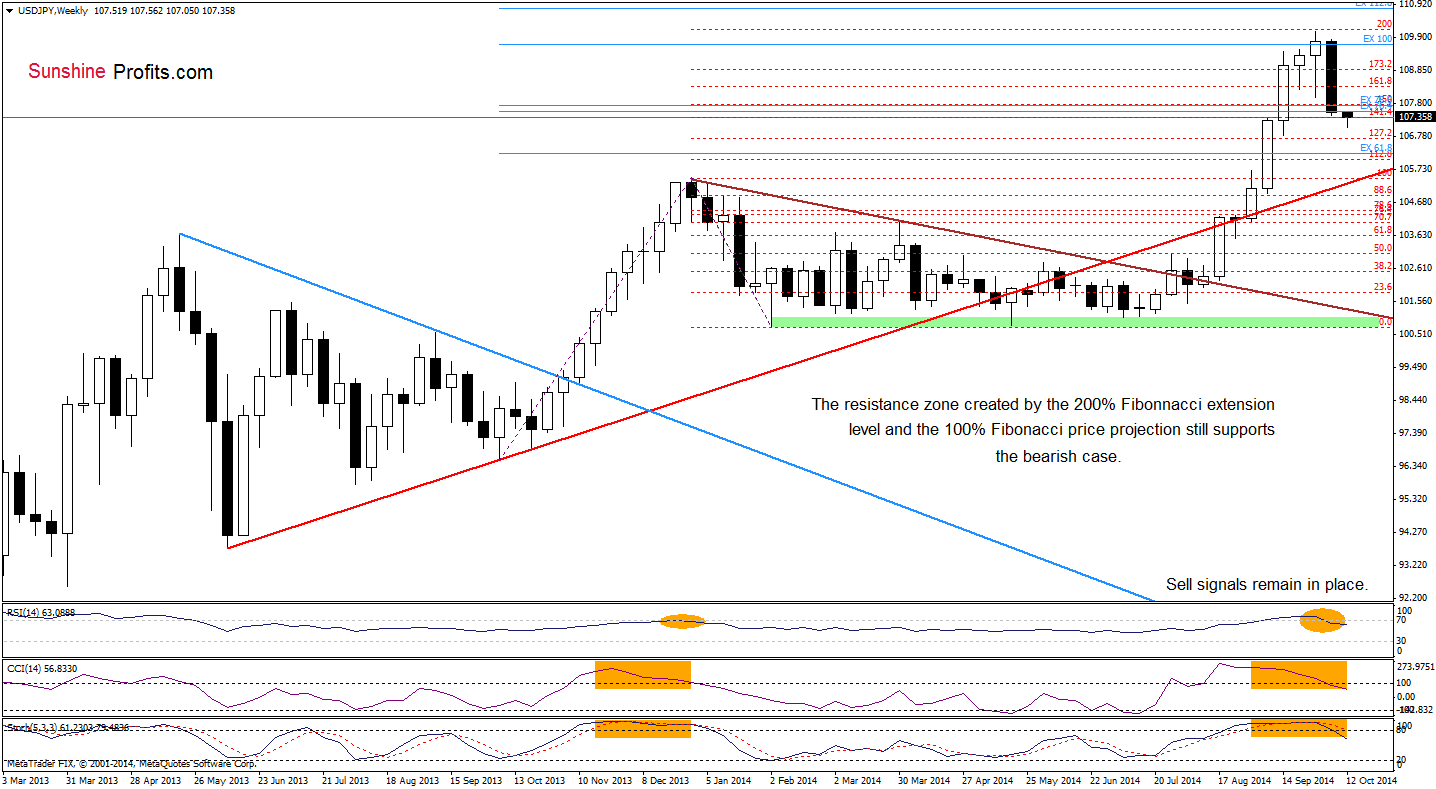
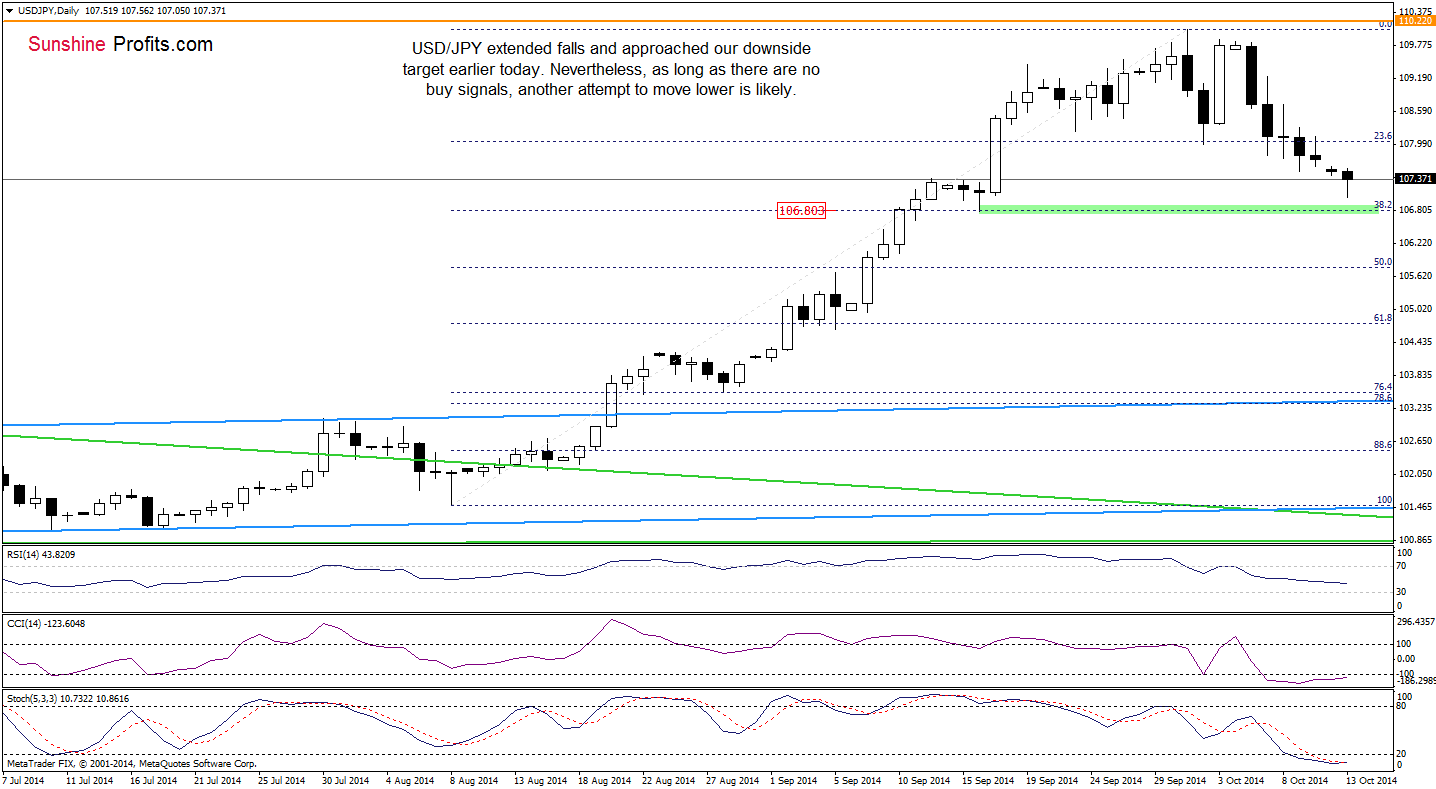
(…) the pair is still trading under the resistance zone created by the recent high and the 200% Fibonacci extension and 100% Fibonacci price projection. Therefore, we maintain our assumption from the previous commentary that the next bigger move will be to the downside. (…) In our opinion, the initial downside target will be the support area created by the Thursday’s low and the 23.6% Fibonacci retracement. If it is broken, the next target for currency bears will be around 106.80, where the 38.2% Fibonacci retracement and the bottom of the correction that we saw in mid-Sep is.
As you see on the above charts, the situation in the medium and short term has deteriorated slightly as USD/JPY moved lower as we expected. On Friday, the pair closed the day below the 23.6% Fibonacci retracement, which triggered another downswing that approached the exchange rate to our downside target. What’s next? Although the proximity to the 38.2% Fibonacci retracement coud induce an upswing, we think that further deterioration is just around the corner as sell signals generated by the weekly indicators remain in place (as a reminder, a similar situation at the beginning of the year triggered a significant decline).
Very short-term outlook: bearish
Short-term outlook: mixed with bearish bias
MT outlook: mixed
LT outlook: bearish
Trading position (short-term; our opinion): Short positions with a stop-loss order at 110.23 are justified from the risk/reward perspective at the moment. We will keep you informed should anything change, or should we see a confirmation/invalidation of the above.
AUD/USD
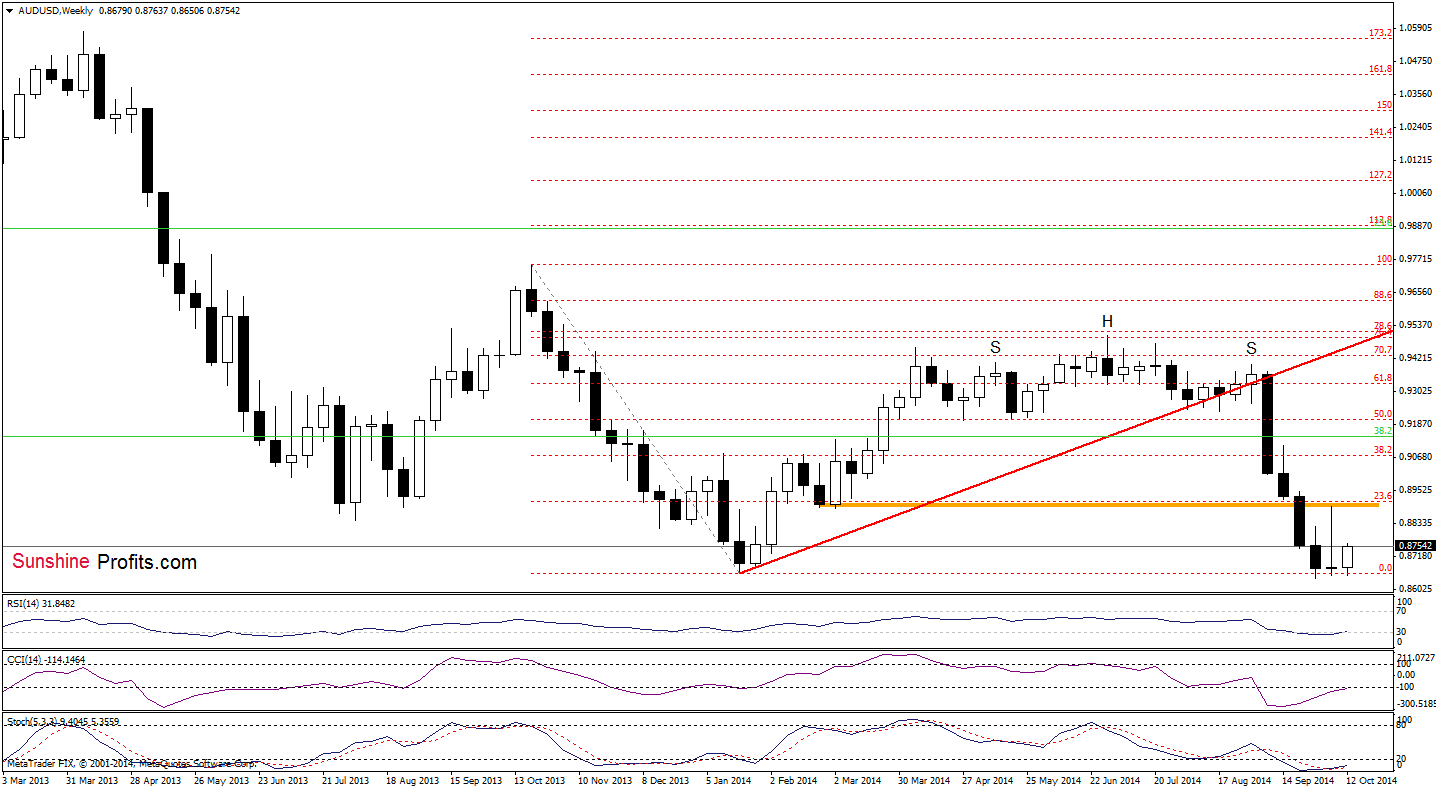
Quoting our previous Forex Trading Alert:
(…) the resistance level based on the Feb lows triggered a pullback. As a result, AUD/USD reversed and declined, which suggests that we may see a test of the strength of the recent lows in the coming day (or days). Although this scenario is currently reinforced by the position of the daily CCI and Stochastic Oscillator (which generated a sell signal), it seems to us that we won’t see another sizable downward move as weekly indicators are oversold and very close to generate buy signals.
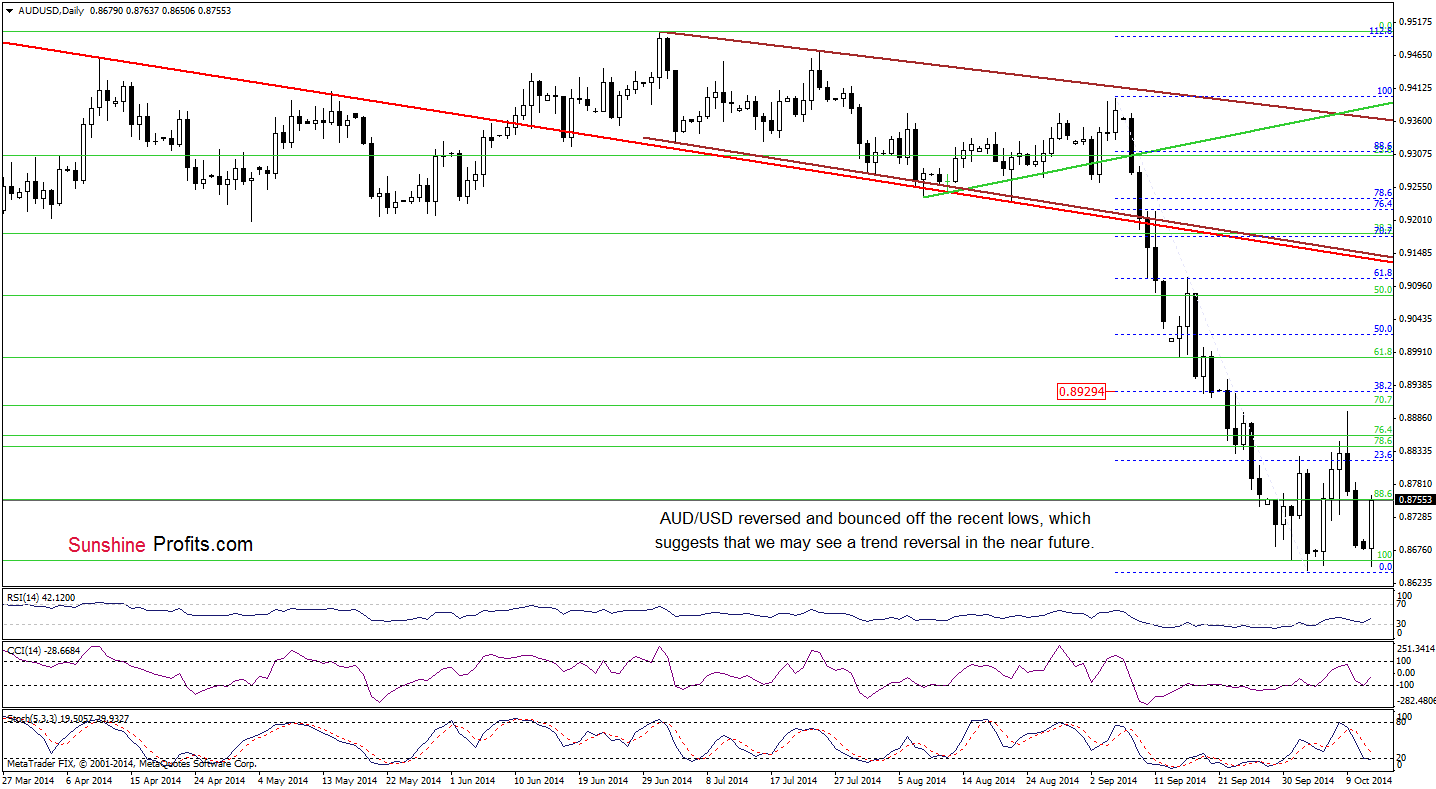
Looking at the above charts, we see that the situation developed in line with the above-mentioned scenario as AUD/USD moved lower and almost touched the Oct 6 low earlier today. Whith this downswin, the exchange rate reached the solid support zone, which triggered a sharp upswing in the following hours. Additionally, daily RSI and CCI generated buy signals, which suggests that trend reversal is just around the corner. Please keep in mind that the initial upside target for currency bulls will be the last week’s high of 0.8896 and then the 38.2% Fibonacci retracement at 0.8931.
Very short-term outlook: mixed with bullish bias
Short-term outlook: mixed
MT outlook: mixed
LT outlook: bearish
Trading position (short-term; our opinion): Long positions with a stop-loss order at 0.8587 are justified from the risk/reward perspective at the moment. We will keep you informed should anything change, or should we see a confirmation/invalidation of the above.
Thank you.
Nadia Simmons
Forex & Oil Trading Strategist
Przemyslaw Radomski, CFA
Founder, Editor-in-chief
Gold & Silver Trading Alerts
Forex Trading Alerts
Oil Investment Updates
Oil Trading Alerts

