
The last several weeks were quite rich in various meaningful technical developments in many currency pairs. The USD Index has also rallied very sharply, especially on Friday. It seems, however, that the tendencies that were prevailing in the previous weeks are no longer in place and the decline in the USD Index serves as a good example. What changed in the major currency pairs? Let’s take a closer look.
In our opinion, the following forex trading positions are justified - summary:
- EUR/USD: none
- GBP/USD: none
- USD/JPY: short (stop-loss order: 110.73; initial price target: 105.20)
- USD/CAD: short (stop-loss order: 1.1360; initial price target: 1.1021)
- USD/CHF: short (stop-loss order: 0.9711; initial price target: 0.9332)
- AUD/USD: long (stop-loss order: 0.8587; initial price target: 0.8943)
EUR/USD
In general, the European currency moved higher against the US Dollar, but the move was rather small yesterday. Consequently, what we wrote yesterday, remains up-to-date:
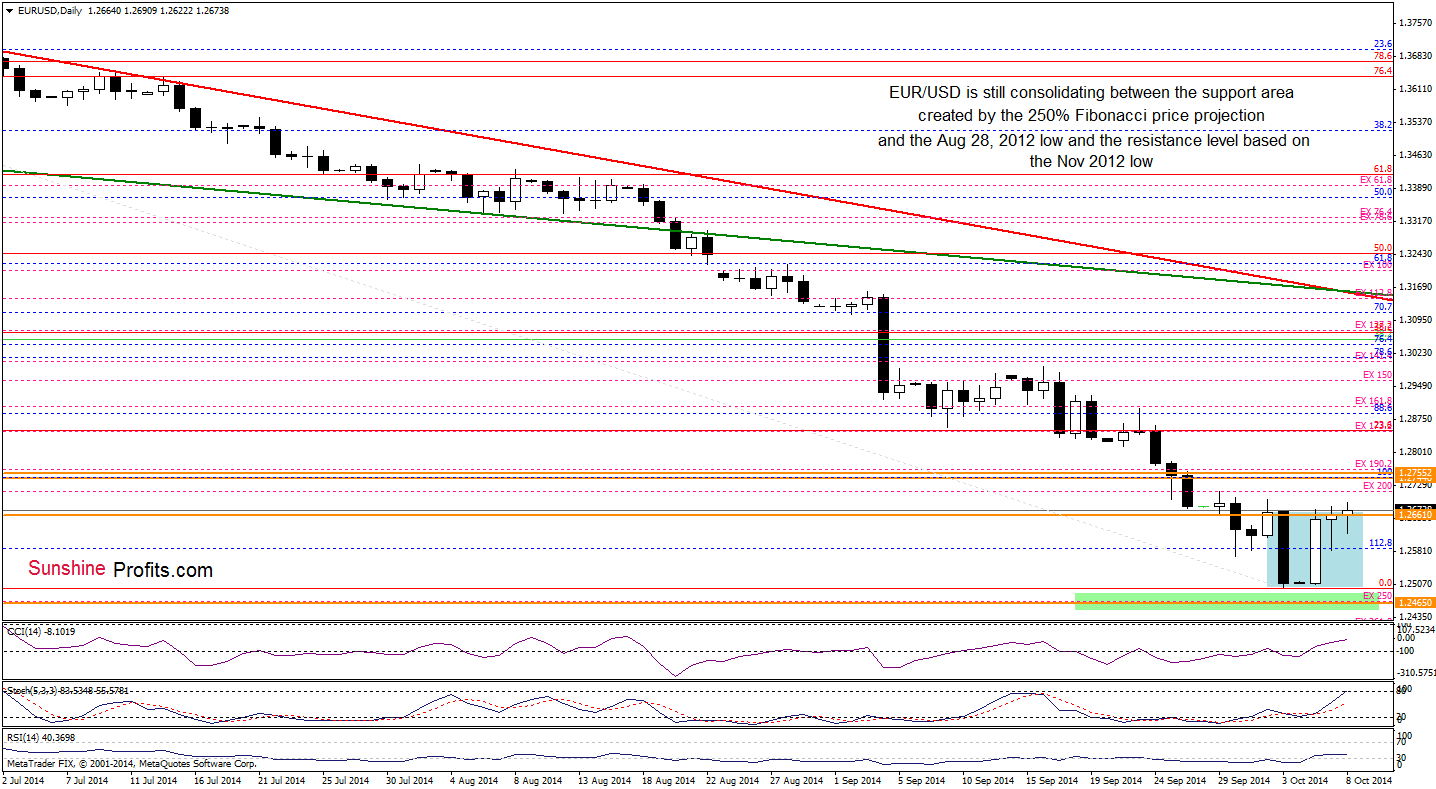
Looking at the above charts, we see that EUR/USD bounced off the solid green support zone, the resistance level based on the Nov 2012 low successfully stopped further improvement and triggered a pullback earlier today. Despite this small deterioration, the exchange rate is still trading in the consolidation between the above-mentioned support and resistance areas. Therefore, we believe that a breakout/breakdown will indicate the direction of future move. Although the pair could go both north or south from here, we think that even if the exchange rate moves little lower, the next bigger move will be to the upside as the combination of the 76.4% and 78.6% Fibonacci retracement levels and buy signals generated by all 3 daily indicators supports the bullish case at the moment.
Very short-term outlook: bullish
Short-term outlook: mixed with bullish bias
MT outlook: mixed
LT outlook: bearish
Trading position (short-term): In our opinion no positions are justified from the risk/reward perspective at the moment. We will keep you informed should anything change, or should we see a confirmation/invalidation of the above.
USD/JPY
It might not sound too exciting, but in case of the USD/JPY pair, not much changed either and our previous comments remain up-to-date. In short – the pair is likely to decline as it reached a combination of resistance levels and the situation in the USD Index seems bearish as well. In greater detail, we are quoting our previous comments on this pair:
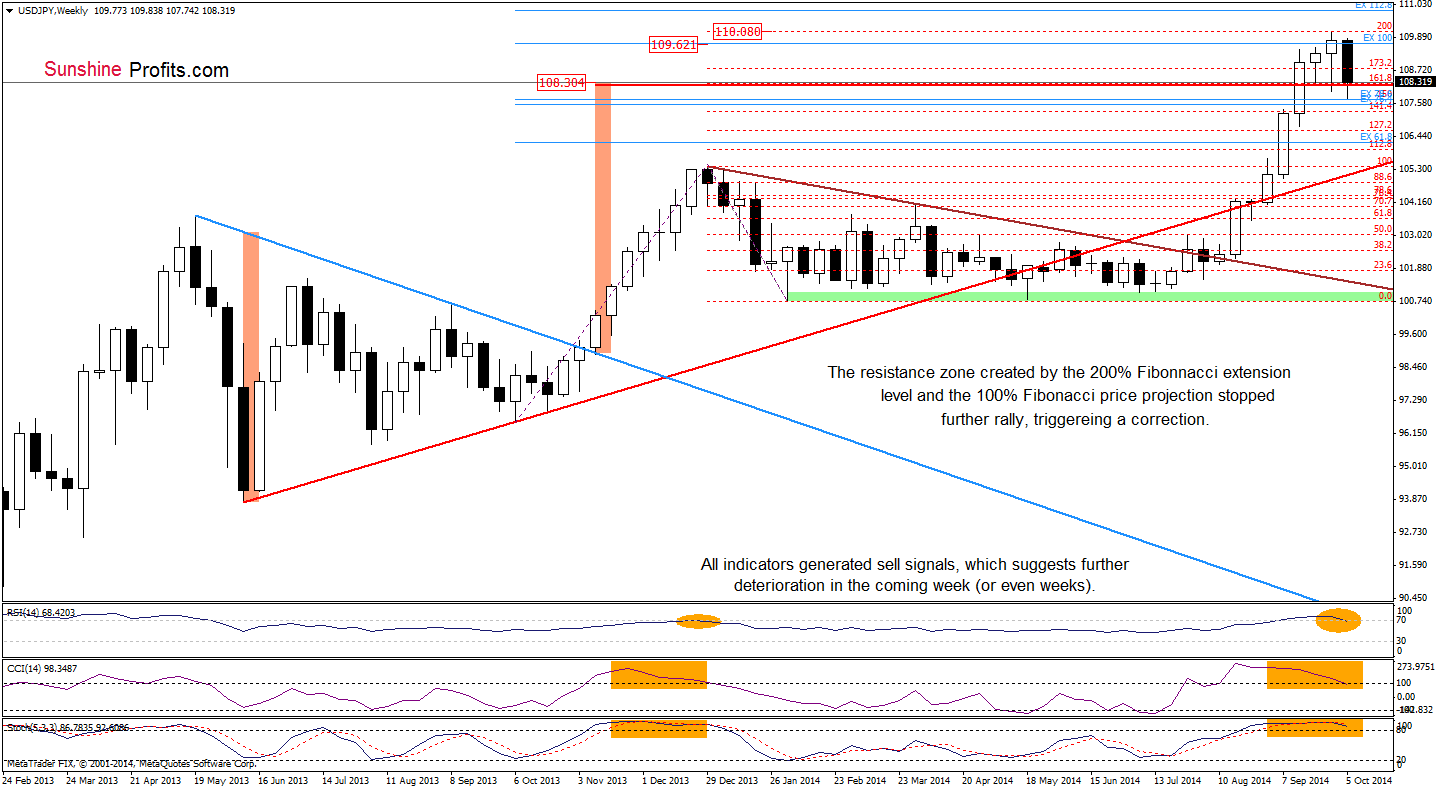
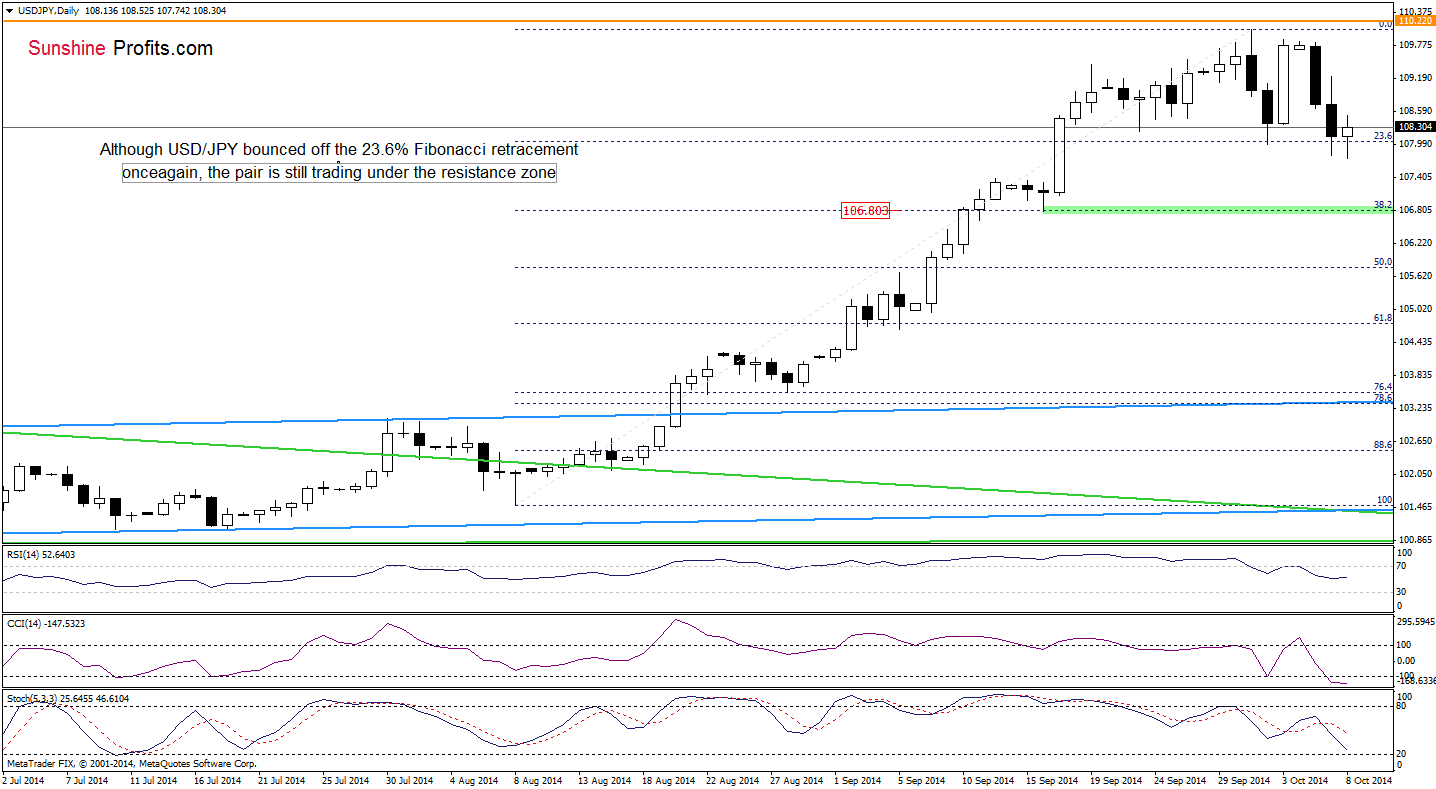
As you see on the above charts, although USD/JPY bounced off the 23.6% Fibonacci retracement based on the Aug-Sep rally and approached the recent high, the pair is still trading under the resistance zone created by the recent high and the 200% Fibonacci extension and 100% Fibonacci price projection. Therefore, we maintain our assumption from the previous commentary that the next bigger move will be to the downside. Please note that this scenario is currently reinforced by sell signals generated by the daily RSI and CCI (a correction will accelerate, if the weekly indicators also generate sell signals). In our opinion, the initial downside target will be the support area created by the Thursday’s low and the 23.6% Fibonacci retracement. If it is broken, the next target for currency bears will be around 106.80, where the 38.2% Fibonacci retracement and the bottom of the correction that we saw in mid-Sep is.
We would like to point out that the indicators have flashed sell signals. When the same happened after the previous significant rally (marked on the above chart with orange rectangles), a decline followed.
Very short-term outlook: bearish
Short-term outlook: mixed with bearish bias
MT outlook: mixed
LT outlook: bearish
Trading position (short-term; our opinion): Short positions with a stop-loss order at 110.23 are justified from the risk/reward perspective at the moment. We will keep you informed should anything change, or should we see a confirmation/invalidation of the above.
USD/CHF
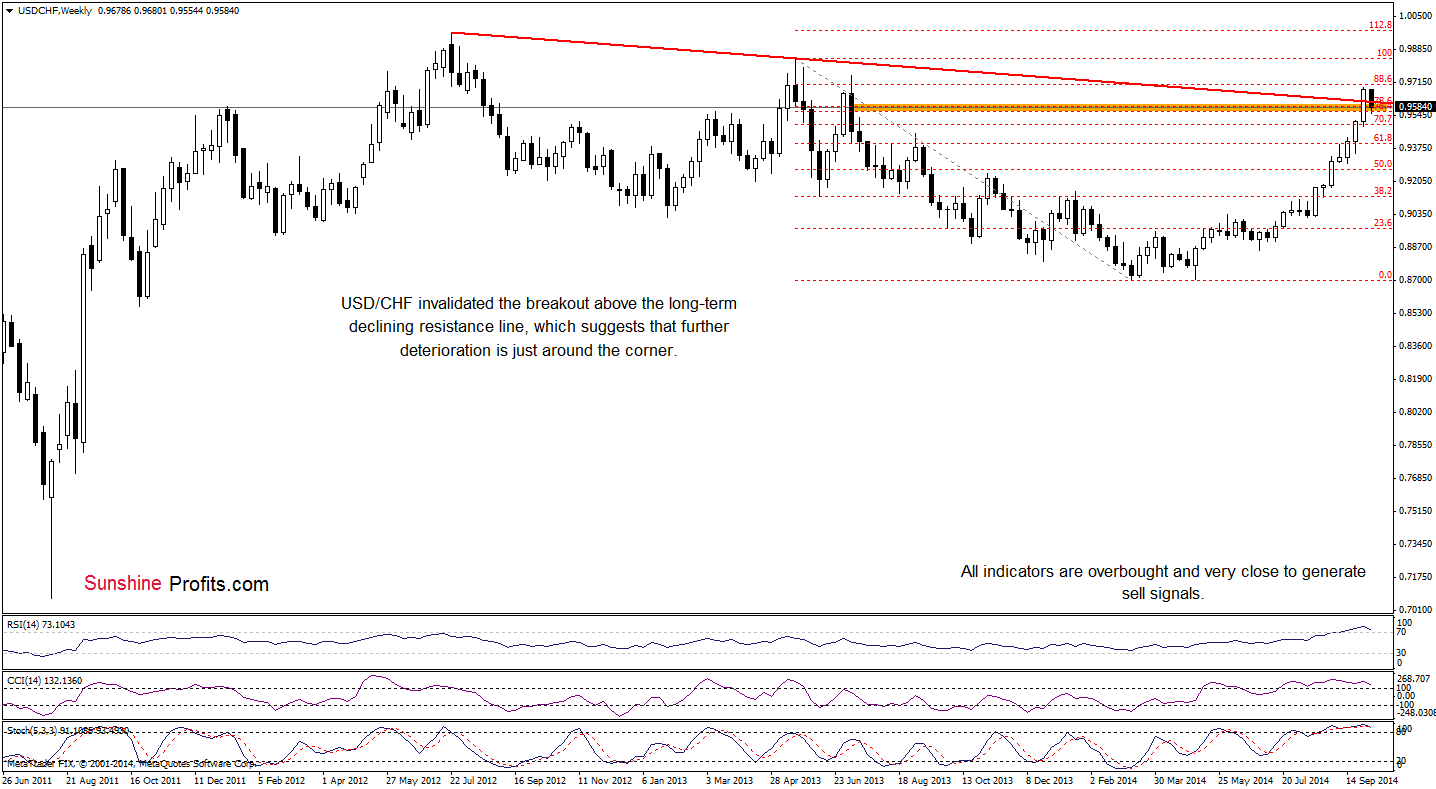
The most important thing that we would like to emphasize on the above chart is the invalidation of the breakout above the combination of resistance levels. The USD/CHF pair is now back below the declining support/resistance line, which is a bearish sign. The invalidation itself can be viewed as a sell signal. The outlook is bearish not only because of the long-term picture, but also due to the short-term developments, which you can see on the following chart.
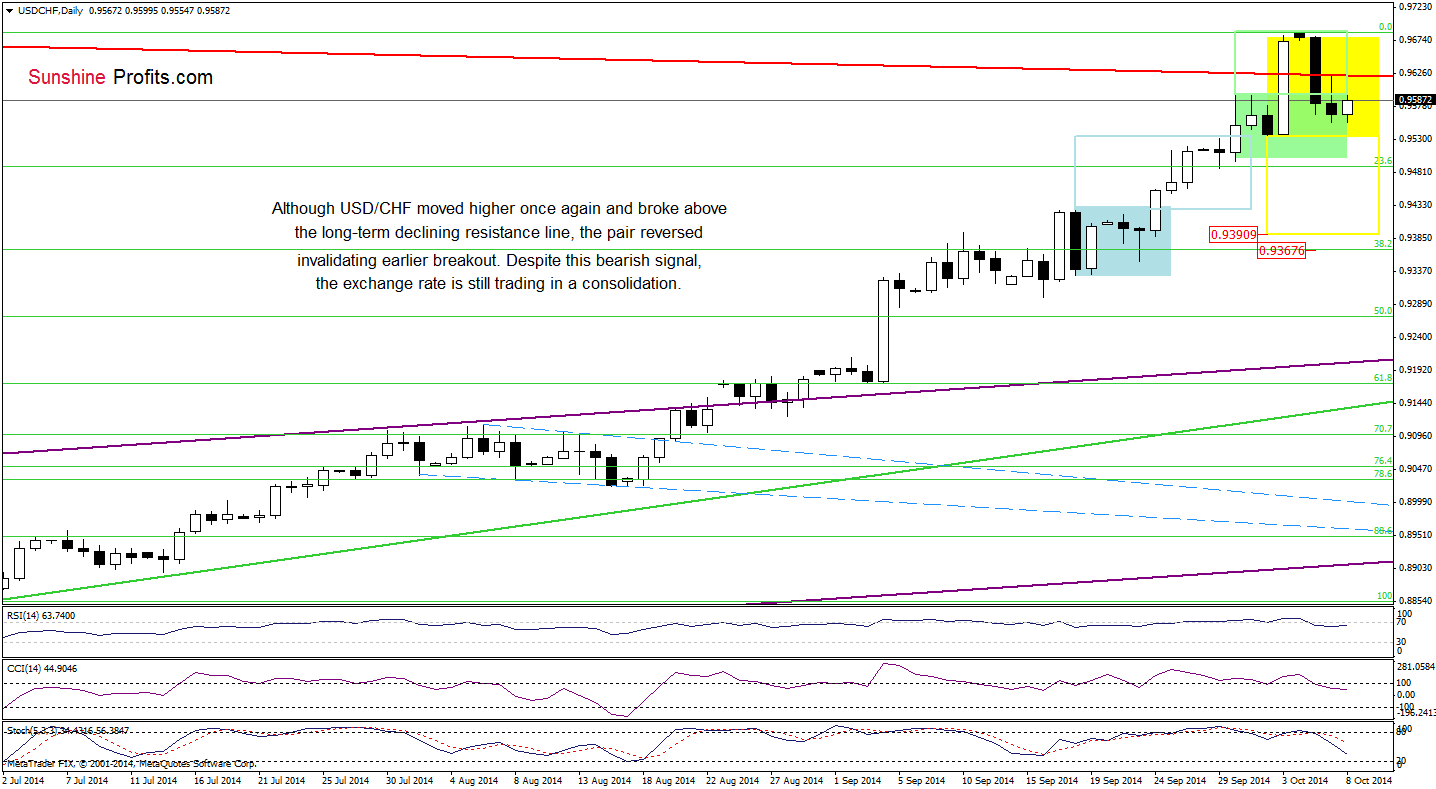
The implications of the short-term chart remain bearish and our previous comments remain up-to-date:
As you see, USD/CHF reached a very strong resistance zone created by the 76.4% and 78.6% Fibonacci retracement levels, which is additionally reinforced by the long-term red declining resistance line based on the Jul 2012 and May 2013 highs. When we take a closer look, we see that the proximity to this line was enough to trigger a correction in Jul 2013. What’s interesting, back then, all reading of the indicators were lower than now. All the above, provides us with bearish implications and suggests that a bigger correction is just around the corner.
Very short-term outlook: mixed with bearish bias
Short-term outlook: mixed with bearish bias
MT outlook: bearish
LT outlook: bearish
Trading position (short-term; our opinion): Short positions with a stop-loss order at 0.9711 are justified from the risk/reward perspective at the moment. We will keep you informed should anything change, or should we see a confirmation/invalidation of the above.
Thank you.
Nadia Simmons
Forex & Oil Trading Strategist
Przemyslaw Radomski, CFA
Founder, Editor-in-chief
Gold & Silver Trading Alerts
Forex Trading Alerts
Oil Investment Updates
Oil Trading Alerts

