
Yesterday, the ECB left its main refinancing rate at 0.05% and the deposit rate on overnight bank deposits at minus 0.2%. As a result, the USD Index , which tracks the performance of the greenback versus a basket of major currencies, has finally declined. What impact did this move have on major currency pairs? Did it change their short-term outlook?
In our opinion the following forex trading positions are justified - summary:
- EUR/USD: long (stop-loss order: 1.2527; initial price target: 1.3188)
- GBP/USD: none
- USD/JPY: short (stop-loss order: 110.73; initial price target: 105.20)
- USD/CAD: none
- USD/CHF: short (stop-loss order: 0.9711; initial price target: 0.9332)
- AUD/USD: long (stop-loss order: 0.8587; initial price target: 0.8943)
EUR/USD
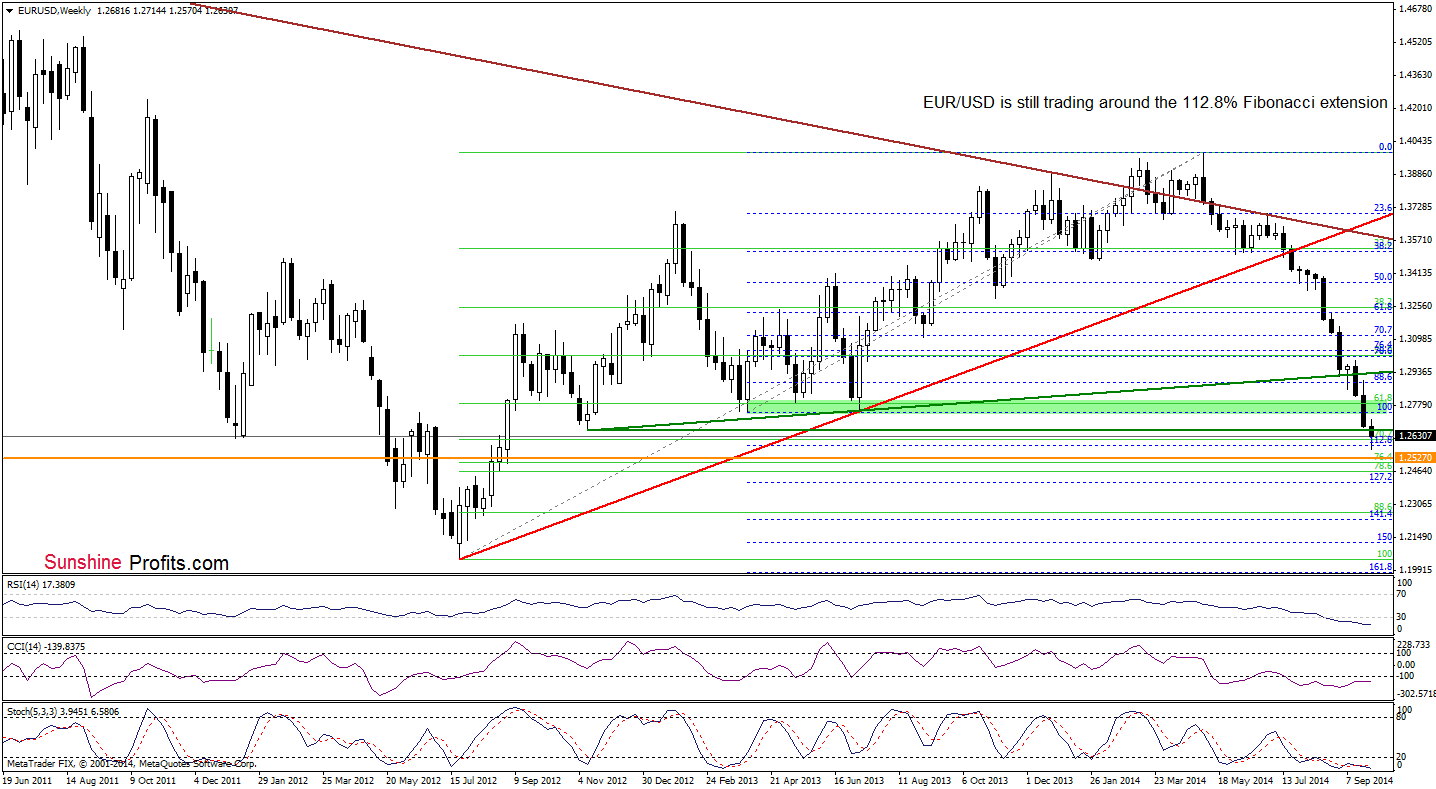
The situation in the medium-term hasn’t changed much as EUR/USD is still trading near the 112.8% Fibonacci retracement level, which serves as the nearest support. Will the very short-term picture give us more clues about future moves?
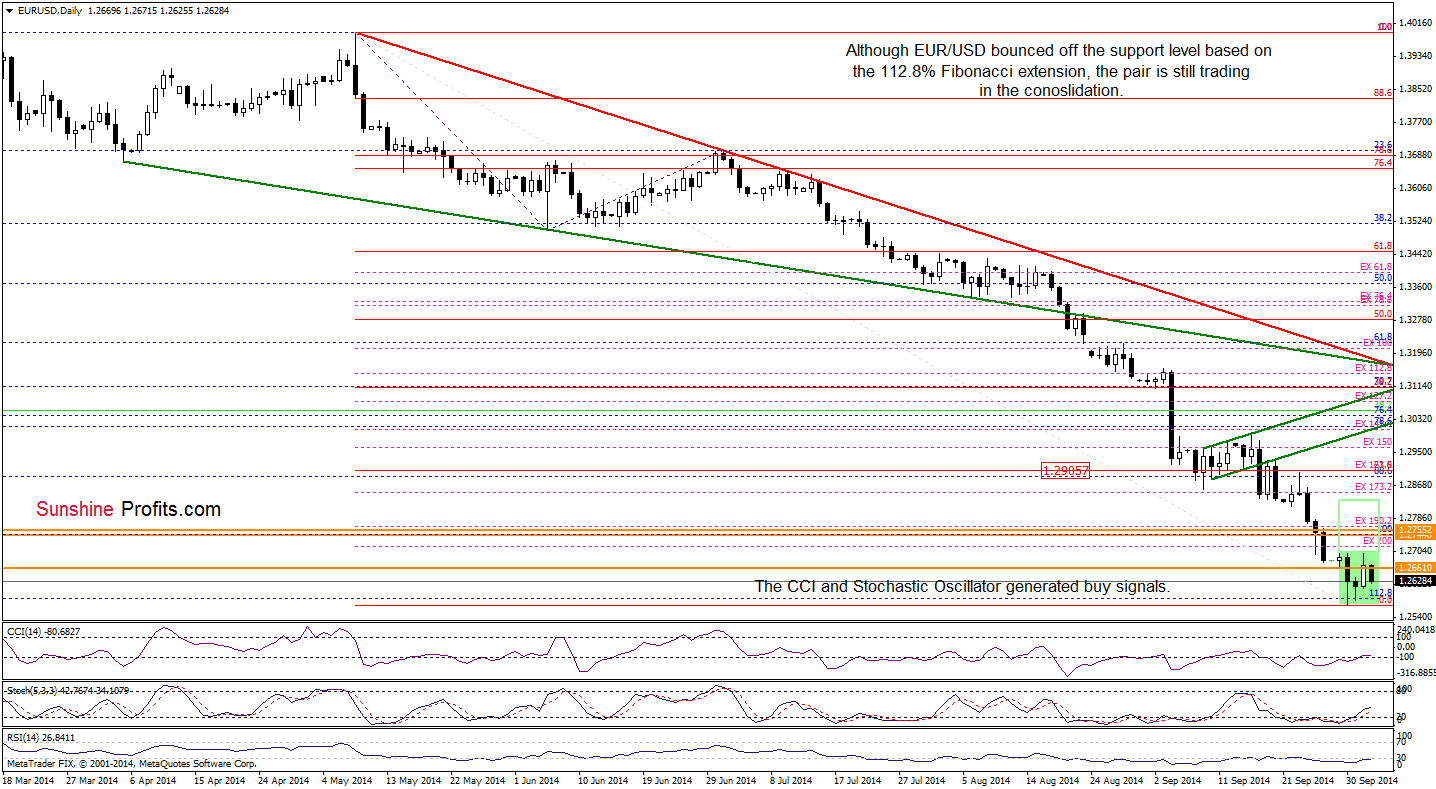
Looking at the above chart, we can say: not really. The reason? As you see although EUR/USD moved little higher yesterday, the pair erased most of this gain earlier today. Despite this price action, the exchange rate is trading in a consolidation between the Tuesday’s high and low. Although, the pair could go both north or south from here, it seems to us that buy signals generated by the CCI and Stochastic Oscillator will encourage currency bulls to push the buy button. If this is the case, and the pair breaks above the upper line of the formation, we may see an increase to around 1.2905, where the 23.6% Fibonacci retracement (based on the entire May-Sep decline) and the Sep 23 high are.
Very short-term outlook: bullish
Short-term outlook:mixed with bullish bias
MT outlook: mixed
LT outlook: bearish
Trading position (short-term; our opinion): Long positions with a stop-loss order at 1.2527 are justified from the risk/reward perspective at the moment. We will keep you informed should anything change, or should we see a confirmation/invalidation of the above.
GBP/USD
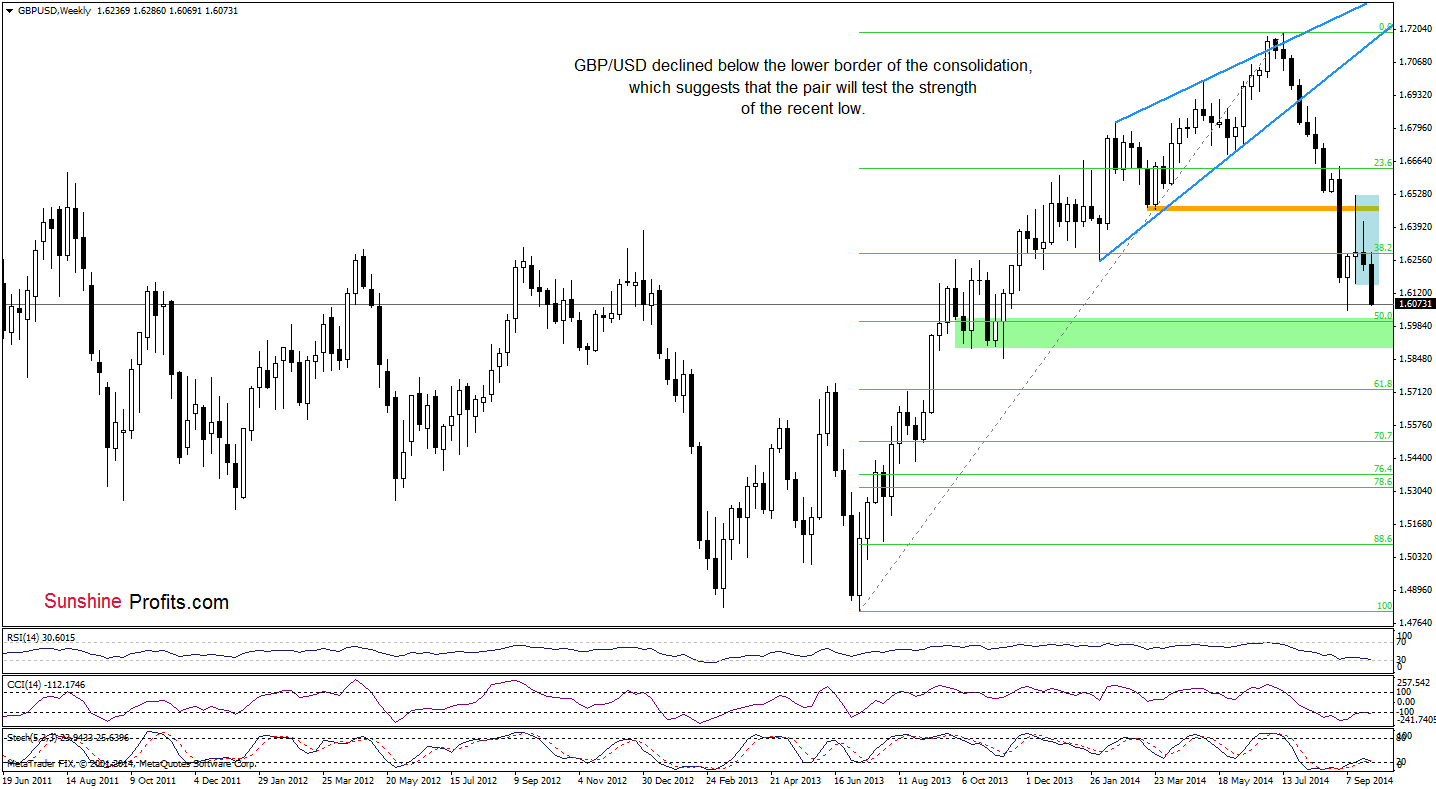
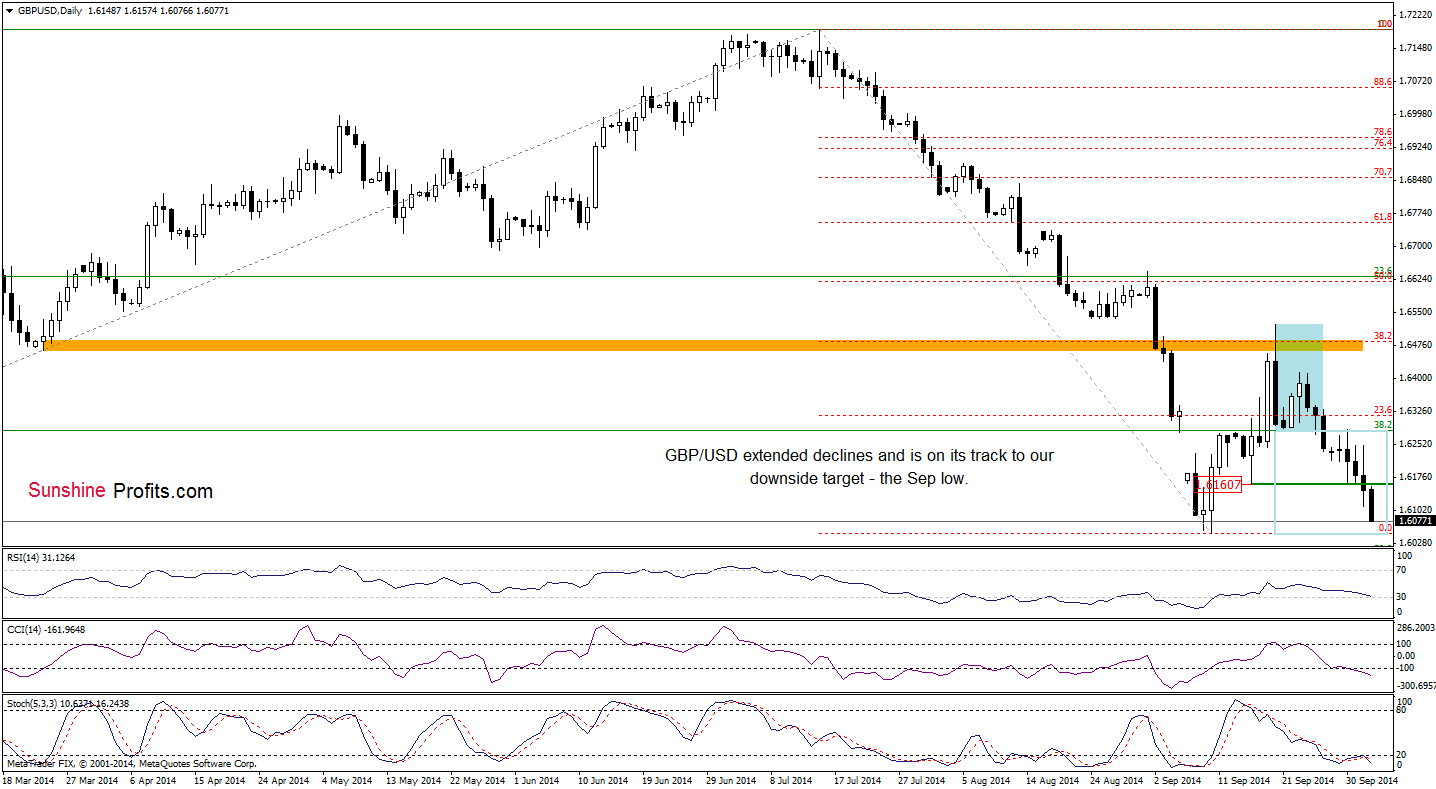
On the above charts, we clearly see that the overall situation has deteriorated as GBP/USD declined not only below the support level (created by the Sep 16 low), but also under the lower border of the consolidation (marked with blue on the weekly chart). Taking these facts into account, we believe that our commentary posted on Sep 23 is still up-to-date:
(…) What’s next? The current position of the CCI and Stochastic Oscillator suggests that GBP/USD will likely test the strength of the lower border of the formation. If it’s broken, we’ll see a drop to 1.6161 (the Sep 16 low) or even a test of the Sep low of 1.6051.
Please note that if this support level doesn’t withstand the selling pressure (which is quite possible as there is no buy signals supporting the bullish case), we’ll see a drop to the 50% Fibonacci retracement level or even a test of the barrier of 1.6000.
Very short-term outlook: bearish
Short-term outlook: mixed with bearish bias
MT outlook: mixed
LT outlook: mixed
Trading position (short-term): In our opinion, no positions are justified from the risk/reward perspective. We will keep you informed should anything change, or should we see a confirmation/invalidation of the above.
USD/JPY
Quoting our last commentary on this currency pair:
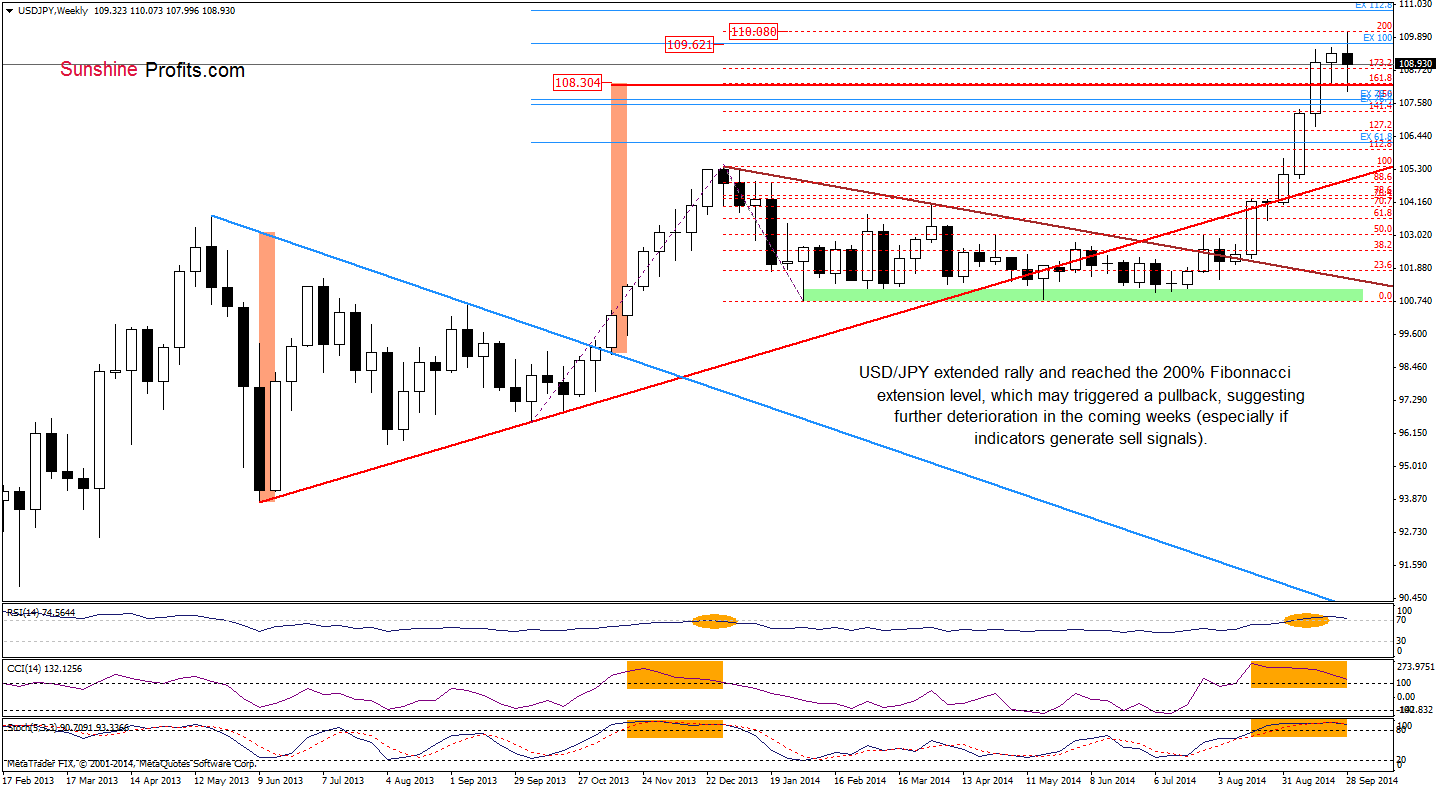
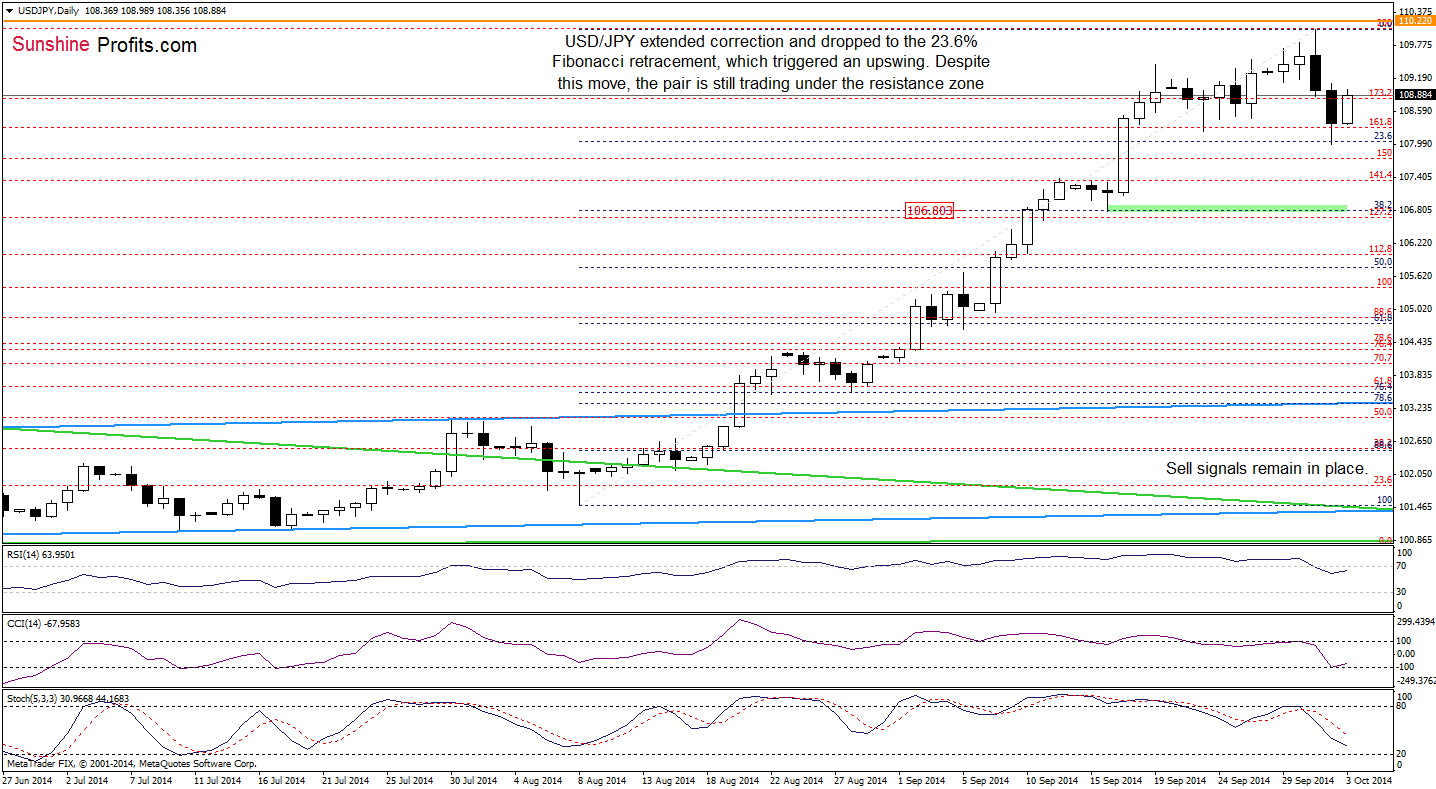
(…) the 200% Fibonacci extension stopped further improvement, triggering a corrective downswing. With this move, the pair slipped below the 100% Fibonacci price projection and the recent highs, invalidating earlier brakout. Taking this fact into account, and combining it with the current position of the indicators (not only daily, but also weekly), we still believe that the next move will be to the downside.
As you see on the above charts, the situation developed in line with our bearish scenario and USD/JPY reached the 23.6% Fibonacci retracement based on the Aug-Sep rally. Although this support level triggered an upswing, the exchange rate stil remains under the resistance zone created by the recent high and the above-mentioned 200% Fibonacci extension and 100% Fibonacci price projection. Therefore, we maintain our assumption from the previous commentary that the next bigger move will be to the downside – especially in light of the current situation in the USD Index that we discussed in our yesterday’s Forex Trading Alert.
Very short-term outlook: bearish
Short-term outlook: mixed with bearish bias
MT outlook: mixed
LT outlook: bearish
Trading position (short-term; our opinion): Short positions with a stop-loss order at 110.23 are justified from the risk/reward perspective at the moment. We will keep you informed should anything change, or should we see a confirmation/invalidation of the above.
USD/CAD
In our Forex Trading Alert posted on Wednesday, we wrote the following:
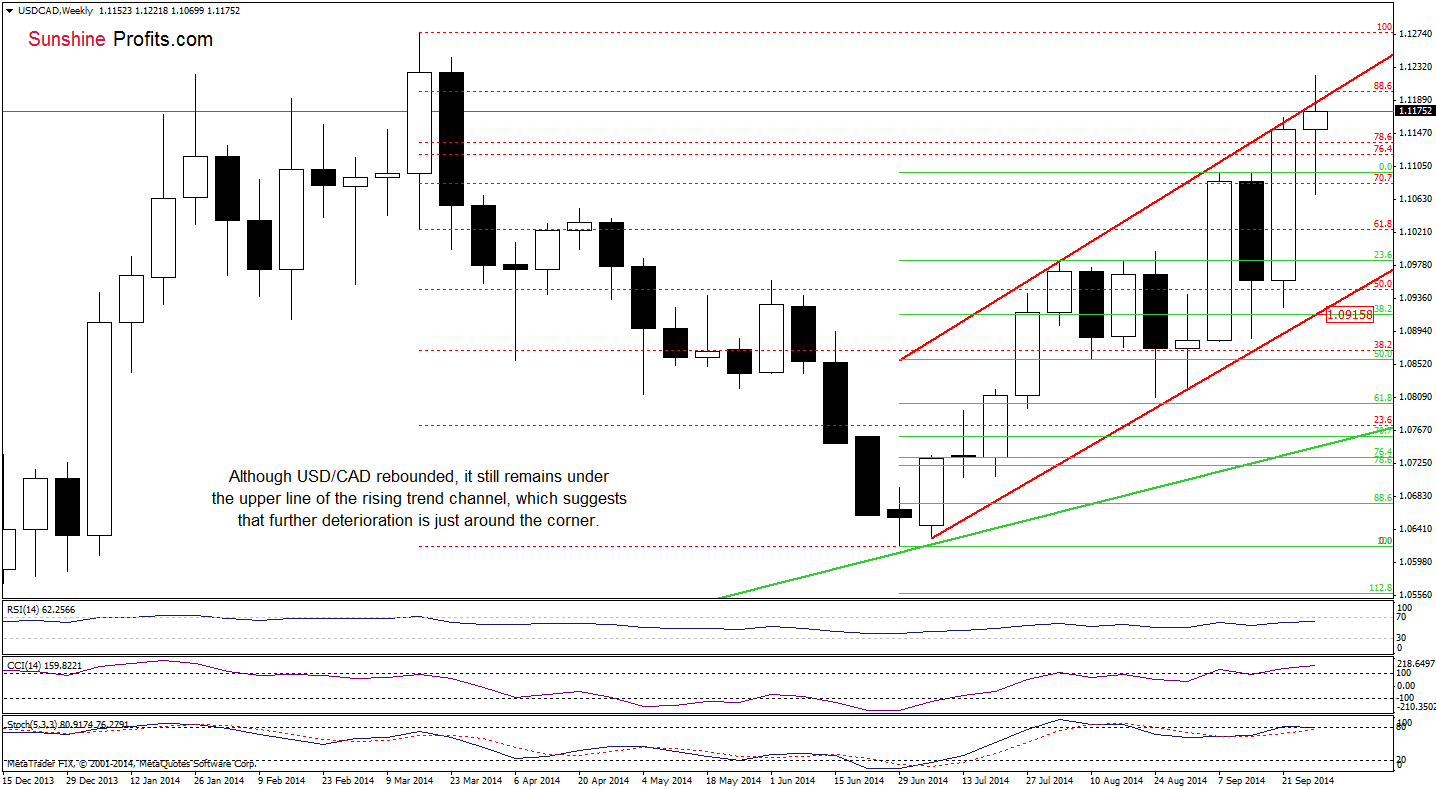
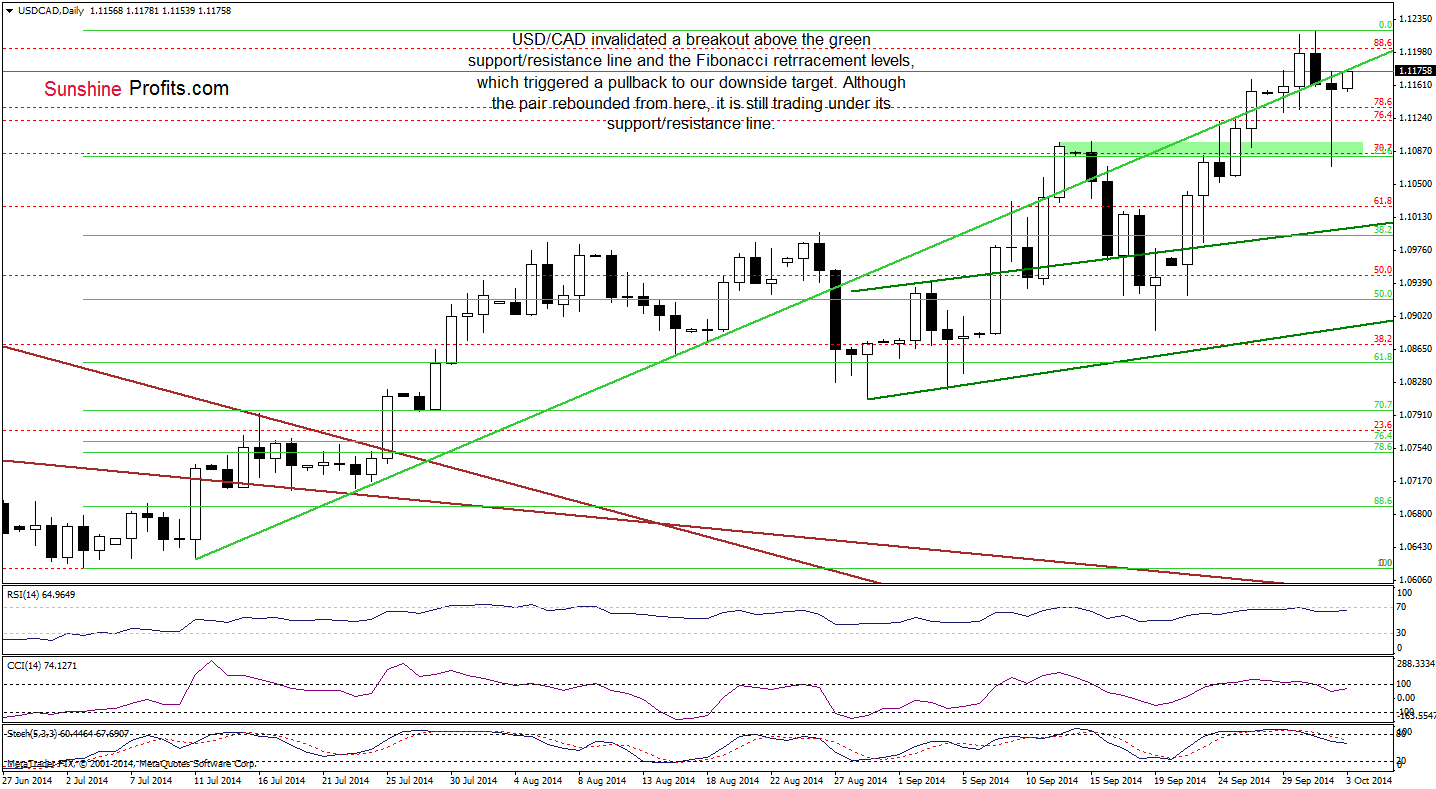
The first thing that catches the eye on the above chart is an invalidation of the breakout above the key resistance line – the upper border of the rising trend channel. Although the week is not over yet, this is a negative signal, which suggests that we may see further deterioration in the coming days. Taking this fact into account, and combining it with the very short-term picture (which shows that the pair is close to invalidate the breakout above the green support/resistance line, while the RSI and Stochastic Oscillator generated sell signals), it seems to us that the next bigger move will be to the downside. If this is the case, the initial downside target will be around 1.1097, where the mid-Sep high is. Please note that in this area is also the 23.6% Fibonacci retracement (based on the entire Jul-Oct rally (marked on the daily chart).
The above charts clearly shows that currency bears realized the above-mentioned scenario as we expected. As you see, USD/CAD reached our downside target yesterday, which reduced theselling pressure and resulted in an upswing. Although the pair extended gains earlier today, the exchange rate is still trading under its key support/resistance green line. What’s next? If it stops further rally, we’ll see another pullback from here and the initial terget would be yesterday’s low and the green support area. On the other hand, even if currency bulls manage to push the pair higher, we think that the upper line of the rising trend channel (marked on the weekly chart) in combination with the 88.6% Fibonacci retracement will be strong enough to stop further improvement and trigger a correction from here.
Very short-term outlook: bearish
Short-term outlook: bearish
MT outlook: mixed with bearish bias
LT outlook: bearish
Trading position (short-term): In our opinion no positions are justified from the risk/reward perspective at the moment. We will keep you informed should anything change, or should we see a confirmation/invalidation of the above.
USD/CHF
Quoting our Forex Trading Alert posted on Sep 24:
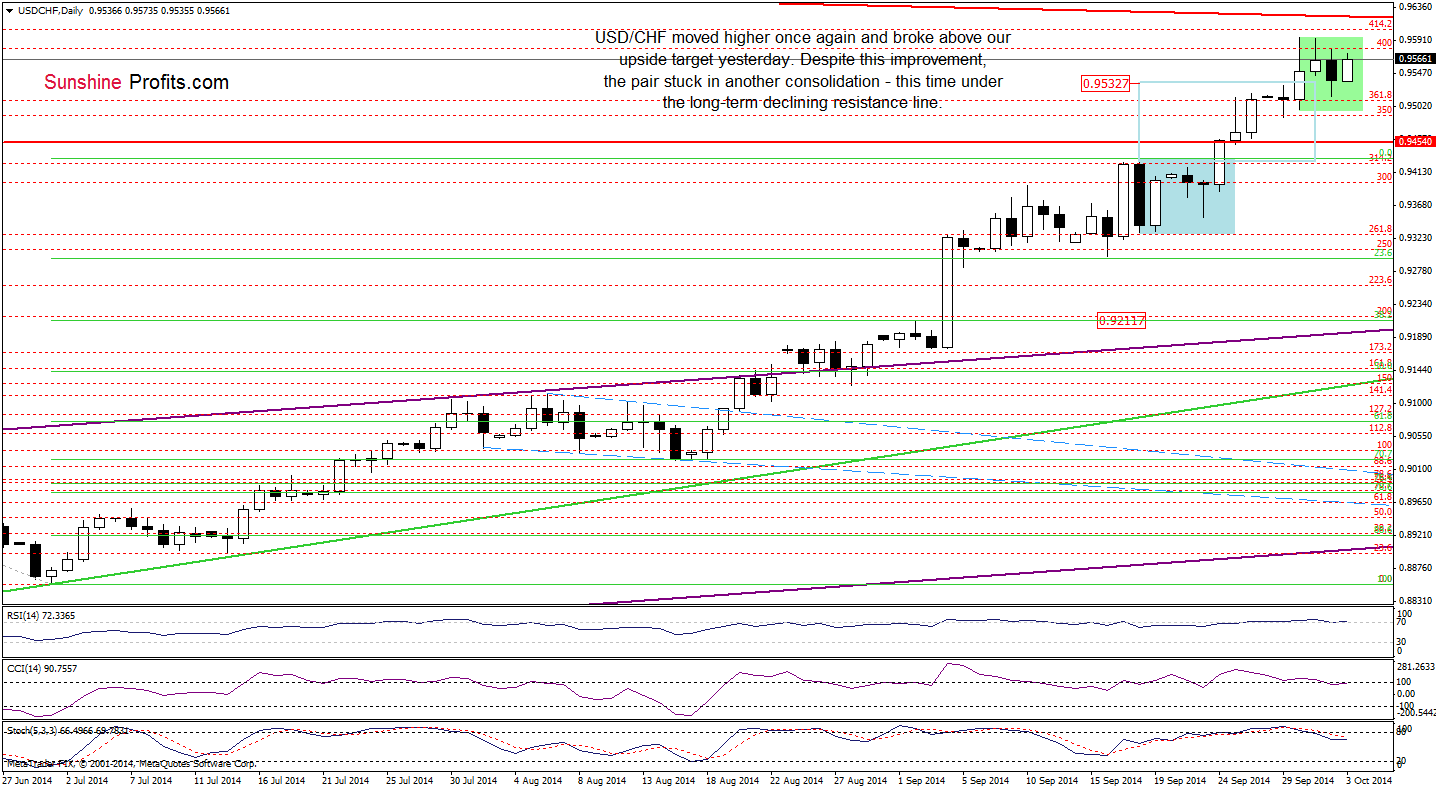
(...) The first thing that catches the eye on these charts is a breakout above the recent high and the upper line of the consolidation. This bullish signal suggests further improvement and an increase to around 0.9532, where the size of the upswing will correspond to the height of the formation (in this area is also the next resistance zone marked on the weekly chart).
Looking at the above charts, we see that despite a small pullback on Monday, currency bulls not only managed to push the pair to our upside target, but the exchange rate also climbed to the 414.2% Fibonacci extension. Since then USD/CHF has been trading in another consolidation (marked with green). Where the pair head next? Taking into account the current position of the indicators (the RSI is overbought, while the CCI and Stochastic Oscillator generated sell signals), we think that the next sizable move will be to the downside. At this point, we must mention that even more bearish picture emerges from the weekly chart. Let’s take a look.
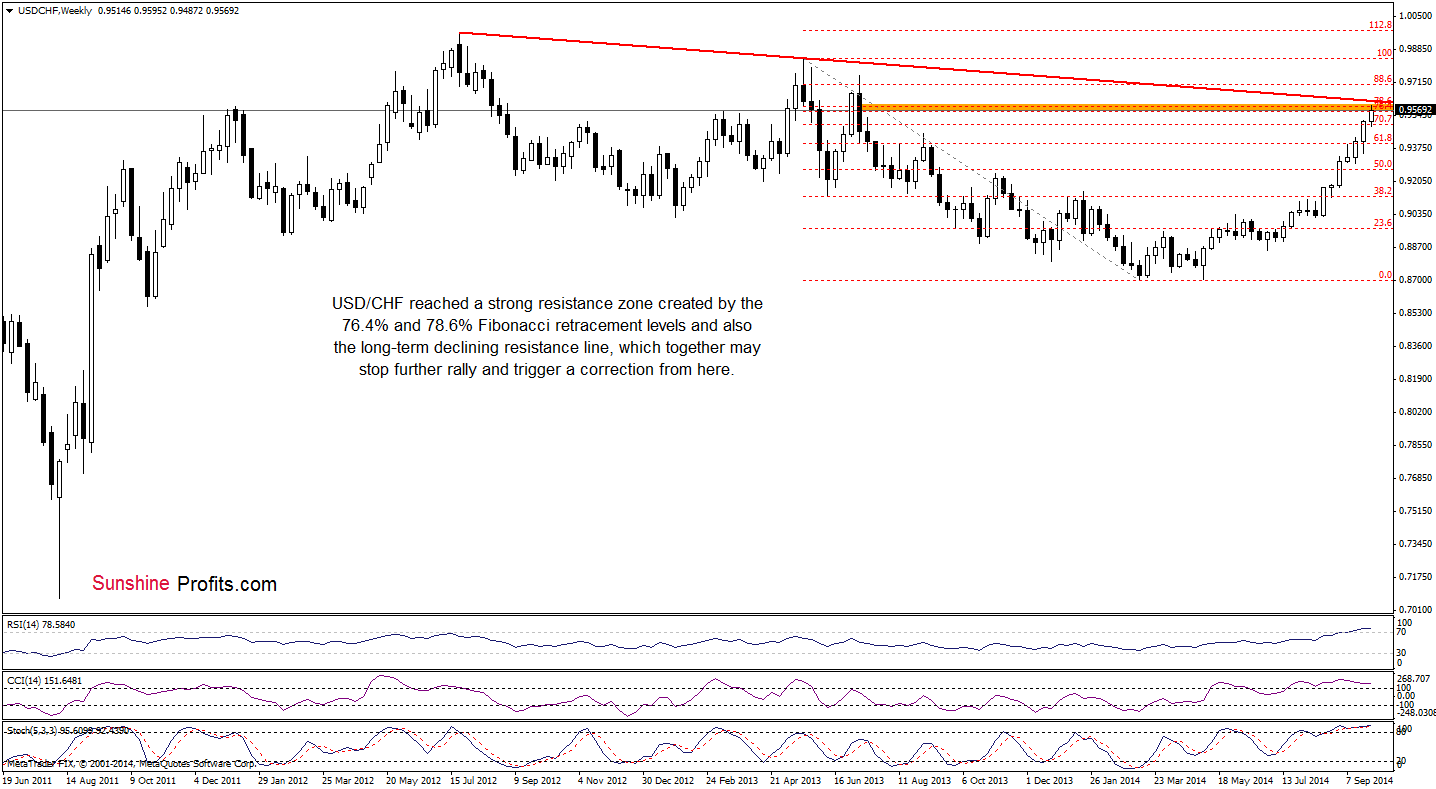
As you see, USD/CHF reached a very strong resistance zone created by the 76.4% and 78.6% Fibonacci retracement levels, which is additionally reinforced by the long-term red declining resistance line based on the Jul 2012 and May 2013 highs. When we take a closer look, we see that the proximity to this line was enough to trigger a correction in Jul 2013. What’s interesting, back then, all reading of the indicators were lower than now. All the above, provides us with bearish implications and suggests that a bigger correction is just around the corner.
Very short-term outlook: mixed with bearish bias
Short-term outlook: mixed with bearish bias
MT outlook: bearish
LT outlook: bearish
Trading position (short-term; our opinion): Short positions with a stop-loss order at 0.9711 are justified from the risk/reward perspective at the moment. We will keep you informed should anything change, or should we see a confirmation/invalidation of the above.
AUD/USD
In our last commentary on this currency pair, we wrote the following:
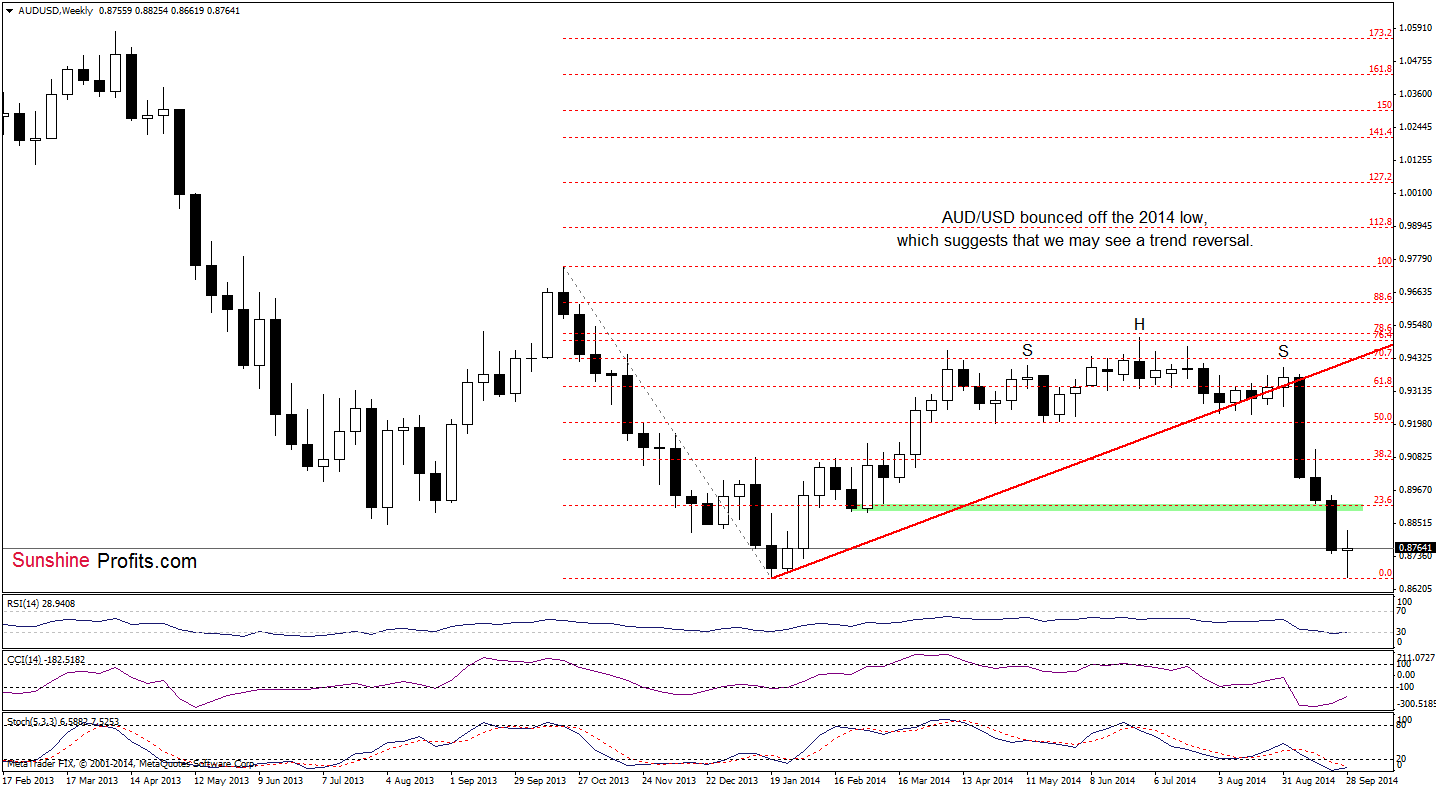
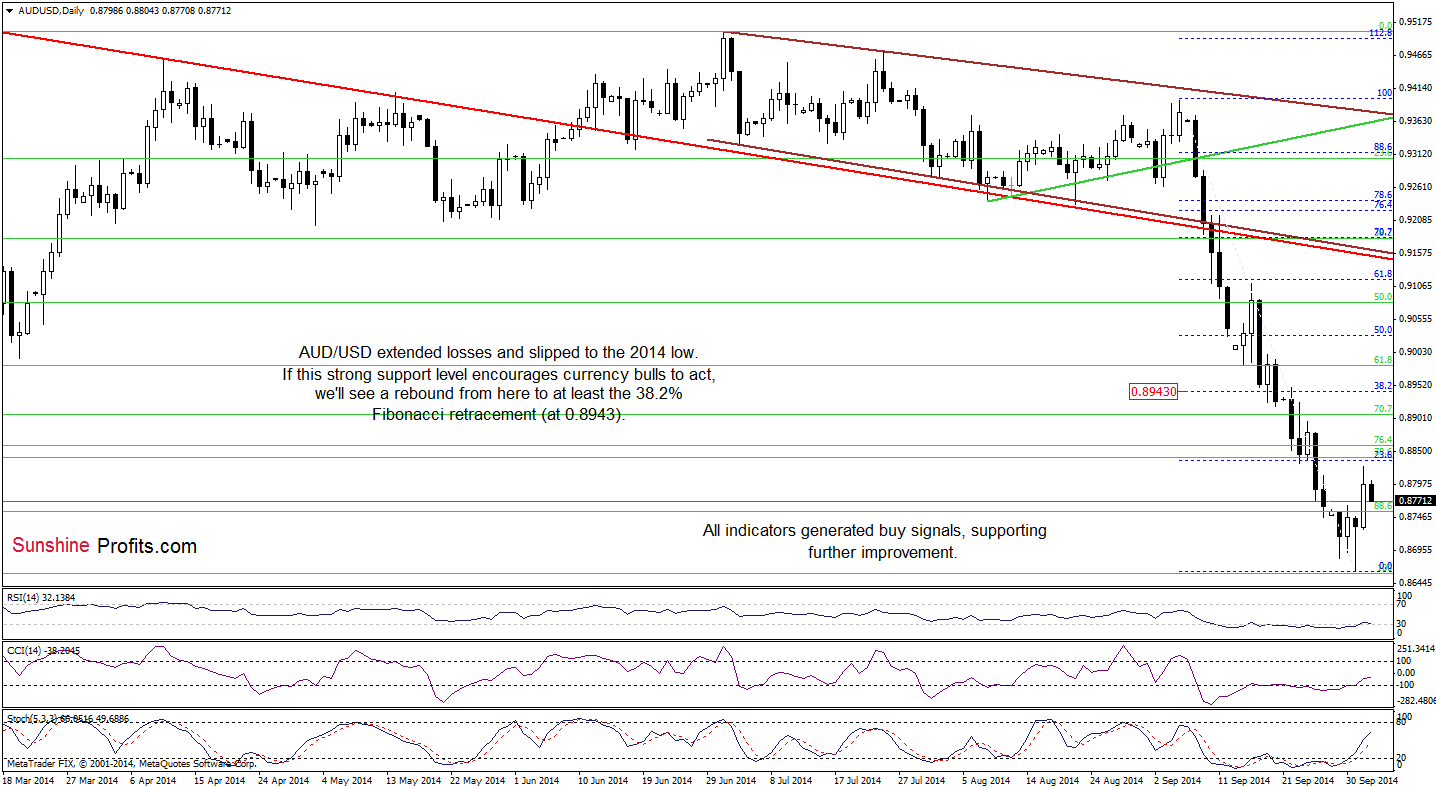
(…) AUD/USD extended declines and approached the 2014 low. If this solid support level holds, we may see a trend reversal in the coming week (…) we clearly see positive divergences between all indicators and the exchange rate, which suggests that a pause or corrective upswing is just around the corner (especially if the indicators generate buy signals). If this is the case, the initial upside target will be (…) the 38.2% Fibonacci retracement based on the recent declines
As you see on the above charts, the situation developed in line with the above-mentioned scenario and AUD/USD rebounded after a drop to the 2014 low. Taking this fact into account, and combining it with buy signals generated by all 3 indicators, we think that the next move will be to the upside and the initial target for currency bulls would be around 0.8943, where the 38.2% Fibonacci retracement based on the recent declines is.
Very short-term outlook: mixed with bullish bias
Short-term outlook: mixed
MT outlook: mixed
LT outlook: bearish
Trading position (short-term; our opinion): Long positions with a stop-loss order at 0.8587 are justified from the risk/reward perspective at the moment. We will keep you informed should anything change, or should we see a confirmation/invalidation of the above.
Thank you.
Nadia Simmons
Forex & Oil Trading Strategist
Przemyslaw Radomski, CFA
Founder, Editor-in-chief
Gold & Silver Trading Alerts
Forex Trading Alerts
Oil Investment Updates
Oil Trading Alerts

