
Earlier today, official data showed that U.S. new home sales data rose 18.0% in August to 504,000 units, beating expectations for a 4.4% gain (it’s worth noting that it was the highest level since May 2008). As a result, USD/CHF hit a fresh 2014 high and reached resistance area. Will it be strong enough to stop currency bulls?
In our opinion the following forex trading positions are justified - summary:
EUR/USD
Yesterday, we wrote the following:
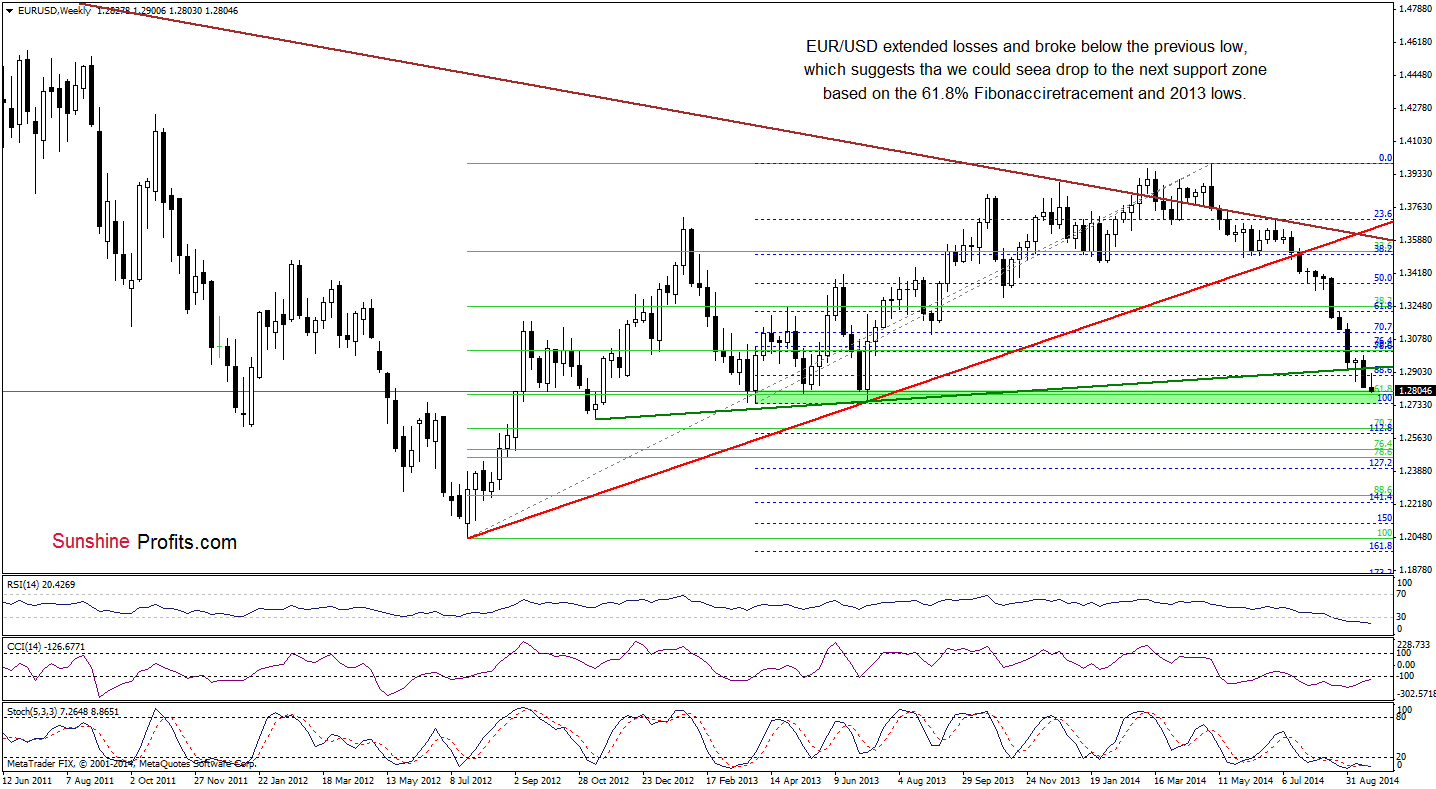
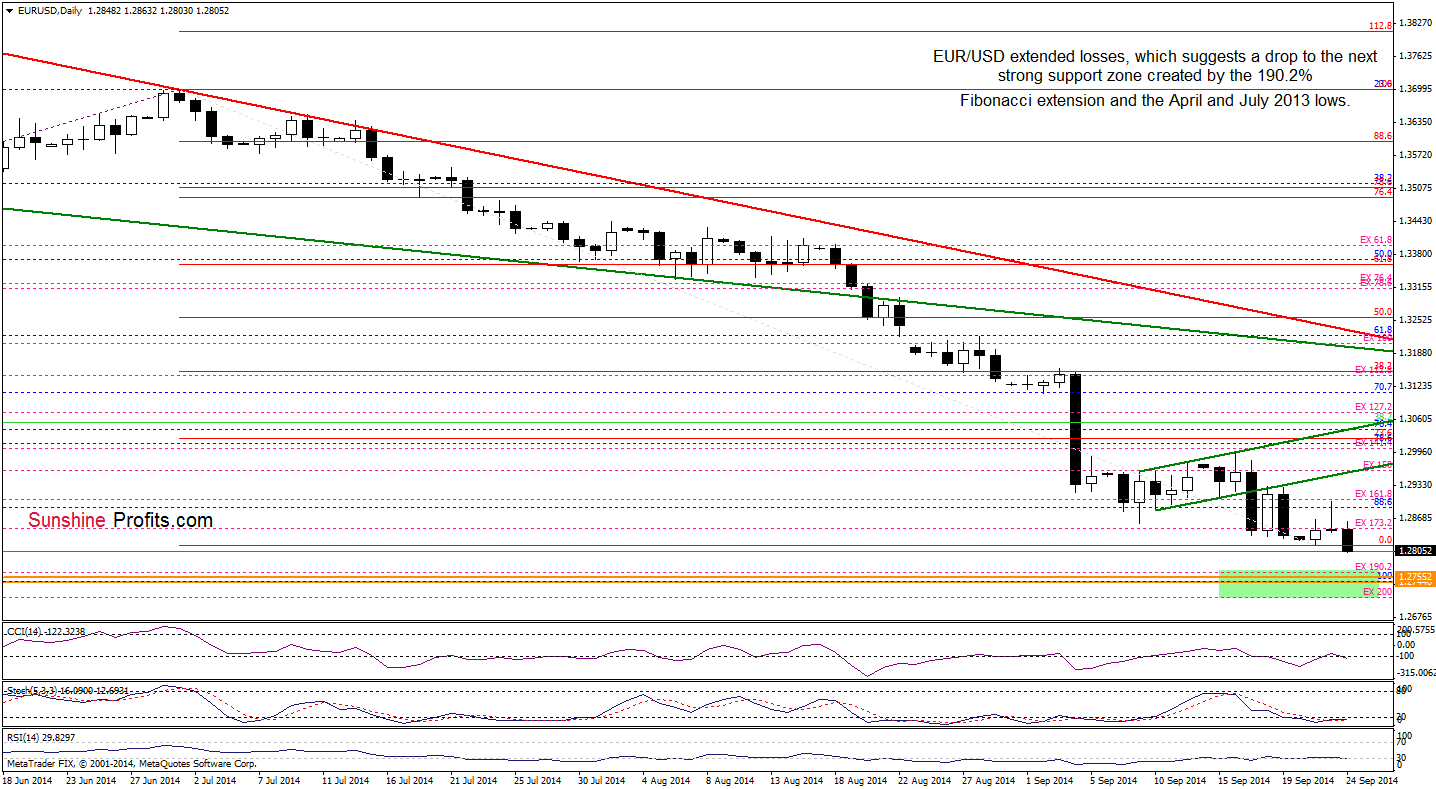
(…) although EUR/USD moved higher, the pair is still trading well below the previously-broken lower border of the rising trend channel. Therefore, we think that as long as there is no invalidation of a breakdown below this key line, another attempt to move lower can’t be ruled out. If this is the case, the initial downside target would be the recent low of 1.2816. If it’s broken, we could see a drop to the green support zone (around 1.2745-1.2755) created by the Apr and Jul 2013 lows and the 61.8% Fibonacci retracement.
Looking at the above charts, we clearly see that the situation developed in line with the above-mentioned scenario as EUR/USD extended losses and dropped below the previous low. Taking this negative signal into account, we believe that currency bears will push the exchange rate to our downside target in the coming days.
Very short-term outlook: bearish
Short-term outlook: bearish
MT outlook: bearish
LT outlook: bearish
Trading position (short-term): In our opinion, no positions are justified from the risk/reward perspective. We will keep you informed should anything change, or should we see a confirmation/invalidation of the above.
USD/CAD
In our last commentary on this currency pair we wrote:
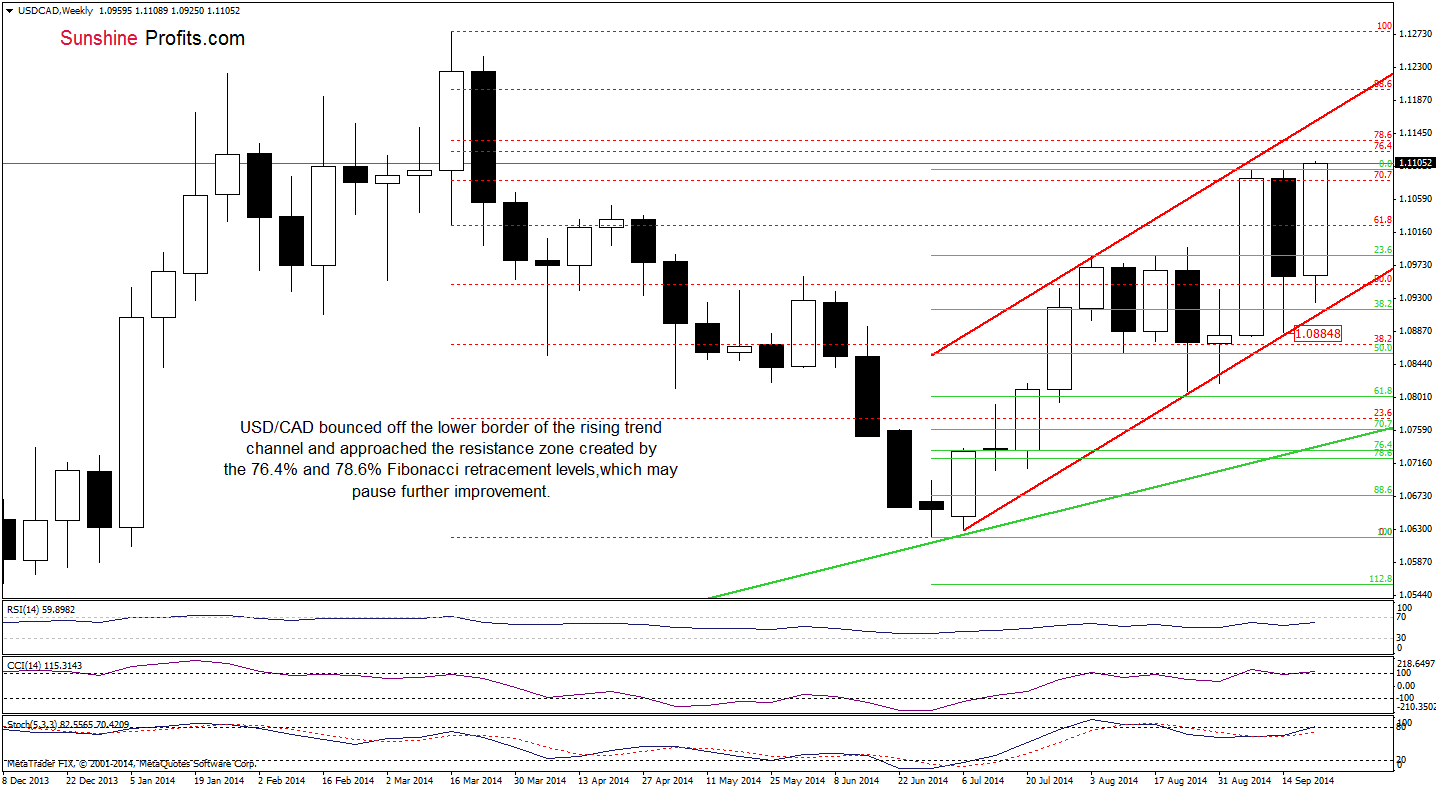
(…) the exchange rate invalidated a breakout above the recent highs. This is a bearish signal, which suggests that USD/CAD will likely test the strenght of the red support line (around 1.0885), which is also the lower border of the rising trend channel. Please note that this scenario is currently reinforced by sell signals generated by the indicators.
The above chart clearly shows that the pair slipped to our downside target in the previous week. As you see, this strong support triggered a sharp rally, which took the pair above the previous high. With this upswing, USD/CAD also approached a strong resistance zone created by the 76.4% and 78.6% Fibonacci retrecement levels, which will likely pause (or even stop) further improvement. If this is the case, and the pair invalidates a breakout, it will be a strong bearish signal, which will likely trigger another downward move to the lower border of the rising trend channel (curently around 1.0907). Will the daily chart give us more clues about future moves? Let’s check.
Quoting our Forex Trading Alert posted on Sep 18:
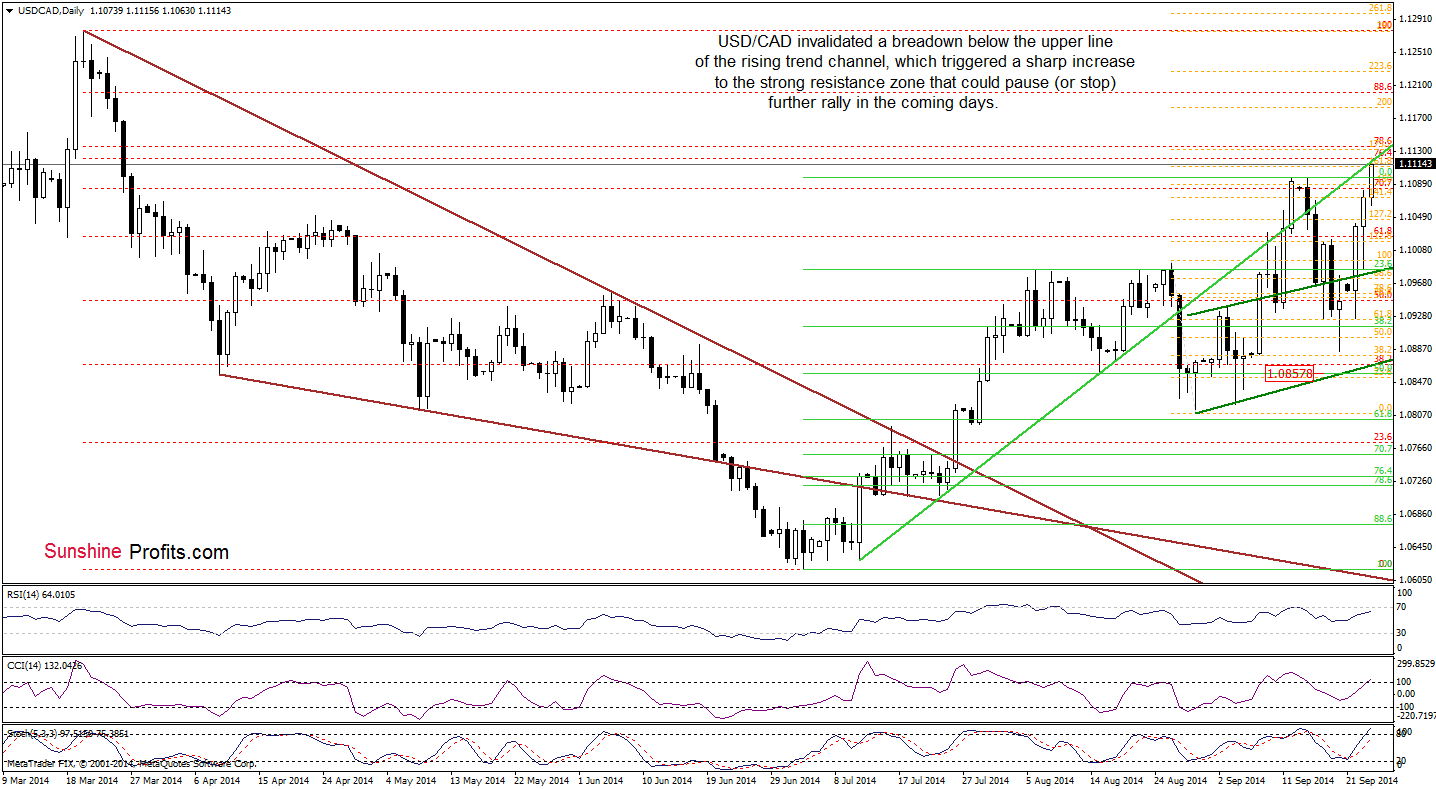
(…) we believe that USD/CAD will extend the current correction to at least 1.0915, where the 38.2% Fibonacci retracement (based on the entire Jul-Sep rally) is.
As you see on the daily chart, currency bears realized the above-mentioned scenario as we expected. In the following days, the pair invalidated a breakdown below the upper line of the rising trend channel, which was a bullish signal that triggered a sharp rally and a breakout above the recent high. Despite this bullish signal, USD/CAD still remains below the key resistance line, which currently intersects the strong resistance zone that we discussed earlier (please note that this area is also reinforced by the 161.8% Fibonacci extension). Taking all the above into account, and combining it with the position of the indicators, it seems to us that the next move will be to the downside. In this case, the initial downside target will be around 1.1031, where the 38.2% Fibonacci retracement based on the recent rally is.
Very short-term outlook: bearish
Short-term outlook: bearish
MT outlook: mixed with bearish bias
LT outlook: bearish
Trading position (short-term): In our opinion no positions are justified from the risk/reward perspective at the moment. We will keep you informed should anything change, or should we see a confirmation/invalidation of the above.
USD/CHF
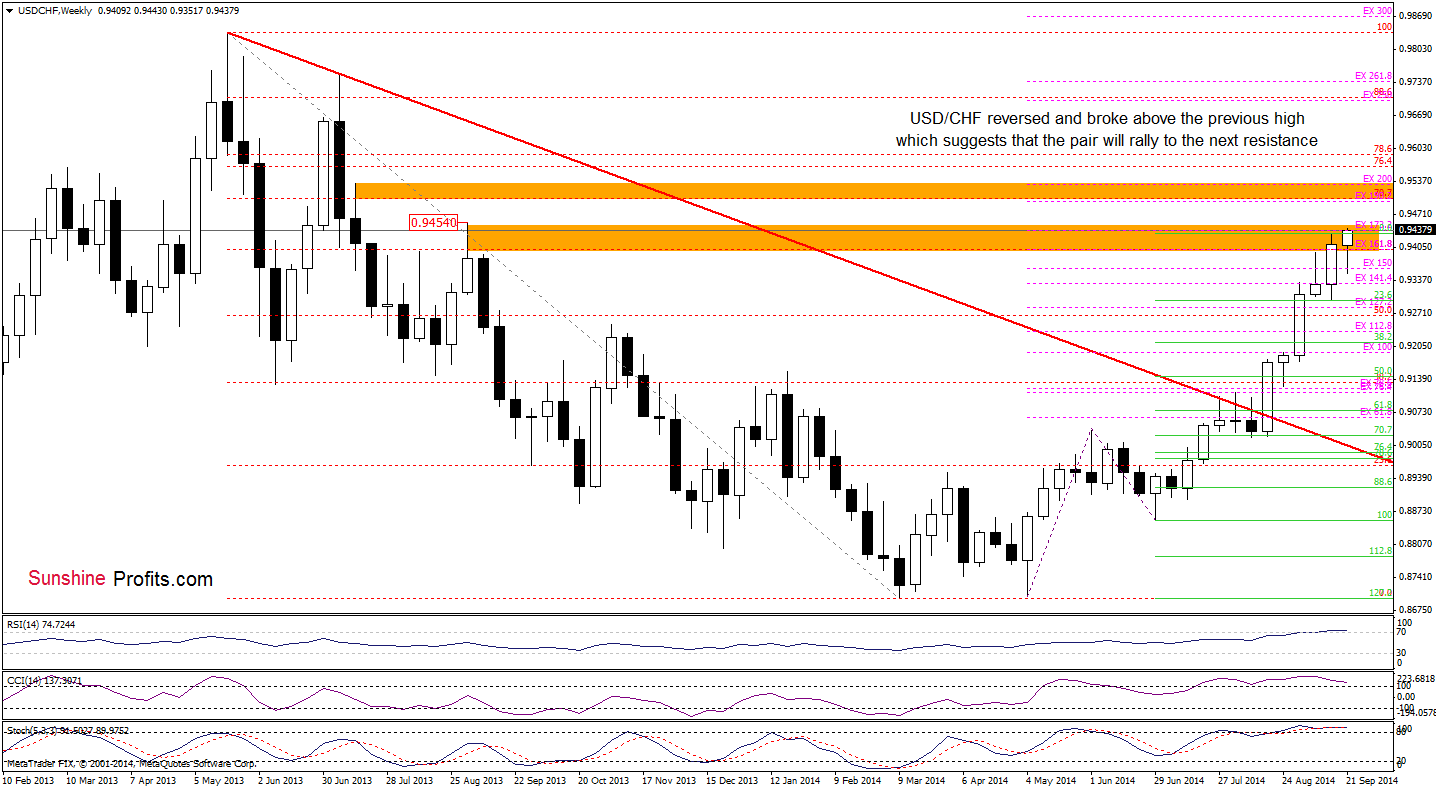
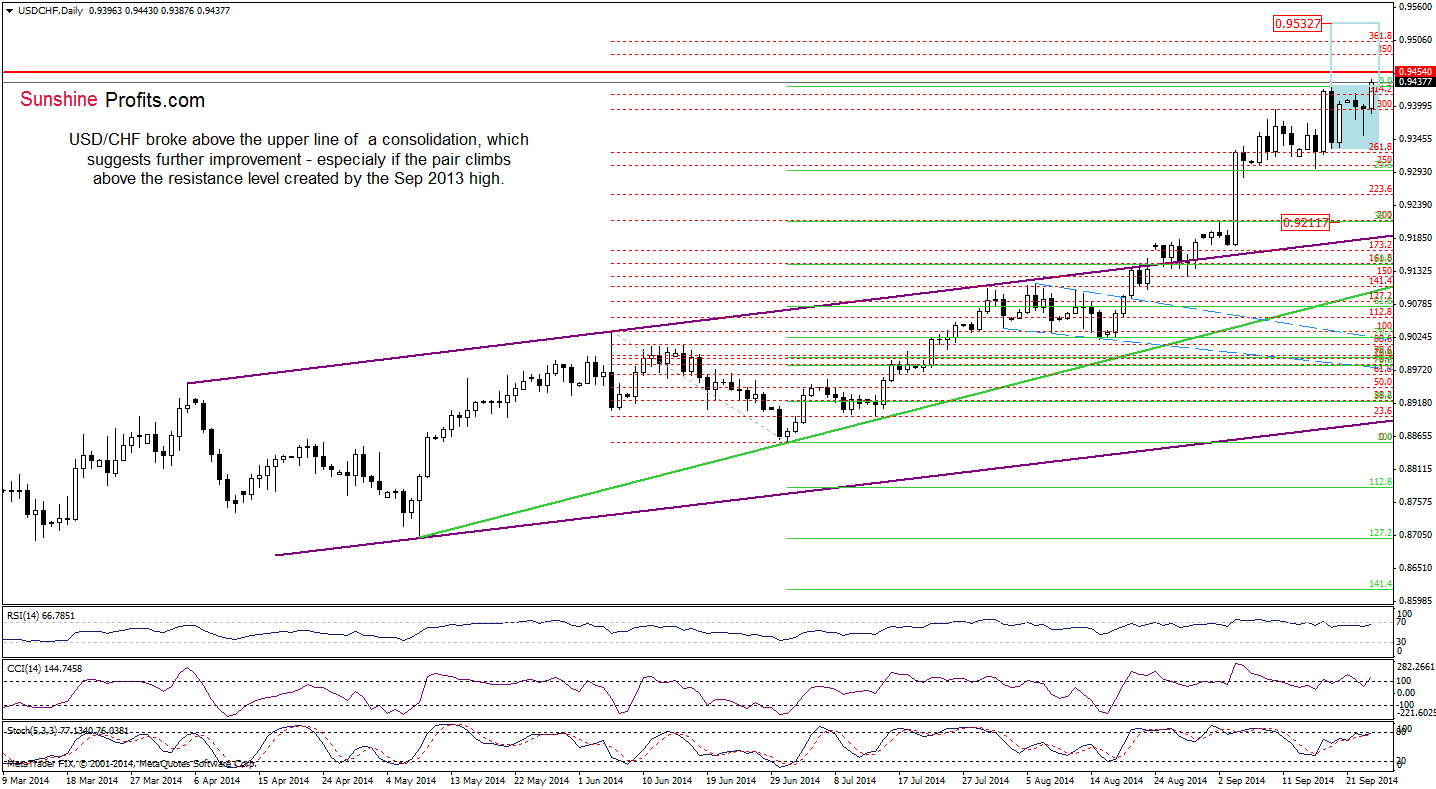
The first thing that catches the eye on these charts is a breakout above the recent high and the upper line of the consolidation. This bullish signal suggests further improvement and an increase to auround 0.9532, where the size of the upswing will correspond to the height of the formation (in this area is also the next resistance zone marked on the weekly chart). As you see, the pair reached a resistance level created by the Sep 2013 high (which is also an upper border of the resistance zone marked on the weekly chart) earlier today. If USD/CHF breaks above it, it will be a strong positive signal, which will support further rally. Nevertheless, we should keep in mind that there are negative divergences between all indicators and the exchange rate, which prescribe caution before making investment decisions.
Very short-term outlook: mixed
Short-term outlook: mixed
MT outlook: mixed
LT outlook: bearish
Trading position (short-term): In our opinion no positions are justified from the risk/reward perspective. We will keep you informed should anything change, or should we see a confirmation/invalidation of the above.
Thank you.
Nadia Simmons
Forex & Oil Trading Strategist
Przemyslaw Radomski, CFA
Founder, Editor-in-chief
Gold & Silver Trading Alerts
Forex Trading Alerts
Oil Investment Updates
Oil Trading Alerts

