
Yesterday, Fed officials cut monthly bond purchases by $10 billion, advancing the central bank's plans to close its quantitative easing program at its Oct. 28-29 meeting. In response, the U.S. dollar rallied against other currencies. Taking this fact into account, we decided not to wait until Friday, but today take a closer look at the major currency pairs and find out what impact did this U.S. dollar’s rally have on their outlooks.
We are close to re-opening the positions aiming to profit from the big reversal in the currency market, but it seems that we could see a small continuation of the most recent moves and that opening positions at this time is still too risky.
In our opinion the following forex trading positions are justified - summary:
EUR/USD
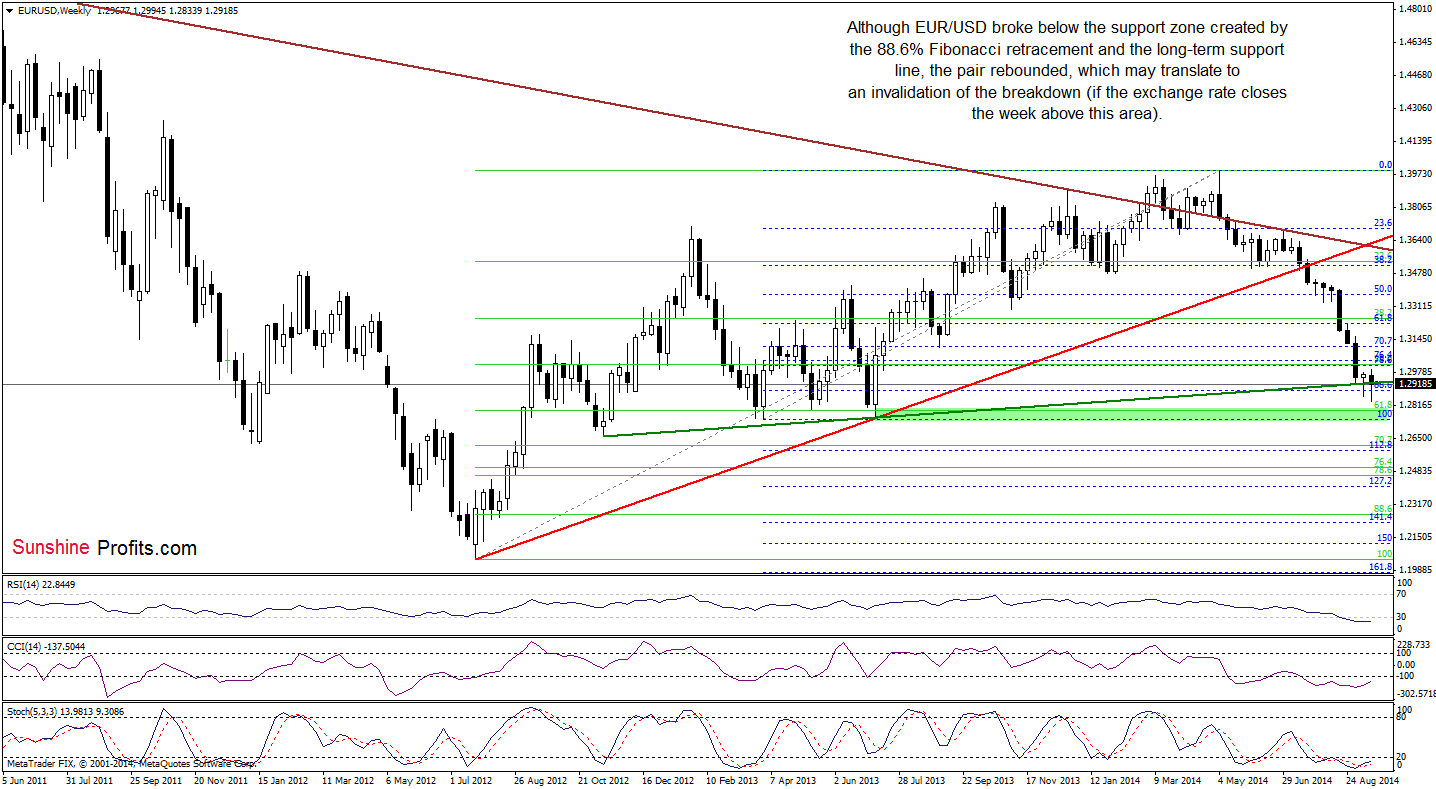
The situation in the medium term has deteriorated as EUR/USD extended losses and dropped below the support zone created by the 88.6% Fibonacci retracement and the long-term green support line based on the Nov 2012 and Jul 2013 lows. Despite this bearish signal, the pair rebounded quickly, which may translate to an invalidation of the breakdown (if the exchange rate closes the week above this area). If this is the case, it would be a strong bullish signal, which will trigger further improvement. On the other hand, if currency bulls fail, the pair will move lower once again and the next downside target will be around 1.2755-1.2796, where the Jul 2013 and the 61.8% Fibonacci retracement are.
Will the daily chart give us more clues about future moves? Let’s find out.
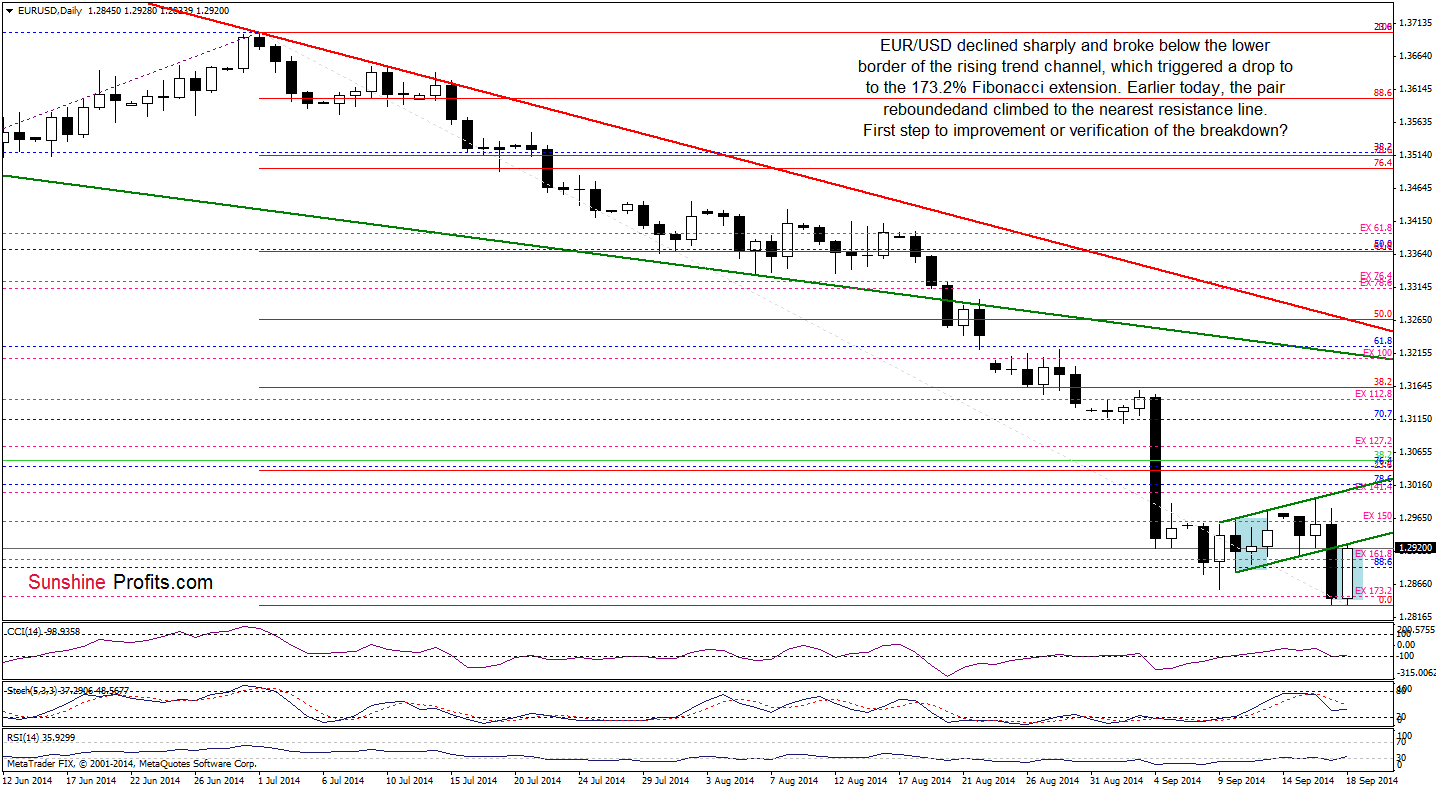
On the above chart, we see that the very short-term situation has deteriorated as EUR/USD dropped below the lower border of the rising trend channel, triggering a sharp decline. As you see, with this downswing, the exchange rate reached the 173.2% Fibonacci extension (in this area the size of the move corresponded to the height of the formation). As a result, the pair rebounded and climbed to the nearest key resistance line. If EUR/USD moves higher from here, we’ll see an invalidation of the breakdown (strong bullish signal) and an increase to at least 1.3000, where the upper line of the rising trend channel is. However, if currency bulls fail, we’ll see a test of the strength of the 173.2% Fibonacci extension, which serves as the nearest support at the moment. Please note that buy signals generated by the CCI and RSI remain in place, supporting bullish case.
Very short-term outlook: mixed with bullish bias
Short-term outlook: mixed with bullish bias
MT outlook: mixed
LT outlook: bearish
Trading position (short-term): In our opinion, no positions are justified from the risk/reward perspective. We will keep you informed should anything change, or should we see a confirmation/invalidation of the above.
GBP/USD
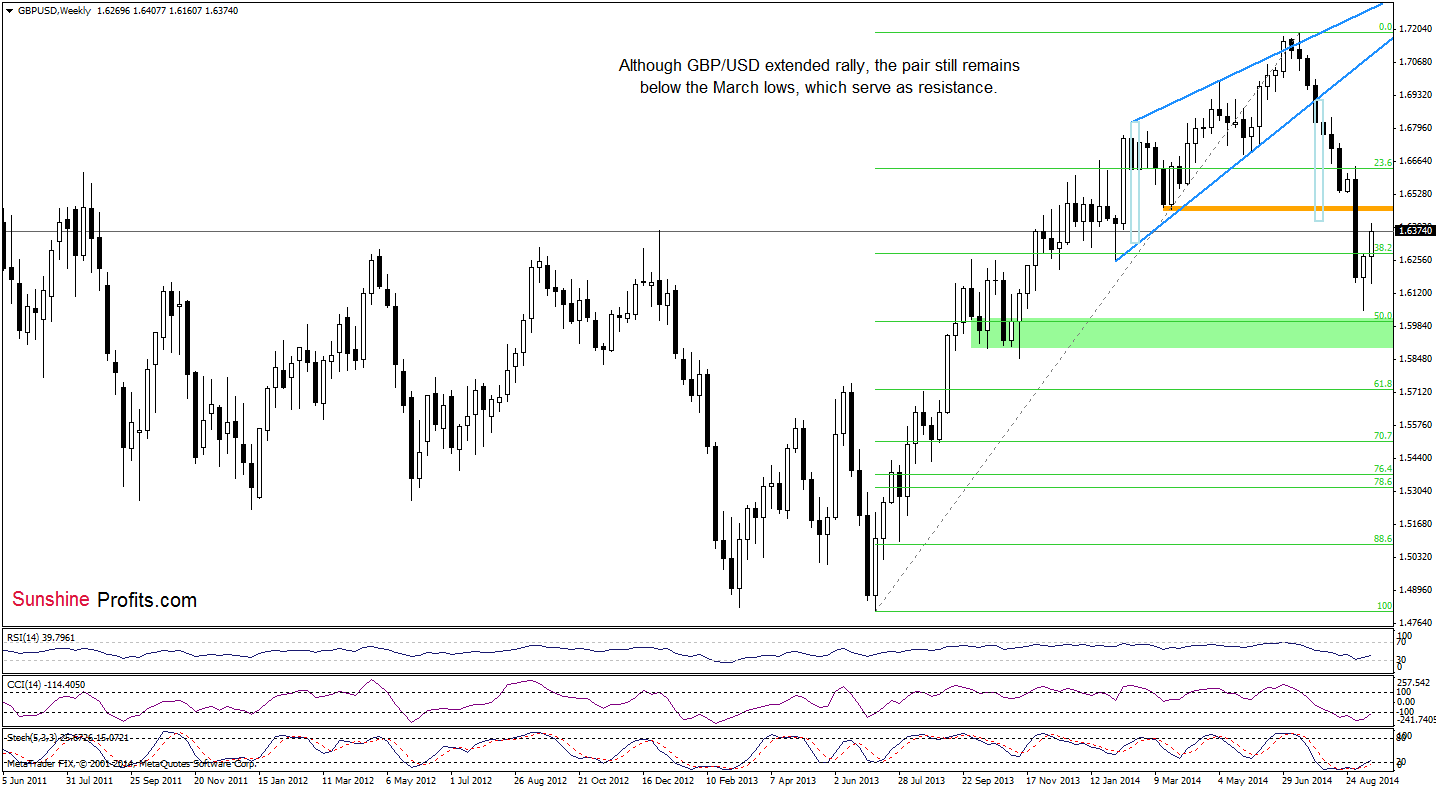
The medium-term picture has improved slightly as GBP/USD extended rally. Despite this move, the pair is still trading below the March lows, which serve as the nearest resistance that could stop further improvement.
Having say that, let’s focus on the daily chart.
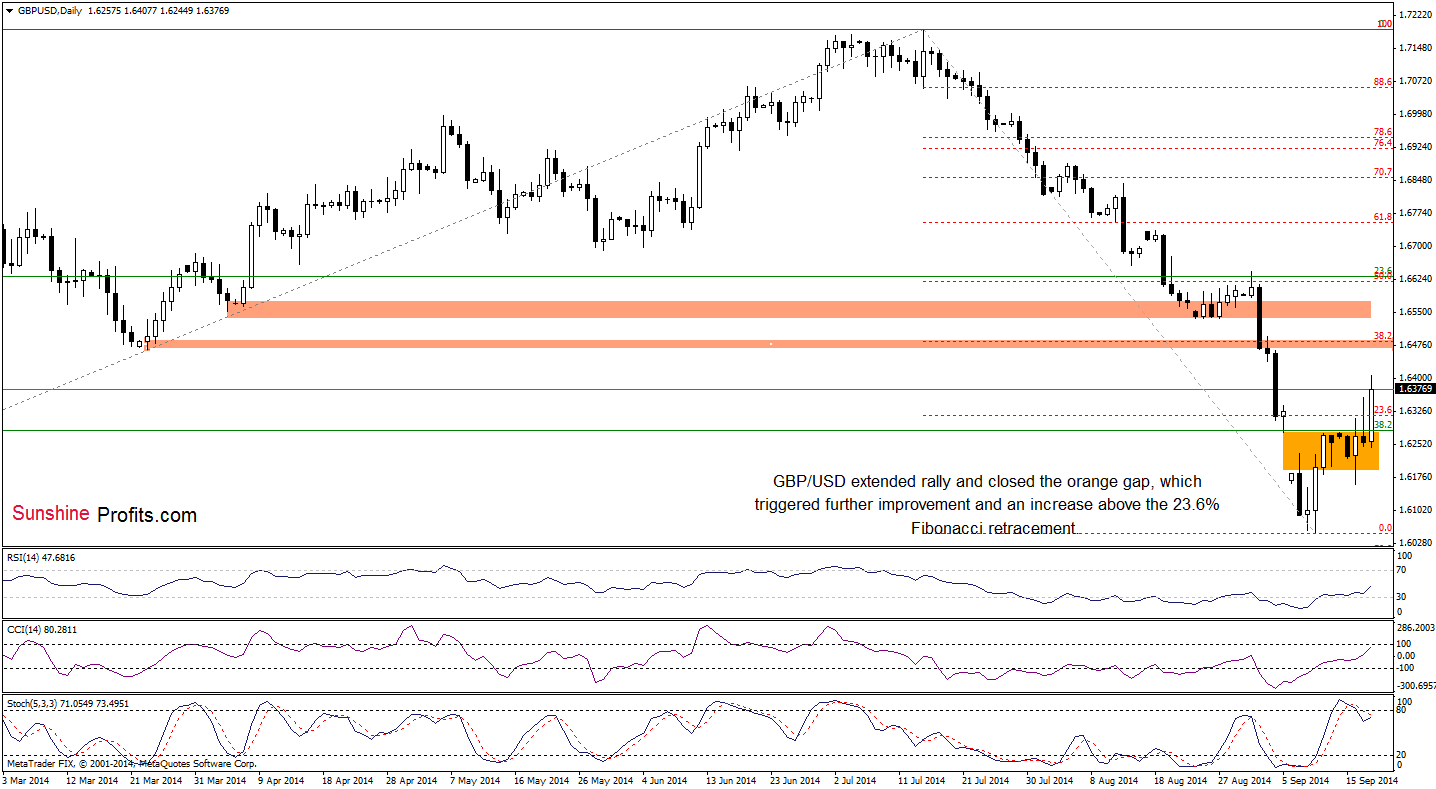
The first thing that catches the eye on the above chart is a sharp increase above the upper line of the orange gap. With this upswing, GBP/USD closed this bearish formation, which triggered further improvement and an increase above the 23.6% Fibonacci retracement (based on the entire Jul-Sep decline). This is a positive signal, which suggests a rally to the next resistance zone around 1.6479, where the March low meets the 38.2% Fibonacci retracement. At this point, it’s worth noting that the current position of the indicators supports this pro-growth scenario.
Very short-term outlook: bullish
Short-term outlook: mixed
MT outlook: mixed
LT outlook: mixed
Trading position (short-term): In our opinion, no positions are justified from the risk/reward perspective. We will keep you informed should anything change, or should we see a confirmation/invalidation of the above.
USD/JPY
In our Forex Trading Alert posted on Sep 12, we wrote the following:
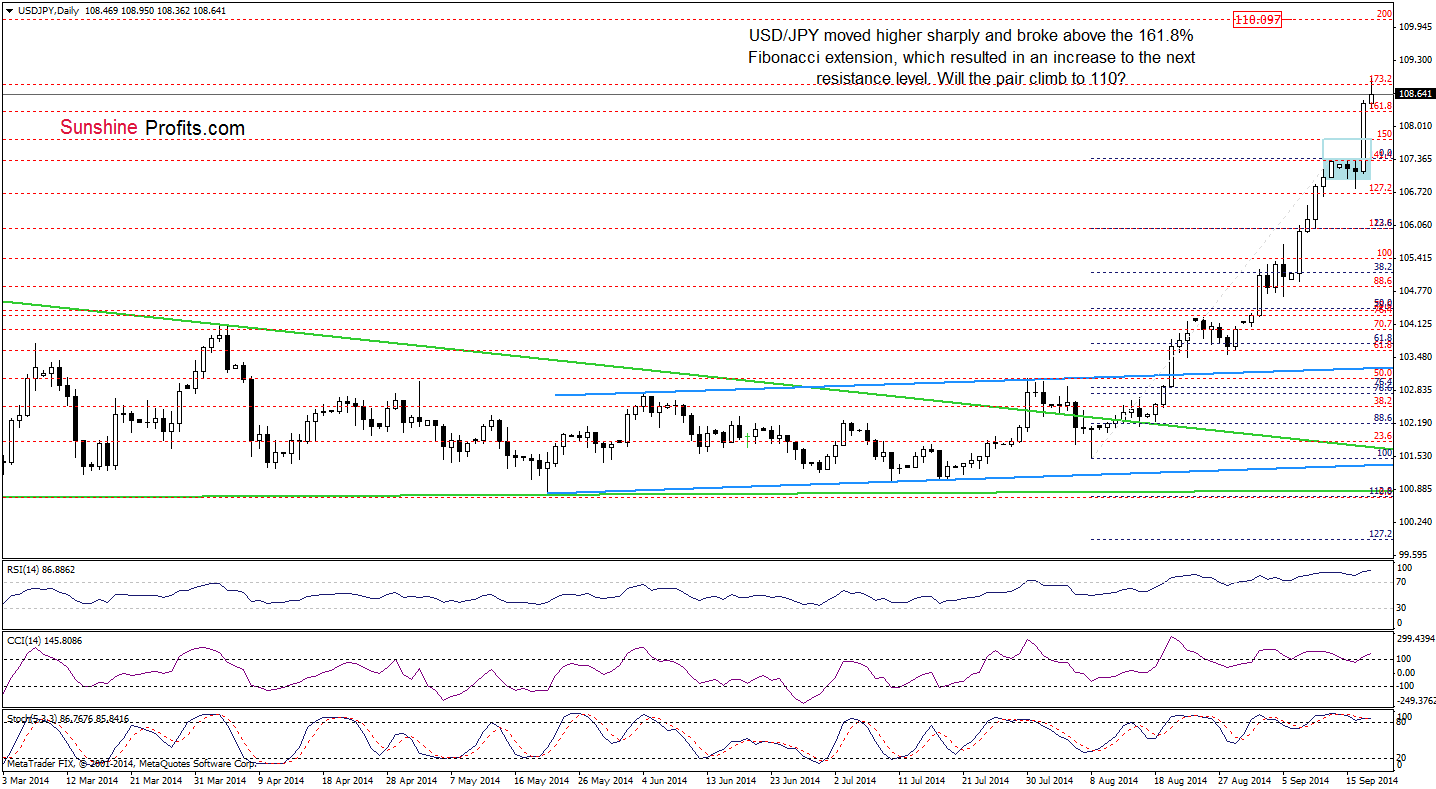
(…) if we don’t see a bigger or at least similar correction to the one that we saw at the beginning of August, we think that USD/JPY will climb to around 108.30 (please note that this area is reinforced by the 161.8% Fibonacci extension) in the coming weeks.
As you see on the above chart, currency bulls not only realized the above-mentioned scenario, but also managed to push the pair above the 161.8% Fibonacci extension, which resulted in an increase to the 173.2% Fibonacci extension, which serves as the nearest resistance. Will USD/JPY move higher? The current position of the indicators (they are all overbought and there are negative divergences between the CCI, Stochastic Oscillator and the exchange rate) suggests that correction is just around the corner. However, as long as there are no sell signals, another attempt to move higher can’t be ruled out.
How high could USD/JPY climb? Let’s move on to the weekly chart and look for answer to this question.
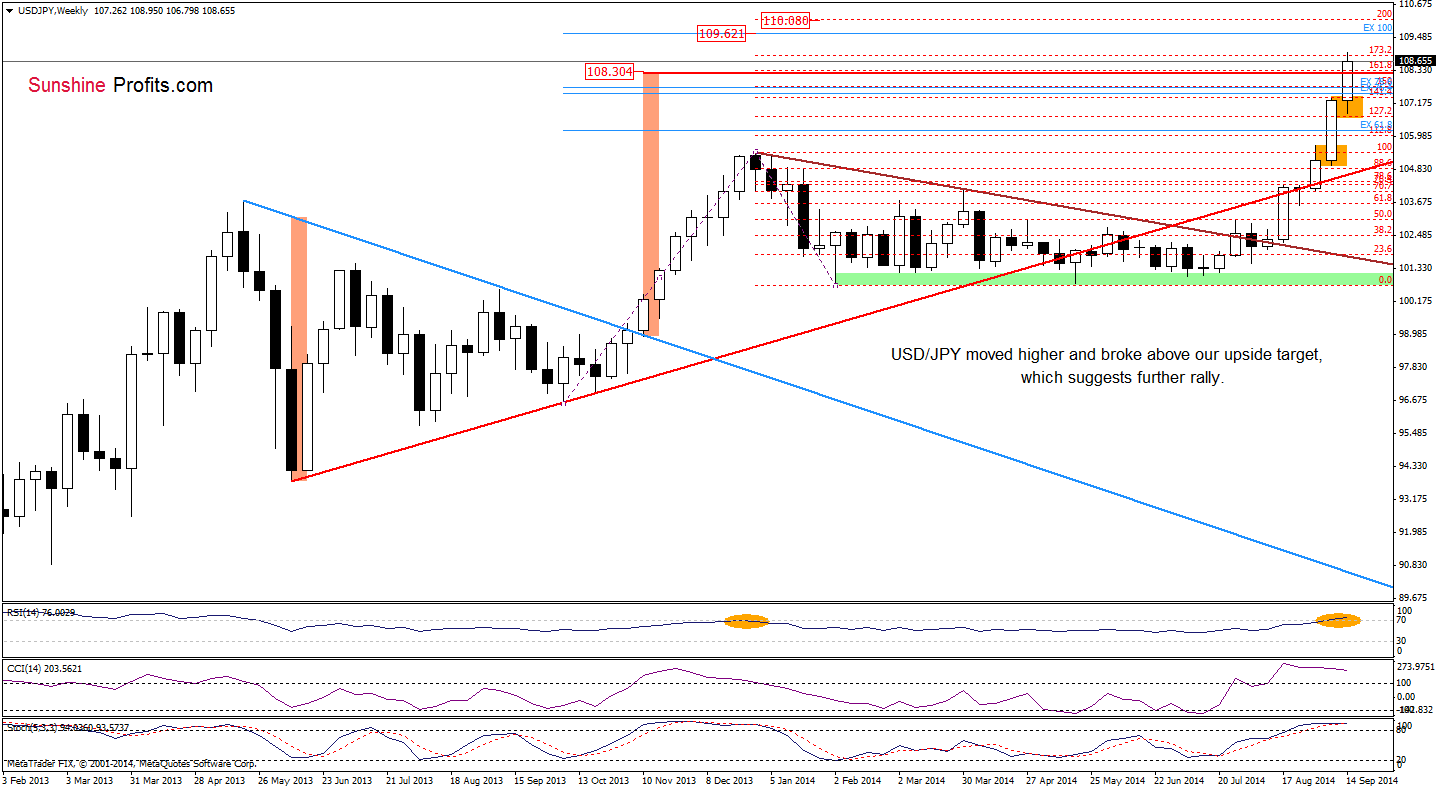
From this perspective, we see that if USD/JPY breaks above the 2014high, the next upside target would be around 109.62, where the 100% Fibonacci price projection (based on the Oct and Feb lows and Dec high) is. If this level is broken, the exchange rate could climb even to 110, where the 200% Fibonacci extension is.
Before we move to the next currency pair, please note that RSI climbed to its highest level since Dec, while the CCI and Stochastic Oscillator are overbought (there are also negative divergences between them and the exchange rate), which prescribe caution before making investment decisions because such position of the indicators suggests that a pause or bigger correction is just around the corner.
Very short-term outlook: mixed
Short-term outlook: mixed
MT outlook: mixed
LT outlook: bearish
Trading position (short-term): In our opinion no positions are justified from the risk/reward perspective at the moment. We will keep you informed should anything change, or should we see a confirmation/invalidation of the above.
USD/CAD
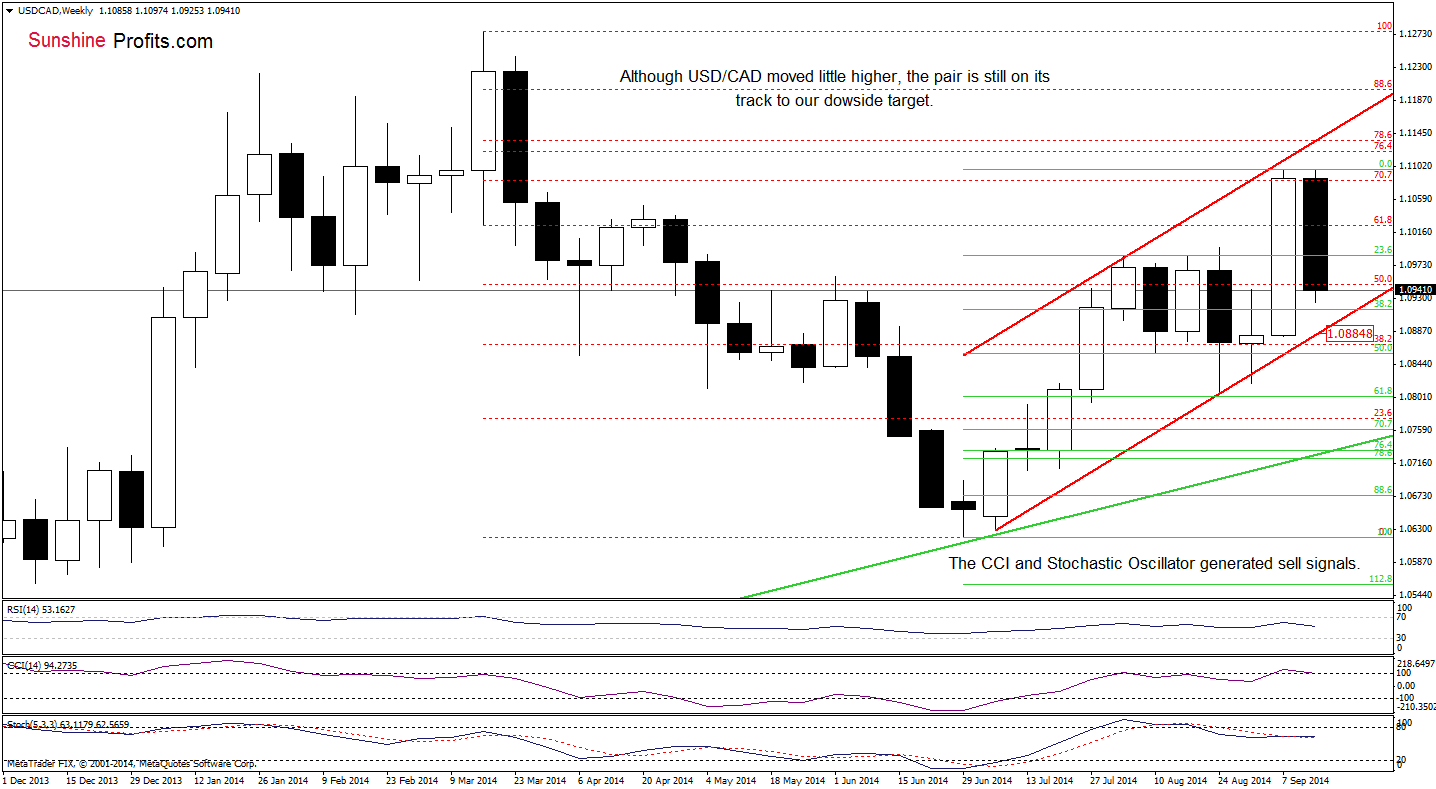
On the weekly chart, we see that the medium-term outlook hasn’t changed much, therefore, what we wrote yesterday is up-to-date:
(…) the exchange rate invalidated a breakout above the recent highs. This is a bearish signal, which suggests that USD/CAD will likely test the strenght of the red support line (around 1.0885), which is also the lower border of the rising trend channel. Please note that this scenario is currently reinforced by sell signals generated by the indicators.
Having say that, let’s examine the daily chart.
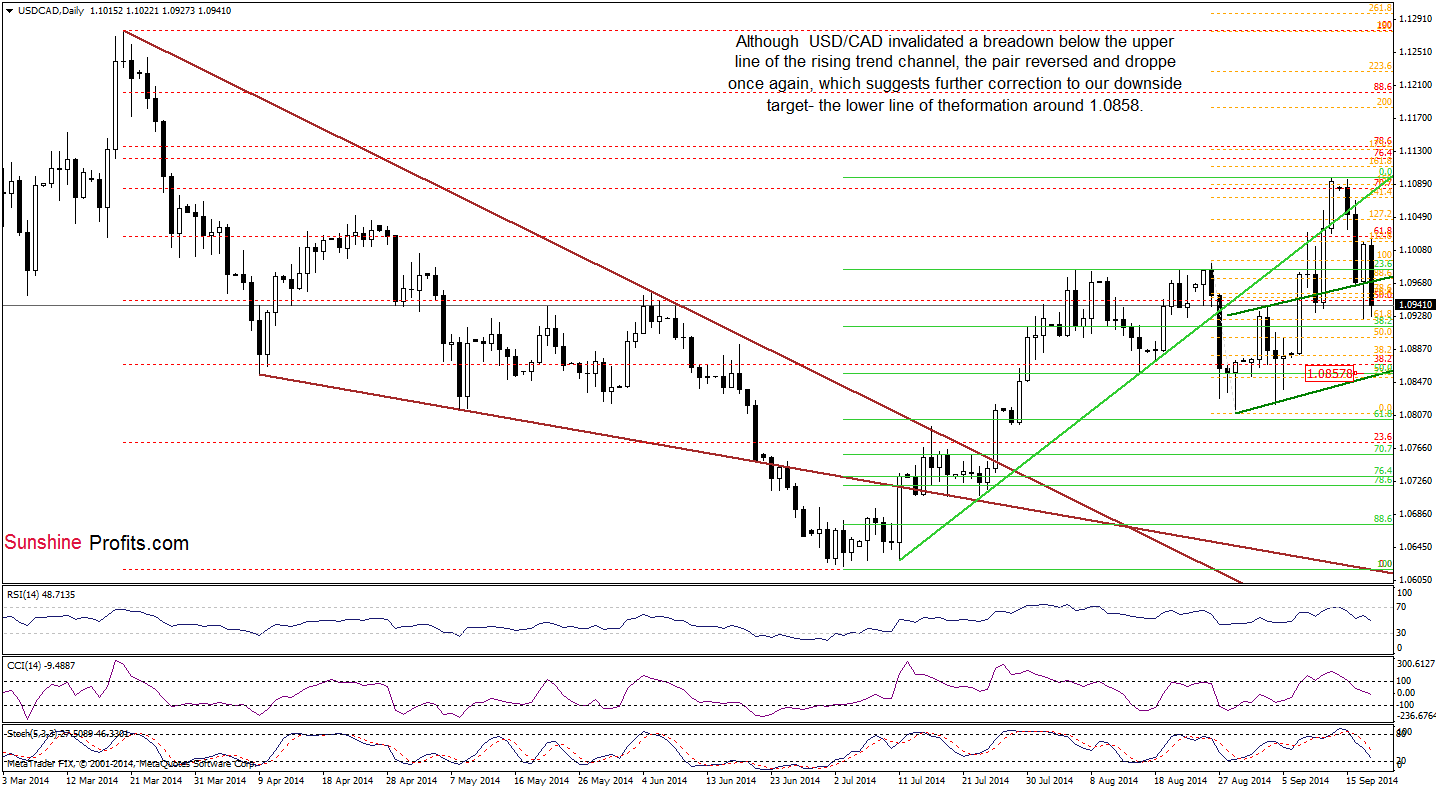
As you see on the above chart, although USD/CAD invalidated a breakdown below the upper line of the rising trend channel, the pair reversed and declined sharply earlier today. With this downswing, the exchange rate came back under its key support/resistance line, which means that our last commentary is even more likely than yesterday:
(…) we believe that USD/CAD will extend the current correction to at least 1.0915, where the 38.3% Fibonacci retracement (based on the entire Jul-Sep rally) is. If this support is broken, the next downside target will be around 1.0858, where the 50% Fibonacci retracement meets the lower border of the rising trend channel.
Very short-term outlook: bearish
Short-term outlook: bearish
MT outlook: mixed
LT outlook: bearish
Trading position (short-term): In our opinion no positions are justified from the risk/reward perspective at the moment. We will keep you informed should anything change, or should we see a confirmation/invalidation of the above.
USD/CHF
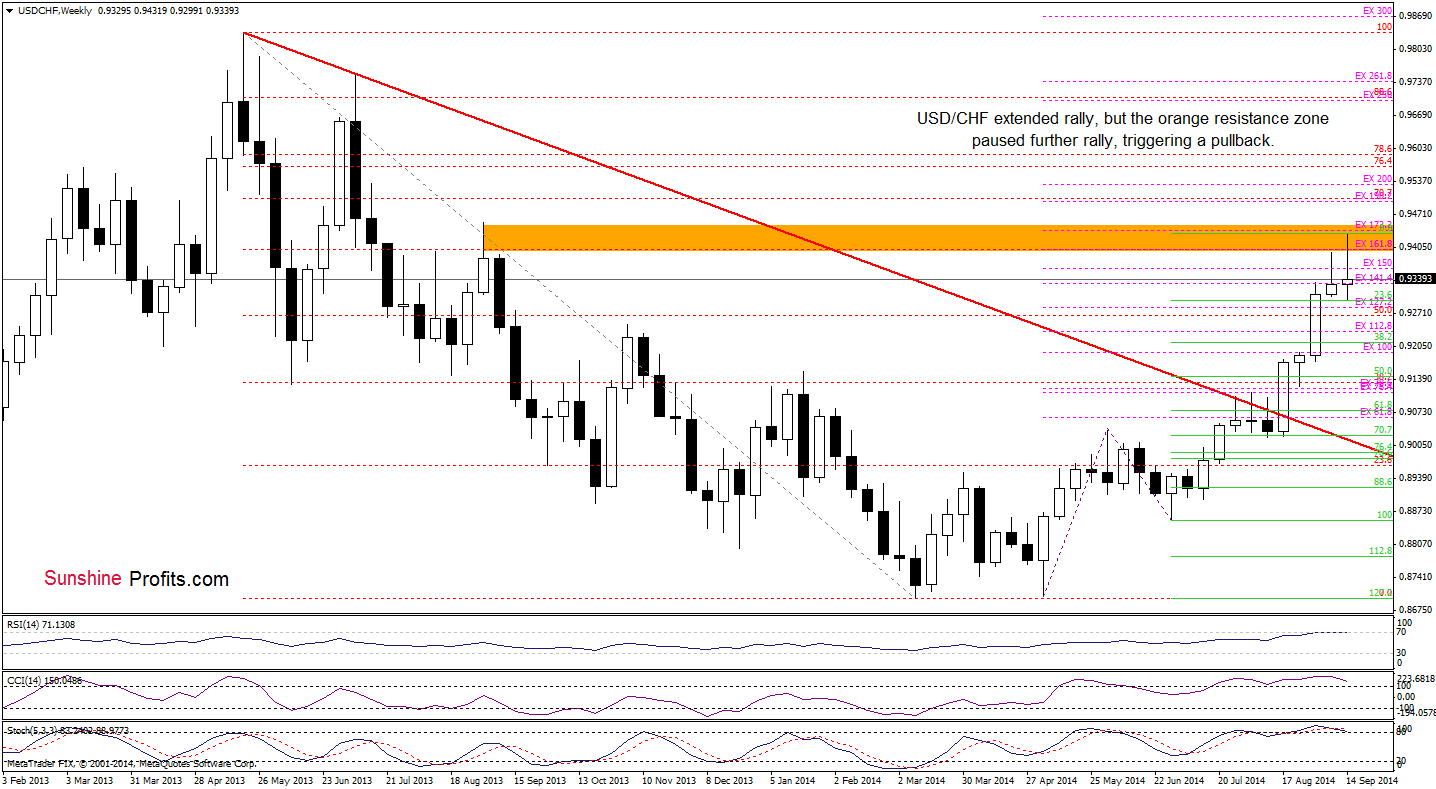
The medium-term outlook has deteriorated as USD/CHF reversed after an increase to the orange rsistace zone (created by the 161.8% and 173.2% Fibonacci price projections, the 61.8% Fibonacci retracement and the Sep 2013 high. Will we see further deterioration? Let’s examine the daily chart and check.
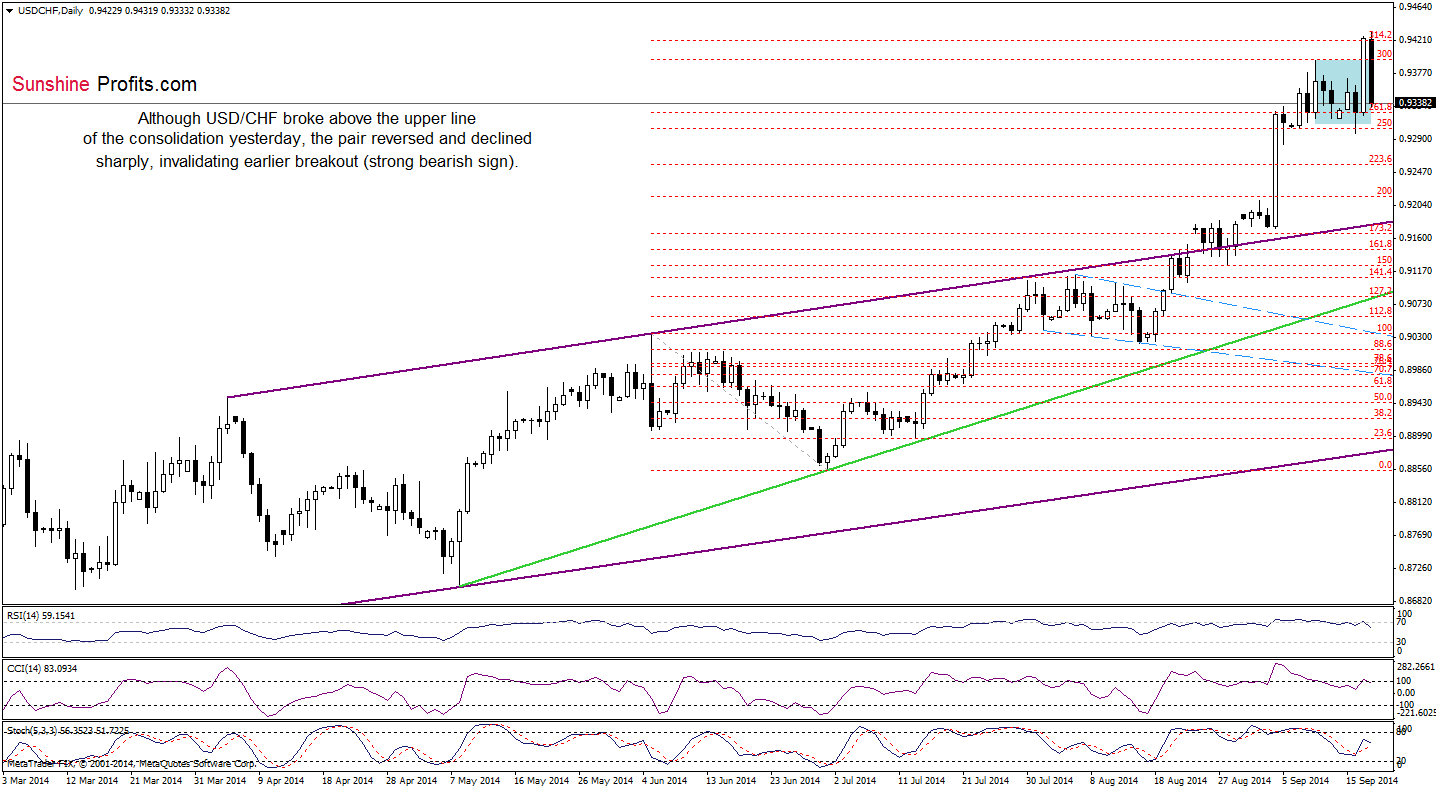
From this perspective, we see that although USD/CHF broke above the upper line of the consolidation, currency bulls didn’t manage to realize a pro-growth scenario (an increase to around 0.9471,where the size of the upswing would correspond to the height of the formation). As a result, the exchange rate reversed and declined sharply earlier today. With this downswing, USD/CHF dropped below the recent highs, invalidating earlier breakout. This is a bearish signal (especially when we factor in sell signals generated by all three indicators), which suggests further deterioration. If this is the case, and the exchange rate drops below the bottom of the recent pullback (at 0.9299), the correction will likely accelerate and the initial downside target will be around 0.9212, where the 38.2% Fibonacci retracement based on the Jun-Sep rally is.
Very short-term outlook: mixed with bearish bias
Short-term outlook: mixed with bearish bias
MT outlook: mixed with bullish bias
LT outlook: bearish
Trading position (short-term): In our opinion no positions are justified from the risk/reward perspective. We will keep you informed should anything change, or should we see a confirmation/invalidation of the above.
AUD/USD
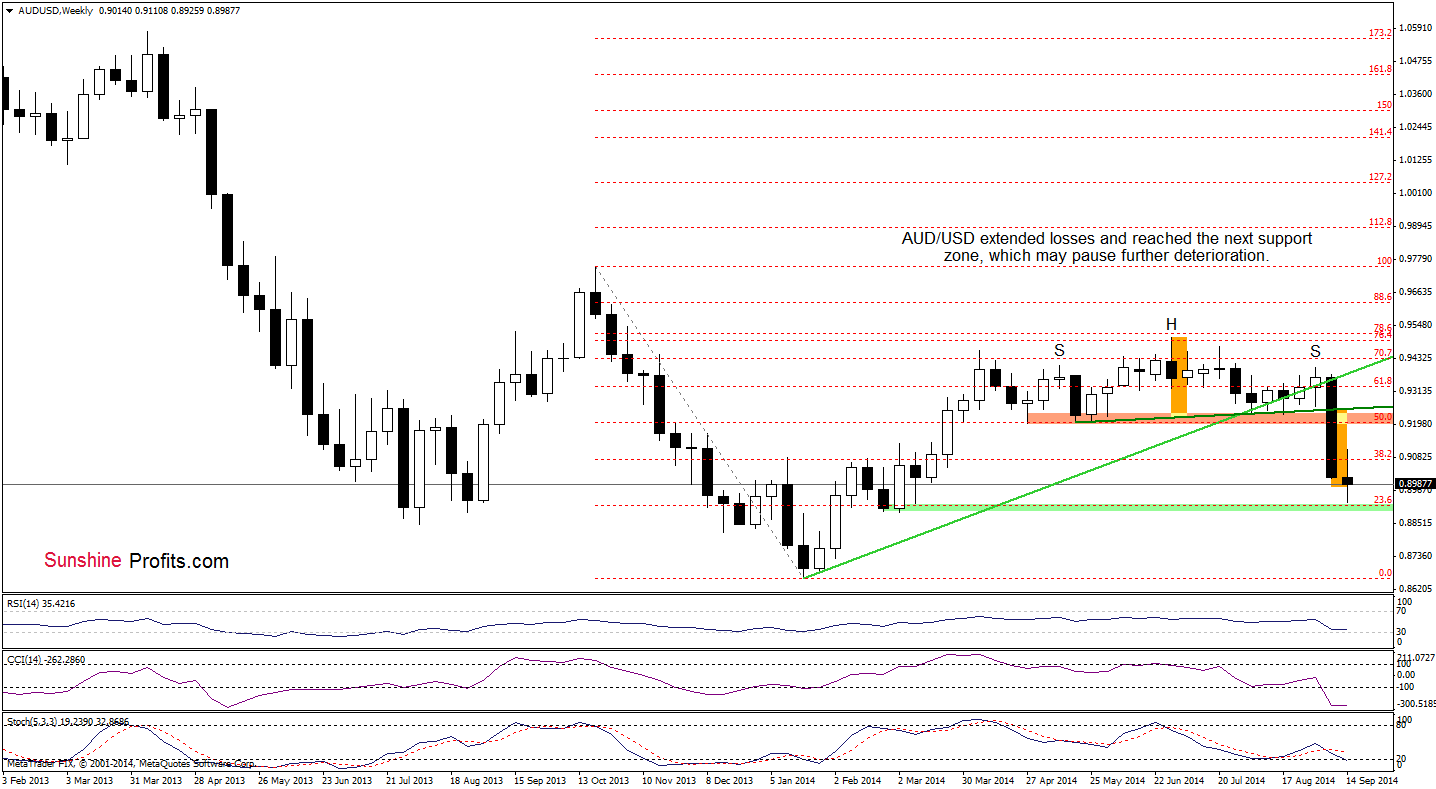
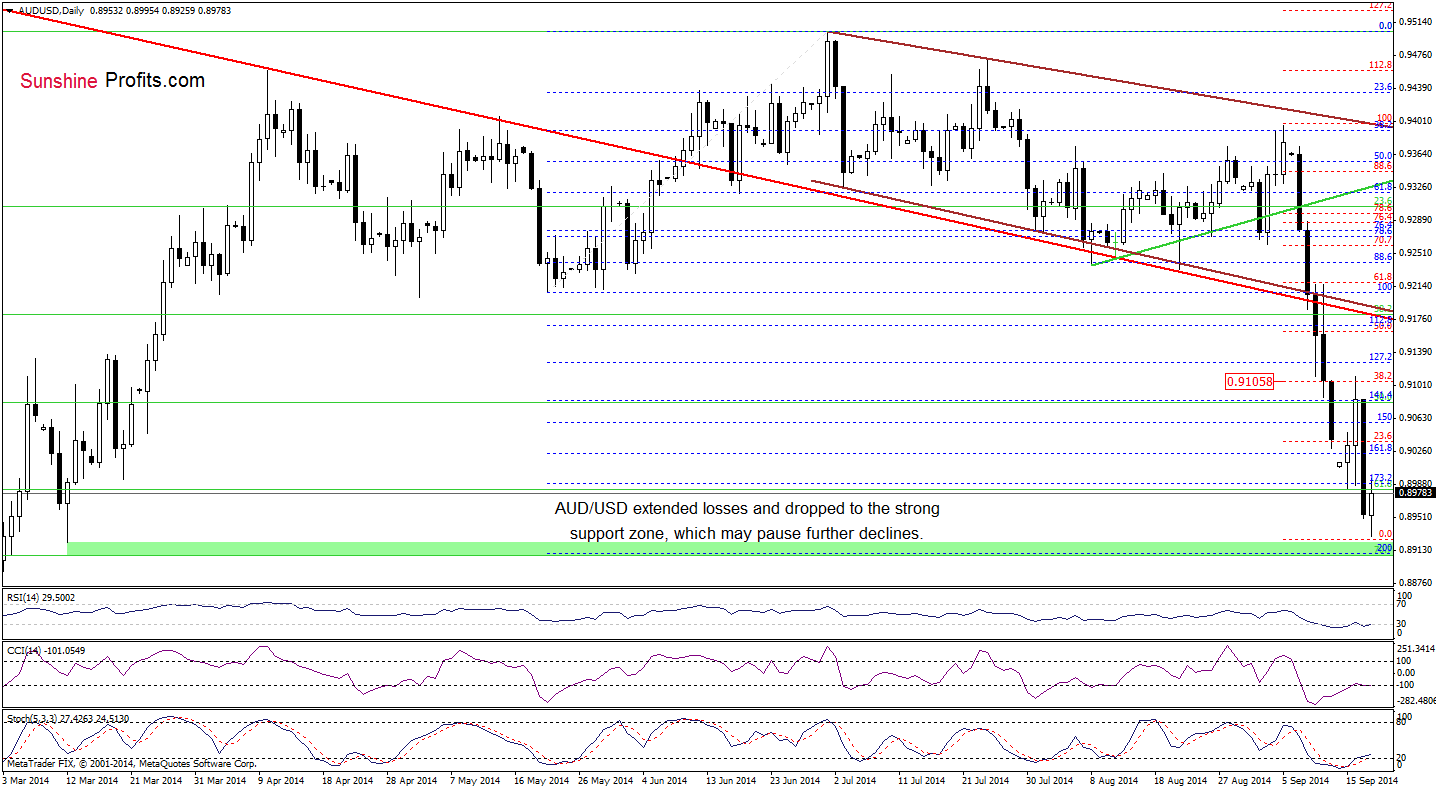
Looking at the above charts, we clearly see that currency bears managed to push the pair lower,which resulted in a drop to the next support zone (created by the 200% Fibonacci extension, 70.7% fibonacci retracement and the March 12 low). Taking this fact into account and combining it with the current position of the short-term indicators (they all generated buy signals), it seems to us that the next move will be to the upside. If this is the case, the initial target will be around 0.9106, where the recent high and the 38.2% Fibonacci retracement based on the September decline is.
Very short-term outlook: mixed with bullish bias
Short-term outlook: mixed
MT outlook: mixed
LT outlook: bearish
Trading position (short-term): In our opinion no positions are justified from the risk/reward perspective. We will keep you informed should anything change, or should we see a confirmation/invalidation of the above.
Thank you.
Nadia Simmons
Forex & Oil Trading Strategist
Przemyslaw Radomski, CFA
Founder, Editor-in-chief
Gold & Silver Trading Alerts
Forex Trading Alerts
Oil Investment Updates
Oil Trading Alerts

