
Although data showed that the Empire State manufacturing index rallied to 27.5 from 14.7 in August (beating analysts’ expectations for an increase to 16), U.S. manufacturing activity unexpectedly fell 0.4% in the previous month. Thanks to these mixed numbers, the U.S. dollar slipped against the Swiss franc, but did this drop change anything?
In our opinion the following forex trading positions are justified - summary:
- EUR/USD: long (stop-loss order: 1.2846; initial price target: 1.3200)
- GBP/USD: none
- USD/JPY: none
- USD/CAD: none
- USD/CHF: none
- AUD/USD: none
EUR/USD
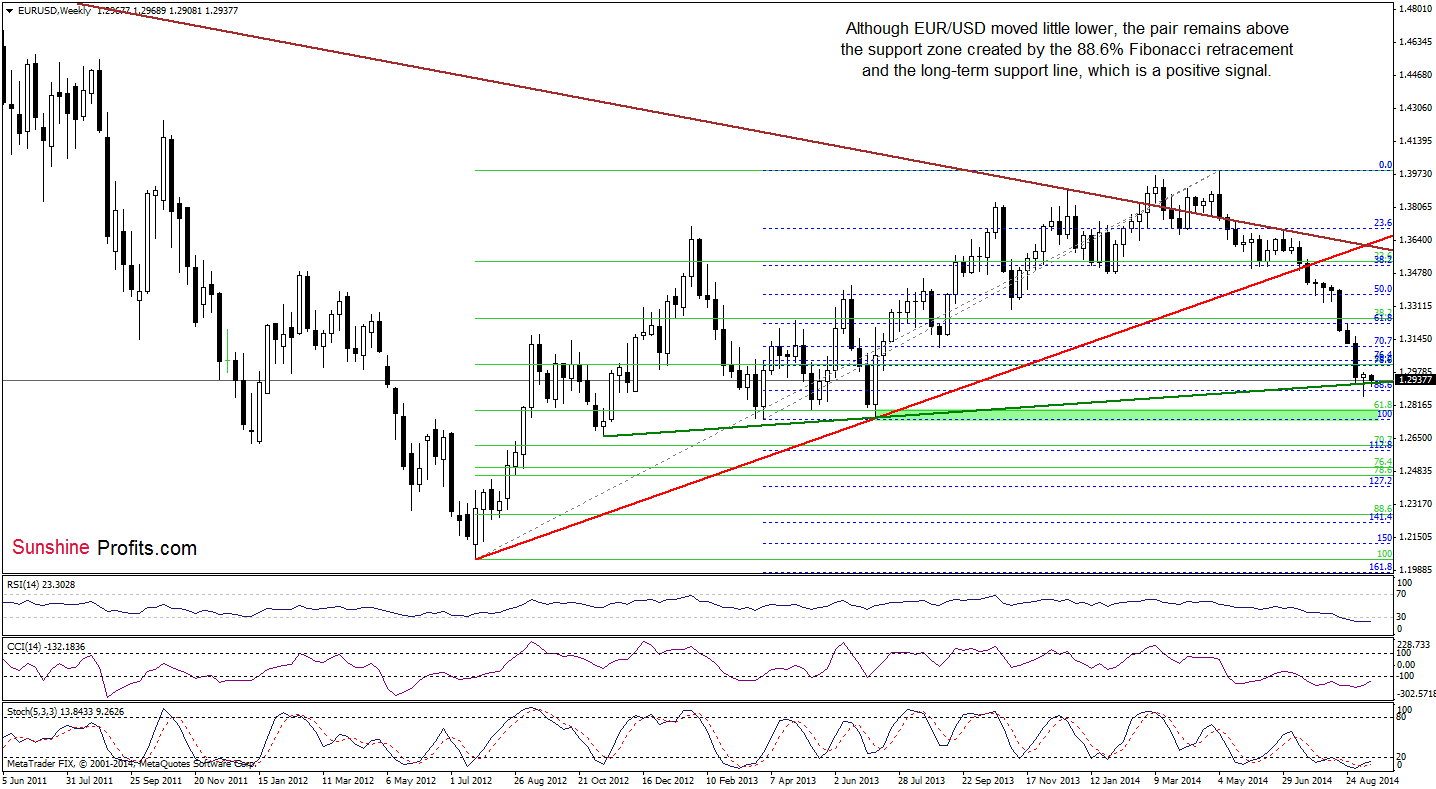
The medium-term picture hasn’t changed much and EUR/USD still remains above the support zone created by the 88.6% Fibonacci retracement and the long-term green support line based on the Nov 2012 and Jul 2013 lows.
What can we infer from the daily chart?
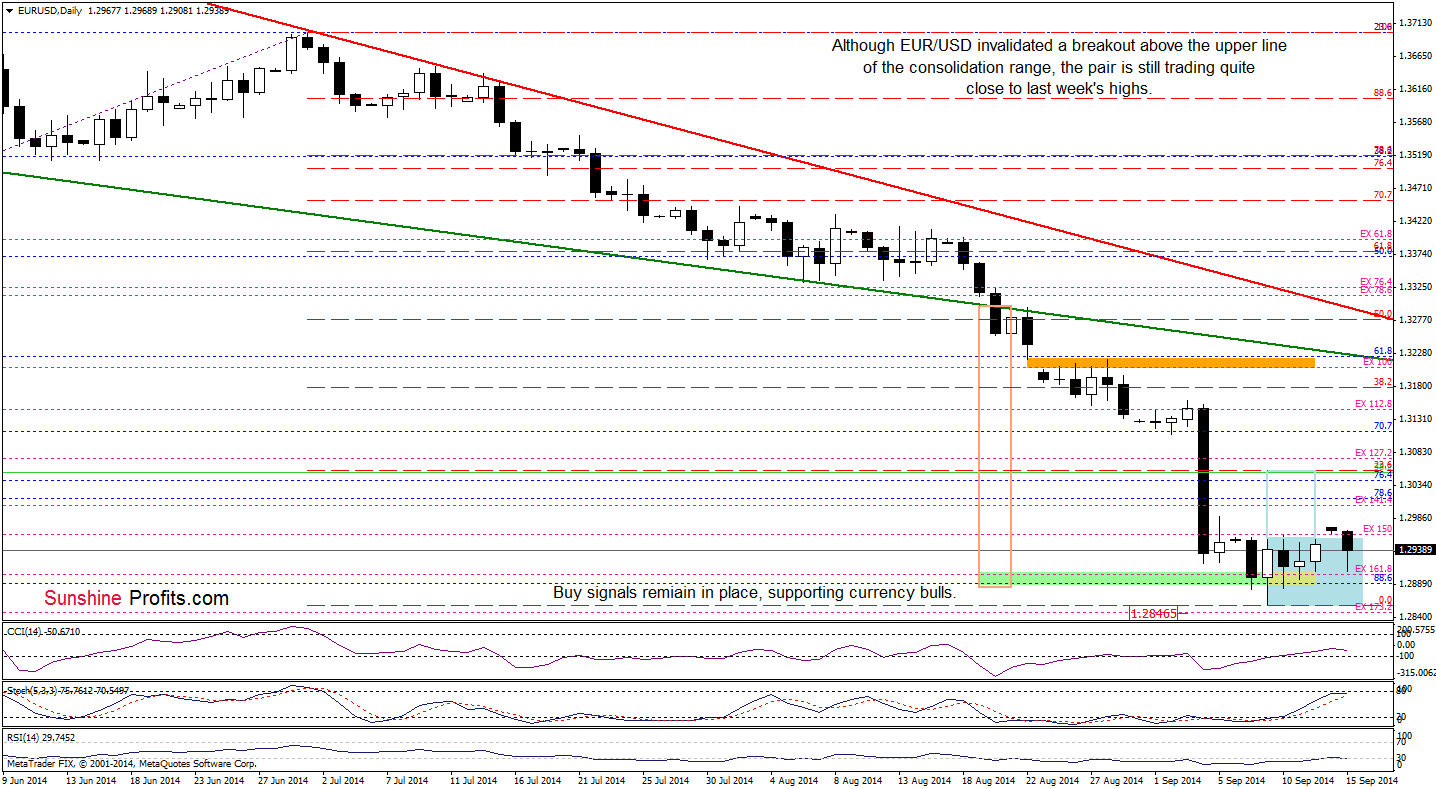
From this perspective, we see that although EUR/USD invalidated a breakout above the upper line of the consolidation, the pair is still trading in a narrow range, near last week’s highs. Taking this fact into account, and combining it with buy signals generated by the indicators and the strong medium-term support zone, we think that currency bulls will try to push the pair higher once again. If this is the case, the initial upside target will be around 1.3055, where the size of the upswing would correspond to the height of the formation and the 23.6% Fibonacci retracement (based on the Jul-Sep decline) is.
Very short-term outlook: bullish
Short-term outlook: mixed with bullish bias
MT outlook: mixed
LT outlook: bearish
Trading position (short-term; our opinion): Long with a stop-loss order at 1.2846. We will keep you informed should anything change, or should we see a confirmation/invalidation of the above.
USD/JPY
The medium-term picture remains almost unchanged as USD/JPY remains slightly below the resistance level created by the 141.4% Fibonacci extension. Today, we’ll take a closer look at the daily chart.
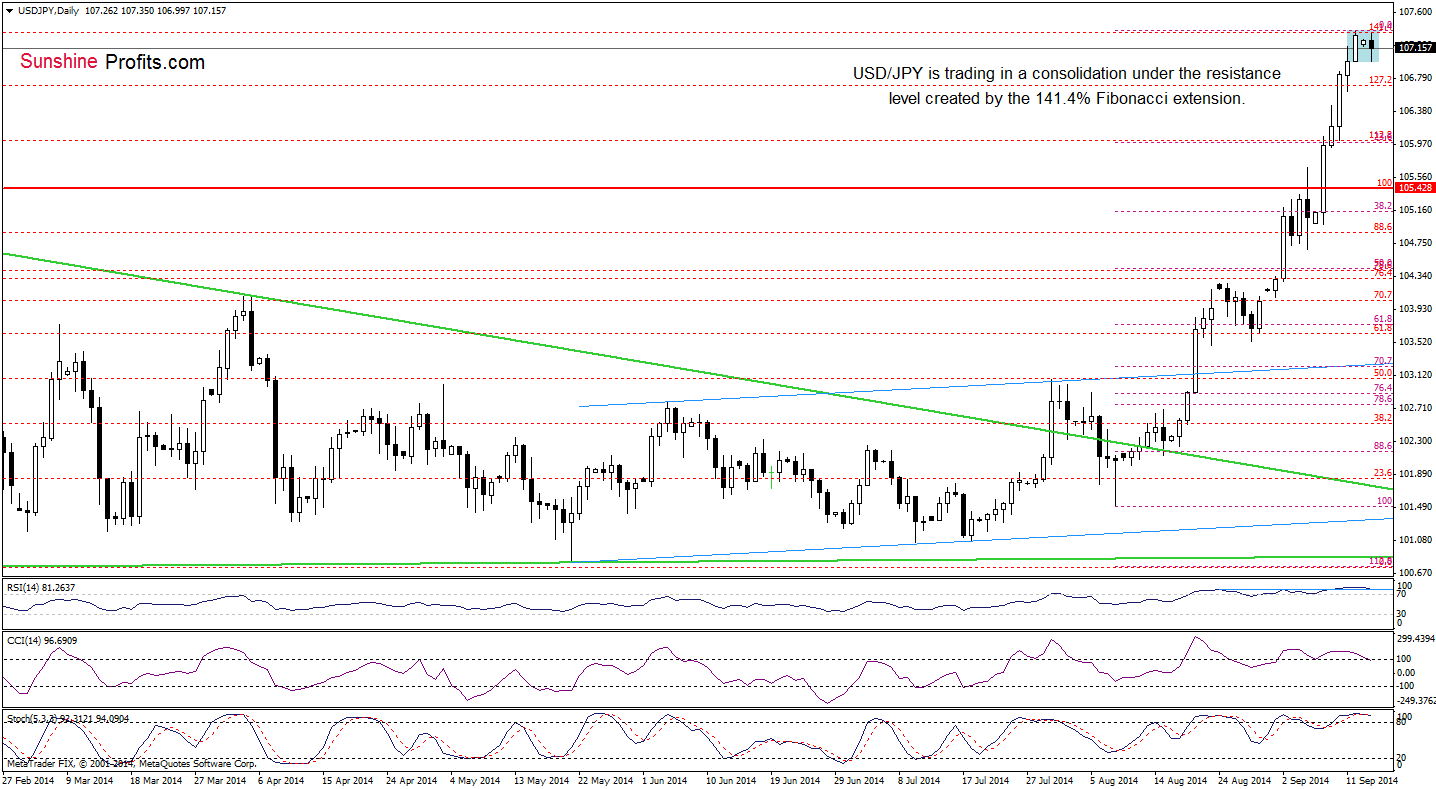
The above chart clearly shows that the situation in the very short-term also hasn’t changed much as the exchange rate is trading in a consolidation between Friday’s high and low. What’s next? We believe that our last commentary will be the best answer to this question:
(…) Looking at the current position of the short-term indicators (the RSI climbed above the level of 84, while the CCI and Stochastic Oscillator are overbought and there are negative divergences between them and the exchange rate), it seems that correction is just around the corner (in this case, the initial downside target will be around 106, where the 23.6% Fibonacci retracement based on the Aug-Sep rally is).
Nevertheless, as long as there are no sell signals another attempt to move higher can’t be ruled out (…) if we don’t see a bigger or at least similar correction to the one that we saw at the beginning of August, we think that USD/JPY will climb to around 108.30 (please note that this area is reinforced by the 161.8% Fibonacci extension) in the coming weeks.
Very short-term outlook: mixed
Short-term outlook: mixed
MT outlook: mixed
LT outlook: bearish
Trading position (short-term): In our opinion no positions are justified from the risk/reward perspective at the moment. We will keep you informed should anything change, or should we see a confirmation/invalidation of the above.
USD/CHF
The medium-term outlook hasn’t changed much as USD/CHF still remains under the strong orange resistance zone created by the 161.8% Fibonacci price projection and the 61.8% Fibonacci retracement. Let’s examine the daily chart and check the very short-term changes.
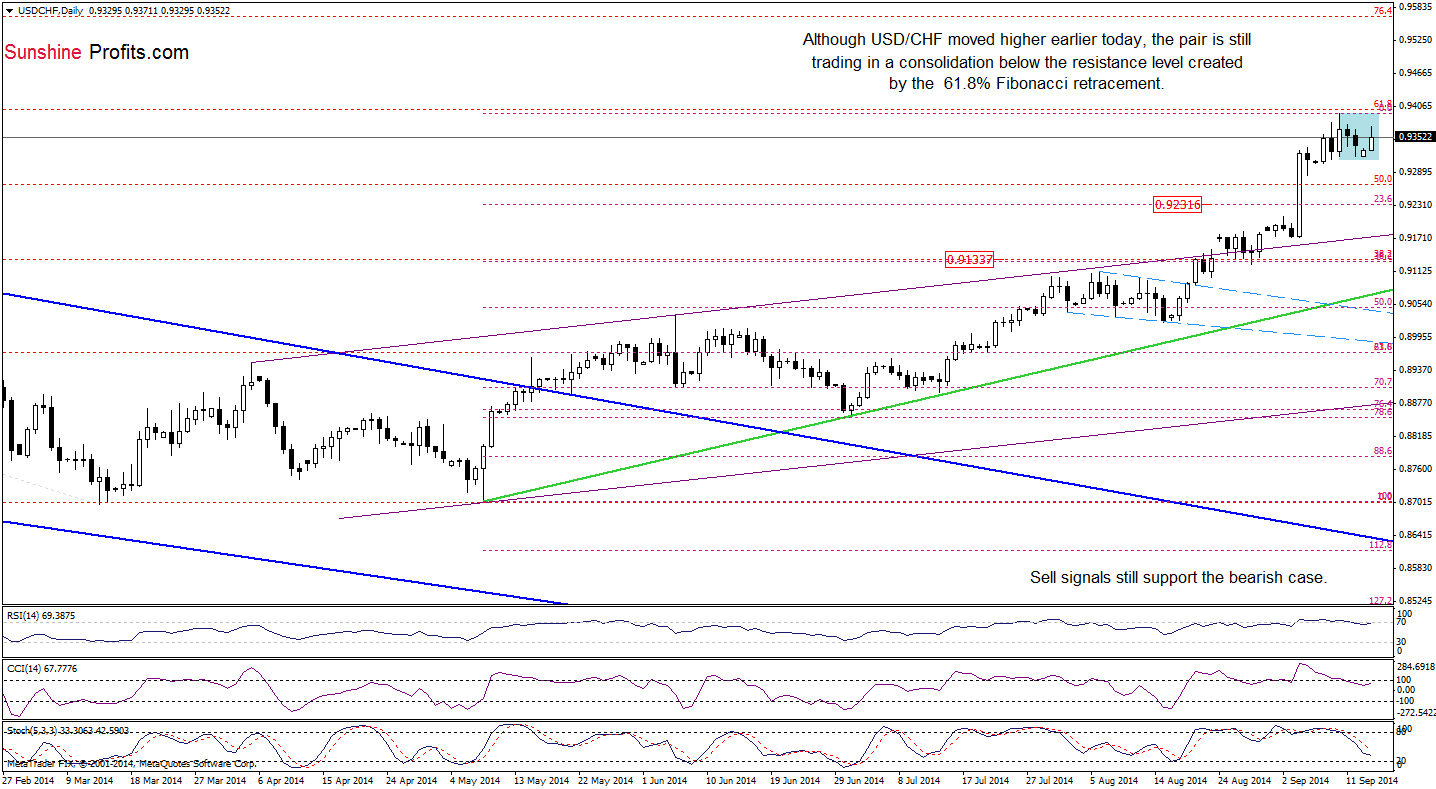
Looking at the above chart, we can summarize the recent days in one simple word: consolidation. Although USD/CHF could go both north or south from here, we think that the next move will be to the downside. Why? As you see on the daily chart, all three indicators generated sell signals, which could encourage currency bears to act – especially if the pair drops below the lower border of the formation (at 0.9318). If this is the case, the correction will accelerate and the initial downside target will be around 0.9232, where the size of the downswing will correspond to the height of the formation and the 23.6% Fibonacci retracement (based on the entire May-Sep rally) is.
Very short-term outlook: mixed with bearish bias
Short-term outlook: mixed with bearish bias
MT outlook: mixed with bullish bias
LT outlook: bearish
Trading position (short-term): In our opinion no positions are justified from the risk/reward perspective. We will keep you informed should anything change, or should we see a confirmation/invalidation of the above.
Thank you.
Nadia Simmons
Forex & Oil Trading Strategist
Przemyslaw Radomski, CFA
Founder, Editor-in-chief
Gold & Silver Trading Alerts
Forex Trading Alerts
Oil Investment Updates
Oil Trading Alerts

